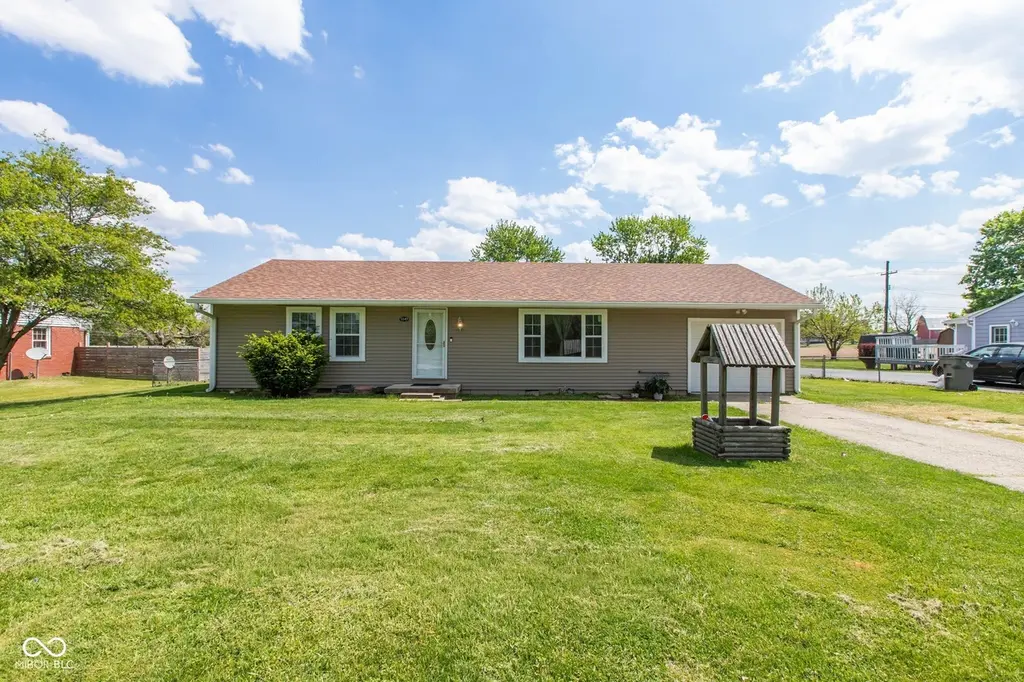
5149 Hickory Rd · Indianapolis city (balance), IN
Flood risk 1/10 · Minimal
- FEMA flood zone
- X (unshaded)
- Chance of flooding over 30 yrs
- 0.0%
- Est. flood insurance / yr
- $507 – $1,088
Fire risk 1/10 · Minimal
- Est. fire insurance / yr
- $717 – $1,331
Heat risk 3/10 · Minor
- Hot days now (above 101°F)
- 7 days/yr
- Hot days in 30 yrs
- 19 days/yr
Wind risk 2/10 · Minimal
- Chance of severe wind over 30 yrs
- 1.0%
Air-quality risk 2/10 · Minimal
- Unhealthy air days now
- 1 days/yr
- Unhealthy air days in 30 yrs
- 2 days/yr
Risk factors via First Street. Map © Google.
Why this score? — see what drove the B grade
The composite is a weighted blend of 9 inputs, each scored 0–100. Each bar is that input's sub-score; the figure is the points it added to the 100-point composite (weight × sub-score).
- Cash flow +28.4/30.0
- ARV discount +15.0/15.0
- DSCR +10.0/10.0
- 1% rule +7.1/10.0
- Rent growth +4.0/5.0
- Schools +4.0/10.0
- Livability +2.5/5.0
- Condition / age +2.5/5.0
- Appreciation +0.0/10.0
$160,000
🖨 Deal sheet (PDF) 📄 Offer letter ✓ Due diligence
Listing remarks MLS
Rare find in the country in Wanamaker Area! Gleaming hardwoods! Large eat-in kitchen! House must be connected to city sewer/sellers cannot pay for this & property will be sold in "as-is" condition. Quiet rural area w/ ez access to interstate! Lap siding & extra insulated w/ new vinyl tilt in windows. Approx 10 yrs ago. Old siding removed, re-insulated, and freshly painted! Window trim inside house is incomplete & will need addressed by buyers.
Key facts
- Two-level mini barn
- Newer a/c
- Newer roof on barn
Tags
Neighborhood map
What this means for you Summary
Snapshot
- This is a 3-bed/1.0-bath single-family listed at $160k.
Deal economics
- At list price, monthly cash flow is $518 ($6k/yr) — positive.
- The deal already cash-flows at list — no discount required.
- Meets the 1% rule at list price ($2k rent vs $160k).
- Cap rate 10.2% vs local median 4.4% in Indianapolis city (balance) — top-decile yield for the area; either an underpriced asset or a hidden risk that comps aren't pricing in. Stress-test before assuming the spread holds.
Location & tenants
- Location reads: area grade B — affects rentability + tenant quality, not the cash-flow math above.
- Franklin Township Community School Corporation (urban): math 42% / reading 47% proficiency, ranked #87 of 301 in IN (top 29%) — families likely to look elsewhere, expect single-tenant / working-renter base with shorter leases.
- Zoned schools: Franklin Central High School (math 41% / reading 69%, grade C, #77 of 369 statewide, top 21%, 3,319 students, 46% FRL) — zoned schools average 46% FRL vs 29% district-wide (17 pts higher); higher-poverty schools than district average — tighter screening recommended.
- Market conditions: Rents rising fast (+6.1%/yr); 337 active listings in the ZIP; 1 comparable units currently listed for rent nearby; solid renter incomes; 1,906 units permitted in Marion County in 2024 (621 in 5+ unit buildings).
Forward outlook
- Local home prices are declining (-3.0%/yr); year-one equity from $1k of loan paydown is wiped out by about $5k of value loss. Plan a longer hold.
- Marion County population projected at +18% by 2050 — long-run rental-demand tailwind backs the buy-and-hold thesis.
- At projected returns (-3.0% appreciation + 6.1% rent growth), your $45k cash investment doubles in ~7 years — after that, you're playing with house money.
Negotiation context
- Only 2 days on market — expect competitive offers; lowballing is unlikely to land.
- 3 sale attempts since 24y ago; this cycle's ask is 7% above the opening price — seller raised mid-cycle; expect resistance to lowballs.
- Current owner paid $70k; list at $160k implies a 128% gain — meaningful room to come down on a strong offer.
Risks & watch-outs
- Watch-outs: built in 1953 — expect roof / HVAC / electrical / plumbing capex.
Questions for the listing agent
- Built in 1953 — when were the roof, HVAC, electrical panel, plumbing, and water heater last replaced?
- Is there a deadline driving the sale (1031 exchange, divorce, estate, relocation)? That informs how much negotiation room exists.
- What's the average days-on-market for RENTAL listings here right now (not sales)? A rising rental-DOM trend means longer vacancies and softer asking-rent achievability than the comps imply.
- What's the recent tenant-quality profile in this submarket — average credit score on applications, eviction rate, late-payment / NSF rate, and stable-employment percentage? A property-management company in the area should have these aggregated.
- How much new for-sale + rental construction is in the pipeline within 1–3 miles? Heavy new supply typically softens prices + rents 12–24 months out; constrained supply supports both.
Investment metrics
- 1% rule
- 1.21% ✓
- Cap rate
- 10.18%
- Cash-on-cash
- 13.89%
- DSCR
- 1.62
- GRM
- 6.9
CMA / ARV
- ARV (on-the-fly)
- $199,800
- Comps found
- 4
Show comp detail 4 sales within ~0.75 mi
| Address | Dist | Beds/Ba | Sqft | Sold | Price | $/sf | Match |
|---|---|---|---|---|---|---|---|
| 5149 Hickory Rd | 0.00mi | 3/1.0 | 1,080 (0%) | 1mo | $182,000 | $169 | 100 |
| 9324 E Thompson Rd | 0.43mi | 3/1.0 | 1,160 (+7%) | 19mo | $215,000 | $185 | 52 |
| 10068 Southeastern Ave | 0.35mi | 3/2.0 | 1,152 (+7%) | 21mo | $239,000 | $207 | 51 |
| 4904 Betholm Dr | 0.45mi | 3/1.5 | 1,232 (+14%) | 9mo | $180,000 | $146 | 46 |
Match score weights: distance 35% · size 25% · config 20% · recency 20%. Top-matched comps best support the ARV.
Projected returns pro-forma
-3.0% appreciation · 6.11% rent growth · sell at horizon
- IRR
- 7.4%
- Equity multiple
- 1.30×
- Total profit
- $13,323
- Equity at exit
- $23,857
- IRR
- 19.1%
- Equity multiple
- 2.82×
- Total profit
- $81,375
- Equity at exit
- $13,834
Cash invested: $44,800 (down + closing). Projections, not guarantees.
Landlord ↔ Tenant lean methodology
- Overall (STATE)
- 90 Strongly Landlord-Friendly
- State Indiana
- 90 Strongly Landlord-Friendly · R+11
- County
- — inherits STATE
- City
- — inherits STATE
ZIP-level market 46239
- Home prices YoY
- -29.2%
- Rents YoY
- 6.1%
- Active inventory
- 337
- Price-to-rent
- 6.9×
Monthly cashflow live
- Estimated rent
- $1,939 medium interval (Pro) →
- Mortgage (P&I)
- −$839
- Tax from tax record
- −$108 /mo · $1,290/yr
- Insurance
- −$67
- HOA
- −$0
- Vacancy / Maint / Mgmt
- −$407
- Net cashflow
- $518
Break-even live
Sensitivity live
| Price | -10% $609 | -5% $564 | +0% $518 | +5% $473 | +10% $428 |
|---|---|---|---|---|---|
| Rent | -10% $365 | -5% $442 | +0% $518 | +5% $595 | +10% $672 |
| Rate | -1.0pp $599 | -0.5pp $559 | base $518 | +0.5pp $477 | +1.0pp $435 |
UW: 25.0% down · 7.5% · 30yr · 1.5% tax · 5.0% vac · 8.0% maint · 8.0% mgmt
Financing live
Cash to close
- Down payment
- $40,000
- Closing costs
- $4,800
- Reserves months
- —
- Total cash needed
- —
Loan-product check · same deal, 3 products live
Conventional
25% down · 7.5% · 30yr
- Down + closing
- —
- Monthly P&I
- —
- Monthly cashflow
- —
- DSCR
- —
- Eligible?
- —
Personal DTI + credit; lowest rate.
DSCR
20% down · 8.5% · 30yr
- Down + closing
- —
- Monthly P&I
- —
- Monthly cashflow
- —
- DSCR
- —
- Eligible?
- —
No personal income docs; deal must DSCR.
Hard money
10% down · 12.0% · 12mo
- Down + closing
- —
- Monthly P&I
- —
- Monthly cashflow
- —
- DSCR
- —
- Eligible?
- —
Short-term bridge; refi at stabilization.
Rent comps 1 comps
| Address | Beds | Baths | Sqft | Rent | $/sqft | DOM | Units | Dist |
|---|---|---|---|---|---|---|---|---|
| 4127 S Post Rd Indianapolis, IN | 3.0 | 2.0 | 1460 | $1,585 | $1.09 | 24d | 1 | 1.24mi |
Listing history 11 events
-
2026-04-26status Pending
-
2026-04-24price $160,000
-
2026-04-24$150,000 Active
-
2016-03-18soldstatus $70,200 Sold 469-char remark
Show marketing remark (469 chars)
Rare find in the country in Wanamaker Area! Gleaming hardwoods! Large eat-in kitchen! House must be connected to city sewer/sellers cannot pay for this & property will be sold in "as-is" condition. Quiet rural area w/ ez access to interstate! Lap siding & extra insulated w/ new vinyl tilt in windows. Approx 10 yrs ago. Old siding removed, re-insulated, and freshly painted! Window trim inside house is incomplete & will need addressed by buyers.
-
2016-01-22status Pending 469-char remark
Show marketing remark (469 chars)
Rare find in the country in Wanamaker Area! Gleaming hardwoods! Large eat-in kitchen! House must be connected to city sewer/sellers cannot pay for this & property will be sold in "as-is" condition. Quiet rural area w/ ez access to interstate! Lap siding & extra insulated w/ new vinyl tilt in windows. Approx 10 yrs ago. Old siding removed, re-insulated, and freshly painted! Window trim inside house is incomplete & will need addressed by buyers.
-
2015-10-09price $70,000 469-char remark
Show marketing remark (469 chars)
Rare find in the country in Wanamaker Area! Gleaming hardwoods! Large eat-in kitchen! House must be connected to city sewer/sellers cannot pay for this & property will be sold in "as-is" condition. Quiet rural area w/ ez access to interstate! Lap siding & extra insulated w/ new vinyl tilt in windows. Approx 10 yrs ago. Old siding removed, re-insulated, and freshly painted! Window trim inside house is incomplete & will need addressed by buyers.
-
2015-08-21price $75,000 469-char remark
Show marketing remark (469 chars)
Rare find in the country in Wanamaker Area! Gleaming hardwoods! Large eat-in kitchen! House must be connected to city sewer/sellers cannot pay for this & property will be sold in "as-is" condition. Quiet rural area w/ ez access to interstate! Lap siding & extra insulated w/ new vinyl tilt in windows. Approx 10 yrs ago. Old siding removed, re-insulated, and freshly painted! Window trim inside house is incomplete & will need addressed by buyers.
-
2015-05-13price $80,000 469-char remark
Show marketing remark (469 chars)
Rare find in the country in Wanamaker Area! Gleaming hardwoods! Large eat-in kitchen! House must be connected to city sewer/sellers cannot pay for this & property will be sold in "as-is" condition. Quiet rural area w/ ez access to interstate! Lap siding & extra insulated w/ new vinyl tilt in windows. Approx 10 yrs ago. Old siding removed, re-insulated, and freshly painted! Window trim inside house is incomplete & will need addressed by buyers.
-
2015-04-09$85,000 Active 469-char remark
Show marketing remark (469 chars)
Rare find in the country in Wanamaker Area! Gleaming hardwoods! Large eat-in kitchen! House must be connected to city sewer/sellers cannot pay for this & property will be sold in "as-is" condition. Quiet rural area w/ ez access to interstate! Lap siding & extra insulated w/ new vinyl tilt in windows. Approx 10 yrs ago. Old siding removed, re-insulated, and freshly painted! Window trim inside house is incomplete & will need addressed by buyers.
-
2002-08-10historical
-
2002-04-11$106,900
ⓘ Source: listings_history table (triggers on properties + properties_extension) + one-shot
backfill from property_details.listing_events for pre-trigger history.
Tax reassessment forecast IN · Partial reset (capped growth)
- Current annual tax
- $1,290 · $108/mo
- Projected year-2 tax
- $1,325 · $110/mo
- Expected delta
- +$35/yr (+$3/mo · 2.7%)
ⓘ Screening estimate from a state-policy table — verify with the county assessor before closing.
Climate risk First Street
- Flood 1/10 Low FEMA zone X (unshaded) · 0% chance over 30 yrs
- Wildfire 1/10 Low
- Heat 3/10 Moderate 7 d/yr ≥101°F today · 19 d/yr by 30 yrs out
- Wind 2/10 Low 100% chance of damaging wind over 30 yrs
- Air quality 2/10 Low 1 unhealthy d/yr today · 2 by 30 yrs out
Nearby sold comps map
Loading sold comps map…
Walkable amenities ~0.75 mi
Loading nearby amenities…
Taxation est. · year 1
- Rental income
- $23,267
- − Mortgage interest
- −$8,962
- − Property taxes
- −$1,290
- − Insurance
- −$800
- − Repairs & maintenance
- −$1,861
- − Management
- −$1,861
- − Depreciation
- −$4,655
- Taxable income
- $3,837
- Est. tax owed @ 24.0%
- −$921
- After-tax cash flow
- $5,301/yr
For passive investors: Depreciation is non-cash, so a rental often shows a tax loss while cash-flowing — sheltering income. Rental losses are passive: they offset passive income freely, and up to $25,000/yr can offset ordinary (W-2) income if you actively participate and your MAGI is under $100k (phasing out to $0 by $150k); unused losses carry forward. On sale, claimed depreciation is recaptured at up to 25%, and gains may owe capital-gains tax (a 1031 exchange can defer both). Figures are a year-1 estimate at your 24.0% rate — not tax advice; consult a CPA.
Schools (NCES district)
- District
- Franklin Township Community School Corporation
- NCES district ID
- 1803750
- Math proficiency
- 42% ▼ -12.00%
- Reading proficiency
- 47% ▼ -6.00%
- Median HH income
- $67,825
- Composite
- 39.91/100
- National rank
- #3852
- State rank
- #87 of 301 in IN
Livability — Indianapolis city (balance)
No livability data for this city. (Only ~50 U.S. cities are tracked.)
Census & demographics
- Census place
- Indianapolis city (balance), IN
- County
- Marion County · 998,460 people
- City population
- 881,119
- Metro
- Indianapolis-Carmel-Anderson, IN
- Population (ZIP)
- 33,931
- Household income
- $100,331
- Rent vs Own
- Severe rent burden
- 567.0
Population outlook (Marion County) Hauer SSP2
- Today (2025)
- 1,025,572 people
- By 2030
- 1,065,727 · +3.9%
- By 2040
- 1,141,577 · +11.3%
- By 2050
- 1,208,920 · +17.9%
- By 2075
- 1,367,288 · +33.3%
- By 2100
- 1,438,201 · +40.2%
Race, ethnicity, and origin ACS 2023
- Neighborhood character
- Diverse neighborhood (Simpson 0.61)
- Race & ethnicity
- White 57% Black 24% Hispanic / Latino 9% Two or more races 9% Asian 4%
- Hispanic origin (detail)
- Mexican 6%
- Common ancestry
- Lithuanian 2% Slovak 2% Romanian 1%
- Foreign-born
- 7% · Canada, Philippines, China
- Languages at home
- 89% English-only · Spanish 6% Other Indo-European 2% Chinese 1%
Political lean MEDSL · Marion
- 2024 margin
- Strong D (+27.7) · D 63.0% · R 35.3% · Other 1.7%
- 2008→2024 swing
- -0.7pp no change · 2008: 28.4pp · 2024: 27.7pp
- All cycles
- 2024: D+27.7 2020: D+29.1 2016: D+22.8 2012: D+22.2 2008: D+28.4
Not yet ingested
- Civics
- —
Market trends
- HPI YoY
- ▼ -93.15%
- Current HPI
- 226.1965
- Rent YoY
- ▲ 6.11%
- Metro
- Indianapolis-Carmel-Anderson, IN
- State GDP YoY
- ▲ 2.90%
- F500 in state
- 18
Industry mix (Fortune 500 HQ in IN)
| Industry | F500 HQs | Revenue |
|---|---|---|
| Industrial Machinery | 2 | $37B |
|
||
| Healthcare | 1 | $177B |
|
||
| Pharmaceuticals | 1 | $45B |
|
||
| Metals / Steel | 1 | $18B |
|
||
| Agriculture | 1 | $17B |
|
||
| Packaging | 1 | $12B |
|
||
Price history
+49.7% since first listed11 events — show timeline
- 2026-04-26 Pending — MIBOR as Distributed by MLS Grid
- 2026-04-24 Price Changed $160,000 MIBOR as Distributed by MLS Grid
- 2026-04-24 Listed $150,000 MIBOR as Distributed by MLS Grid
- 2016-03-18 Sold (MLS) $70,200 MIBOR as Distributed by MLS Grid
- 2016-01-22 Pending — MIBOR as Distributed by MLS Grid
- 2015-10-09 Price Changed $70,000 MIBOR as Distributed by MLS Grid
- 2015-08-21 Price Changed $75,000 MIBOR as Distributed by MLS Grid
- 2015-05-13 Price Changed $80,000 MIBOR as Distributed by MLS Grid
- 2015-04-09 Listed $85,000 MIBOR as Distributed by MLS Grid
- 2002-08-10 Listing Removed — MIBOR as Distributed by MLS Grid
- 2002-04-11 Listed $106,900 MIBOR as Distributed by MLS Grid
Property tax history
+4.5%/yrLatest (2025): $1,290 · -9.0% YoY. Source: county tax records.
Cash-flow waterfall
monthlySold comps — $/sqft
last 12 mo · ≤1 miLoading sold comps…