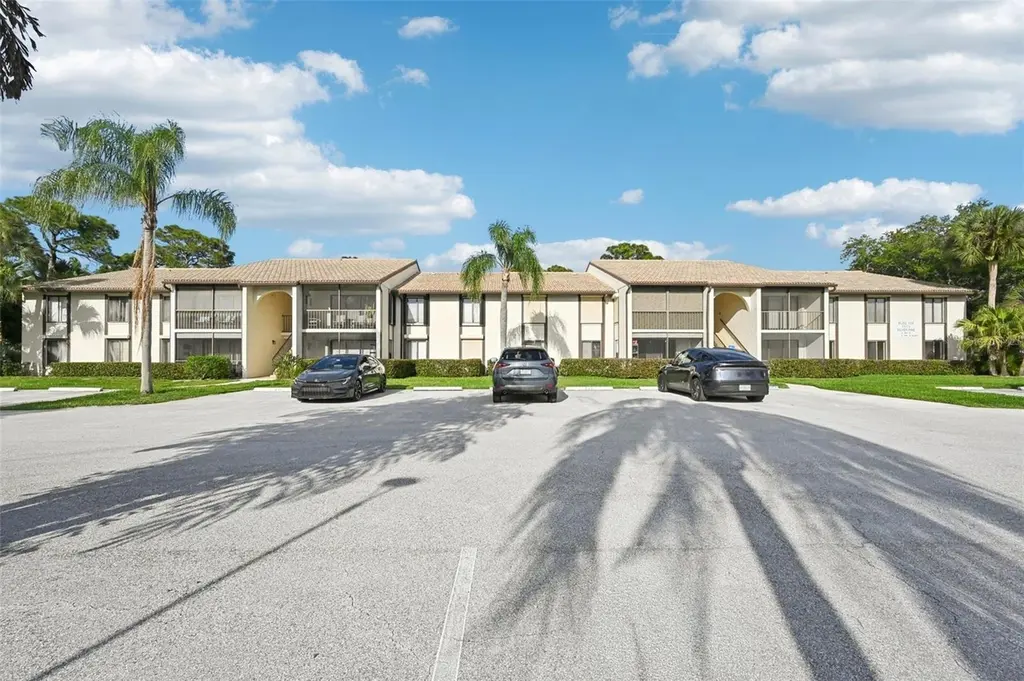
1575 SW Silver Pine Way Unit F2 · Palm City, FL
Flood risk 3/10 · Minor
- FEMA flood zone
- X (unshaded)
- Chance of flooding over 30 yrs
- 0.12%
- Est. flood insurance / yr
- $507 – $1,088
Fire risk 1/10 · Minimal
- Est. fire insurance / yr
- $947 – $1,759
Heat risk 10/10 · Severe
- Hot days now (above 106°F)
- 7 days/yr
- Hot days in 30 yrs
- 24 days/yr
Wind risk 10/10 · Severe
- Chance of severe wind over 30 yrs
- 99.0%
Air-quality risk 2/10 · Minimal
- Unhealthy air days now
- 1 days/yr
- Unhealthy air days in 30 yrs
- 1 days/yr
Risk factors via First Street. Map © Google.
Why this score? — see what drove the D grade
The composite is a weighted blend of 9 inputs, each scored 0–100. Each bar is that input's sub-score; the figure is the points it added to the 100-point composite (weight × sub-score).
- ARV discount +12.7/15.0
- Cash flow +8.1/30.0
- 1% rule +6.1/10.0
- Schools +4.5/10.0
- Livability +4.0/5.0
- Rent growth +2.5/5.0
- Condition / age +2.5/5.0
- DSCR +2.2/10.0
- Appreciation +0.0/10.0
$195,000
🖨 Deal sheet (PDF) 📄 Offer letter ✓ Due diligence
Listing remarks MLS
Spacious 2-bedroom condo with a great layout located in a desirable gated community. While the interior has a more classic feel, the functional floor plan offers comfortable living with plenty of potential to make it your own. Enjoy the benefits of this great community, including pool, pickleball, community center and so much more, along with convenient access to nearby shopping, dining, and major roadways. This is a great opportunity for someone looking for space, value, and location.
Key facts
- Gated community
- Community center
- Convenient access
Tags
Neighborhood map
What this means for you Summary
Snapshot
- This is a 2-bed/2.0-bath condo listed at $195k.
Deal economics
- At list price, monthly cash flow is $-187 ($-2k/yr) — negative.
- To cash-flow at today's rent, offer at most $162k (16.9% below list).
- Meets the 1% rule at list price ($2k rent vs $195k).
- Recommended offer: $162k (16.9% below list) — sets the bar for cash-flow.
- Cap rate 5.1% vs local median 2.6% in Palm City — top-decile yield for the area; either an underpriced asset or a hidden risk that comps aren't pricing in. Stress-test before assuming the spread holds.
Location & tenants
- Location reads 79/100 on livability (#140 in FL, #2,113 nationally) — a middle-class / working-renter tenant base. Strengths: crime A+, employment A+, housing A+; Watch: amenities F, commute F, cost of living F.
- Martin (suburban): math 52% / reading 53% proficiency, ranked #24 of 73 in FL (top 33%) — acceptable for families but not a draw, mixed tenant base, ~2y average lease.
- Zoned schools: Bessey Creek Elementary School (math 78% / reading 78%, grade A, #149 of 2,144 statewide, top 8%, 562 students, 28% FRL); Hidden Oaks Middle School (math 82% / reading 71%, grade A, #33 of 571 statewide, top 6%, 940 students, 23% FRL); Martin County High School (math 45% / reading 54%, grade D, #179 of 667 statewide, top 29%, 2,273 students, 42% FRL).
- Zoned-school proficiency averages 68% at this address vs 52% district-wide (+16 pts) — the actual schools serving this property are materially stronger than the Martin average implies; a family-tenant draw the district grade alone would hide.
- Market conditions: Rents soft (-0.1%/yr); 452 active listings in the ZIP; 22 comparable units currently listed for rent nearby; rentals at typical pace (median 26d on market — plan ~3-4 weeks tenant-placement turnaround); high-income renter base; 737 units permitted in Martin County in 2024 (167 in 5+ unit buildings).
Forward outlook
- Local home prices are declining (-3.0%/yr); year-one equity from $1k of loan paydown is wiped out by about $6k of value loss. Plan a longer hold.
- Martin County population projected at +19% by 2050 — long-run rental-demand tailwind backs the buy-and-hold thesis.
Negotiation context
- It's been on market 65 days — a 6% lower offer ($183k) is reasonable based on typical stale-listing flexibility.
- Current owner paid $62k; list at $195k implies a 215% gain — meaningful room to come down on a strong offer.
Risks & watch-outs
- Watch-outs: HOA is 27% of rent.
- Climate carrying-cost: severe wind risk, 99% chance of damaging wind over 30y; extreme-heat days projected 7→24/yr by 2055 (HVAC capex compounding) — expect insurance premiums to compound above CPI over the hold.
Questions for the listing agent
- What do current leases actually rent for vs. the listed asking? Can we see a recent rent roll and the last 12 months of T-12 income?
- It's been on market 65 days. Have you received any prior offers? Is the seller open to a 17% concession, seller financing, or rate buy-down credit?
- What does the HOA fee cover, when was the last increase, and are there any pending special assessments or reserve-fund shortfalls?
- Any open or pending special assessments — roof, HVAC, plumbing, elevator, façade? What's the per-unit balance and payoff schedule, and is the seller paying it off at close or rolling it to the buyer?
- Why hasn't it sold? Are there any deal-killer items the seller is aware of (foundation, flood, title, zoning, code violations)?
- Is there a deadline driving the sale (1031 exchange, divorce, estate, relocation)? That informs how much negotiation room exists.
- Schools are A-rated — typically a magnet for longer-tenancy family renters. What's the average tenant stay here, and is there a school-zone premium baked into asking?
- The area grade is low — what's the realistic commute time and amenity access for the typical tenant pool here? Any planned neighborhood developments (good or bad) we should know about?
- What's the average days-on-market for RENTAL listings here right now (not sales)? A rising rental-DOM trend means longer vacancies and softer asking-rent achievability than the comps imply.
- What's the recent tenant-quality profile in this submarket — average credit score on applications, eviction rate, late-payment / NSF rate, and stable-employment percentage? A property-management company in the area should have these aggregated.
- How much new apartment / multifamily construction is in the pipeline within 1–3 miles? Heavy new supply (>2% of stock underway) typically softens rents 12–24 months out; light construction supports rent growth.
Investment metrics
- 1% rule
- 1.11% ✓
- Cap rate
- 5.15%
- Cash-on-cash
- -4.10%
- DSCR
- 0.82
- GRM
- 7.5
CMA / ARV
- ARV (median comp)
- $220,404
- List price
- $195,000
- Delta
- -11.53%
- Verdict
- UNDERPRICED
- Comps
- 20 within 1.0 mi
Projected returns pro-forma
-3.0% appreciation · 0.0% rent growth · sell at horizon
- IRR
- -28.0%
- Equity multiple
- 0.09×
- Total profit
- $-49,464
- Equity at exit
- $29,075
- IRR
- -56.1%
- Equity multiple
- -0.49×
- Total profit
- $-81,430
- Equity at exit
- $16,860
Cash invested: $54,600 (down + closing). Projections, not guarantees.
Landlord ↔ Tenant lean methodology
- Overall (STATE)
- 87 Strongly Landlord-Friendly
- State Florida
- 87 Strongly Landlord-Friendly · R+3
- County
- — inherits STATE
- City
- — inherits STATE
ZIP-level market 34990
- Home prices YoY
- -29.7%
- Rents YoY
- -0.1%
- Active inventory
- 452
- Price-to-rent
- 7.5×
Monthly cashflow live
- Estimated rent
- $2,170 high interval (Pro) →
- Mortgage (P&I)
- −$1,023
- Tax from tax record
- −$215 /mo · $2,579/yr
- Insurance
- −$81
- HOA
- −$582
- Vacancy / Maint / Mgmt
- −$456
- Net cashflow
- $-187
Break-even live
Sensitivity live
| Price | -10% $-76 | -5% $-131 | +0% $-187 | +5% $-242 | +10% $-297 |
|---|---|---|---|---|---|
| Rent | -10% $-358 | -5% $-272 | +0% $-187 | +5% $-101 | +10% $-15 |
| Rate | -1.0pp $-88 | -0.5pp $-137 | base $-187 | +0.5pp $-237 | +1.0pp $-288 |
UW: 25.0% down · 7.5% · 30yr · 1.5% tax · 5.0% vac · 8.0% maint · 8.0% mgmt
Financing live
Cash to close
- Down payment
- $48,750
- Closing costs
- $5,850
- Reserves months
- —
- Total cash needed
- —
Loan-product check · same deal, 3 products live
Conventional
25% down · 7.5% · 30yr
- Down + closing
- —
- Monthly P&I
- —
- Monthly cashflow
- —
- DSCR
- —
- Eligible?
- —
Personal DTI + credit; lowest rate.
DSCR
20% down · 8.5% · 30yr
- Down + closing
- —
- Monthly P&I
- —
- Monthly cashflow
- —
- DSCR
- —
- Eligible?
- —
No personal income docs; deal must DSCR.
Hard money
10% down · 12.0% · 12mo
- Down + closing
- —
- Monthly P&I
- —
- Monthly cashflow
- —
- DSCR
- —
- Eligible?
- —
Short-term bridge; refi at stabilization.
Rent comps 22 comps
| Address | Beds | Baths | Sqft | Rent | $/sqft | DOM | Units | Dist |
|---|---|---|---|---|---|---|---|---|
| 1544 SW Silver Pine Way Unit F-104 Palm City, FL | 2.0 | 2.0 | 1170 | $2,500 | $2.14 | 16d | 1 | 0.03mi |
| 1605 SW Silver Pine Way Unit F2 Palm City, FL | 2.0 | 2.0 | 1111 | $2,000 | $1.80 | 25d | 1 | 0.06mi |
| 1485 SW Silver Pine Way Unit 107 B-2 Palm City, FL | 1.0 | 1.0 | 830 | $1,650 | $1.99 | 25d | 1 | 0.10mi |
| 2703 SW Matheson Ave Unit 116- B1 Palm City, FL | 1.0 | 1.0 | 842 | $1,750 | $2.08 | 16d | 1 | 0.21mi |
| 2703 SW Matheson Ave Unit 116-G2 Palm City, FL | 1.0 | 1.0 | 842 | $1,400 | $1.66 | 25d | 1 | 0.21mi |
| 2868 SW Shinnecock Hills Ct Palm City, FL | 3.0 | 2.0 | 1451 | $3,000 | $2.07 | 25d | 1 | 0.56mi |
| 3375 SW Mapp Rd Unit 204 Palm City, FL | 3.0 | 2.0 | 1067 | $2,300 | $2.16 | 25d | 1 | 0.57mi |
| 2819 SW Cornell Ave Palm City, FL | 2.0 | 1.5 | 1060 | $2,150 | $2.03 | 23d | 1 | 0.66mi |
| 3405 SW Feroe Ave Palm City, FL | 2.0 | 2.0 | 1275 | $2,800 | $2.20 | 25d | 1 | 0.67mi |
| 1634 SW Crossing Cir Palm City, FL | 2.0 | 1.5 | 1258 | $2,200 | $1.75 | 25d | 1 | 0.97mi |
| 664 SW 35th St Apt 3 Palm City, FL | 2.0 | 1.5 | 900 | $1,775 | $1.97 | 16d | 1 | 1.01mi |
| 664 SW 35th St Unit 6 Palm City, FL | 2.0 | 1.5 | 900 | $1,850 | $2.06 | 16d | 1 | 1.01mi |
| 544 SW 35th St Palm City, FL | 2.0 | 1.0 | 850 | $1,850 | $2.18 | 25d | 1 | 1.09mi |
| 1950 SW Palm City Rd Unit 4-4205 Stuart, FL | 2.0 | 2.0 | 938 | $2,400 | $2.56 | 16d | 1 | 1.14mi |
| 1950 SW Palm City Rd Stuart, FL | 2.0 | 2.0 | 1031 | $3,150 | $3.05 | 25d | 3 | 1.14mi |
| 1868 SW Palm City Rd Apt 202 Stuart, FL | 2.0 | 2.0 | 1191 | $2,900 | $2.43 | 25d | 1 | 1.14mi |
| 3662 SW Sunset Trace Cir Palm City, FL | 3.0 | 2.0 | 1296 | $2,500 | $1.93 | 16d | 1 | 1.23mi |
| 2600 S Kanner Hwy Stuart, FL | 1.0–2.0 | 1.5–2.0 | 890 | $1,950 | $2.19 | 16d | 3 | 1.32mi |
| 3579 SW Sunset Trace Cir Palm City, FL | 2.0 | 2.5 | 1236 | $2,300 | $1.86 | 25d | 1 | 1.34mi |
| 3599 SW Sunset Trace Cir Palm City, FL | 2.0 | 2.5 | 1236 | $2,200 | $1.78 | 23d | 1 | 1.37mi |
| 1871 SW Palm City Rd Unit G401 Stuart, FL | 3.0 | 2.0 | 1289 | $2,200 | $1.71 | 25d | 1 | 1.42mi |
| 1900 S Kanner Hwy Unit 2-203 Stuart, FL | 2.0 | 2.0 | 1086 | $1,800 | $1.66 | 16d | 1 | 1.46mi |
HOA detail condo
- Monthly dues
- $582 · $6,984/yr
- Likely covers
- poolsecurity
- Assessments
- None detected in remarks — confirm with the listing agent.
Listing history 19 events
-
2026-06-21days on market $195,000 Active 65 DOM
-
2026-06-18days on market $195,000 Active 62 DOM
-
2026-06-17days on market $195,000 Active 61 DOM
-
2026-06-16days on market $195,000 Active 60 DOM
-
2026-06-15days on market $195,000 Active 59 DOM
-
2026-06-14days on market $195,000 Active 57 DOM
-
2026-06-13days on market $195,000 Active 56 DOM
-
2026-06-10days on market $195,000 Active 54 DOM
-
2026-06-09days on market $195,000 Active 53 DOM
-
2026-06-08days on market $195,000 Active 52 DOM
-
2026-06-07pricedays on market $195,000 Active 51 DOM
-
2026-06-03days on market $206,000 Active 47 DOM
-
2026-06-02days on market $206,000 Active 46 DOM
-
2026-06-01days on market $206,000 Active 45 DOM
-
2026-05-31days on market $206,000 Active 44 DOM
-
2026-05-31days on market $206,000 Active 43 DOM
-
2026-05-04price $214,000 490-char remark
Show marketing remark (490 chars)
Spacious 2-bedroom condo with a great layout located in a desirable gated community. While the interior has a more classic feel, the functional floor plan offers comfortable living with plenty of potential to make it your own. Enjoy the benefits of this great community, including pool, pickleball, community center and so much more, along with convenient access to nearby shopping, dining, and major roadways. This is a great opportunity for someone looking for space, value, and location.
-
2026-04-17$225,000 Active 490-char remark
Show marketing remark (490 chars)
Spacious 2-bedroom condo with a great layout located in a desirable gated community. While the interior has a more classic feel, the functional floor plan offers comfortable living with plenty of potential to make it your own. Enjoy the benefits of this great community, including pool, pickleball, community center and so much more, along with convenient access to nearby shopping, dining, and major roadways. This is a great opportunity for someone looking for space, value, and location.
-
1987-11-20soldstatus $62,000
ⓘ Source: listings_history table (triggers on properties + properties_extension) + one-shot
backfill from property_details.listing_events for pre-trigger history.
Tax reassessment forecast FL · Resets to sale price
- Current annual tax
- $2,579 · $215/mo
- Projected year-2 tax
- $2,579 · $215/mo
- Expected delta
- $0/yr ($0/mo · 0.0%)
ⓘ Screening estimate from a state-policy table — verify with the county assessor before closing.
Climate risk First Street
- Flood 3/10 Moderate FEMA zone X (unshaded) · 12% chance over 30 yrs
- Wildfire 1/10 Low
- Heat 10/10 Extreme 7 d/yr ≥106°F today · 24 d/yr by 30 yrs out
- Wind 10/10 Extreme 99% chance of damaging wind over 30 yrs
- Air quality 2/10 Low 1 unhealthy d/yr today · 1 by 30 yrs out
Nearby sold comps map
Loading sold comps map…
Walkable amenities ~0.75 mi
Loading nearby amenities…
Taxation est. · year 1
- Rental income
- $26,040
- − Mortgage interest
- −$10,923
- − Property taxes
- −$2,579
- − Insurance
- −$975
- − Repairs & maintenance
- −$2,083
- − Management
- −$2,083
- − HOA
- −$6,984
- − Depreciation
- −$5,673
- Taxable loss
- −$5,261
- Est. tax savings @ 24.0%
- +$1,263
- After-tax cash flow
- $-976/yr
For passive investors: Depreciation is non-cash, so a rental often shows a tax loss while cash-flowing — sheltering income. Rental losses are passive: they offset passive income freely, and up to $25,000/yr can offset ordinary (W-2) income if you actively participate and your MAGI is under $100k (phasing out to $0 by $150k); unused losses carry forward. On sale, claimed depreciation is recaptured at up to 25%, and gains may owe capital-gains tax (a 1031 exchange can defer both). Figures are a year-1 estimate at your 24.0% rate — not tax advice; consult a CPA.
Schools (NCES district)
- District
- Martin
- NCES district ID
- 1201290
- Math proficiency
- 52% ▼ -14.00%
- Reading proficiency
- 53% ▼ -4.00%
- Median HH income
- $52,482
- Composite
- 45.1/100
- National rank
- #2690
- State rank
- #24 of 73 in FL
Livability — Palm City
- Score
- 79/100
- State rank
- #140
- US rank
- #2113
Category grades
Schools grade is shown separately in the Schools card above.
Census & demographics
- Census place
- Palm City, FL
- County
- Martin County · 165,223 people
- City population
- 30,592
- Metro
- Port St. Lucie, FL
- Population (ZIP)
- 30,592
- Household income
- $129,560
- Rent vs Own
- Severe rent burden
- 249.0
Population outlook (Martin County) Hauer SSP2
- Today (2025)
- 172,383 people
- By 2030
- 180,192 · +4.5%
- By 2040
- 194,114 · +12.6%
- By 2050
- 204,992 · +18.9%
- By 2075
- 229,641 · +33.2%
- By 2100
- 232,146 · +34.7%
Race, ethnicity, and origin ACS 2023
- Neighborhood character
- Predominantly White (83%)
- Race & ethnicity
- White 83% Two or more races 10% Hispanic / Latino 10% Asian 2%
- Hispanic origin (detail)
- Cuban 3%
- Common ancestry
- Romanian 4% Italian 3% Scotch-Irish 2%
- Foreign-born
- 9% · Canada, China, Jamaica
- Languages at home
- 90% English-only · Spanish 6% Russian/Polish/Slavic 1% Tagalog/Filipino 1%
Political lean MEDSL · Martin
- 2024 margin
- Solid R (+31.1) · D 34.1% · R 65.2%
- 2008→2024 swing
- -17.5pp toward R · 2008: -13.6pp · 2024: -31.1pp
- All cycles
- 2024: R+31.1 2020: R+24.6 2016: R+26.9 2012: R+22.9 2008: R+13.6
Not yet ingested
- Civics
- —
Market trends
- HPI YoY
- ▼ -138.81%
- Current HPI
- 328.9662
- Rent YoY
- ▼ -0.09%
- Metro
- Port St. Lucie, FL
- State GDP YoY
- ▲ 3.28%
- F500 in state
- 36
Industry mix (Fortune 500 HQ in FL)
| Industry | F500 HQs | Revenue |
|---|---|---|
| Industrial Technology | 2 | $29B |
|
||
| Insurance | 2 | $17B |
|
||
| Retail | 1 | $60B |
|
||
| Technology Distribution | 1 | $58B |
|
||
| Homebuilding | 1 | $35B |
|
||
| Technology Manufacturing | 1 | $35B |
|
||
Price history
+245.2% since first listed3 events — show timeline
- 2026-05-04 Price Changed $214,000 Stellar MLS as Distributed by MLS Grid
- 2026-04-17 Listed $225,000 Stellar MLS as Distributed by MLS Grid
- 1987-11-20 Sold (Public Records) $62,000 Public Records
Property tax history
+9.6%/yrLatest (2025): $2,579 · -0.1% YoY. Source: county tax records.
Cash-flow waterfall
monthlySold comps — $/sqft
last 12 mo · ≤1 miLoading sold comps…