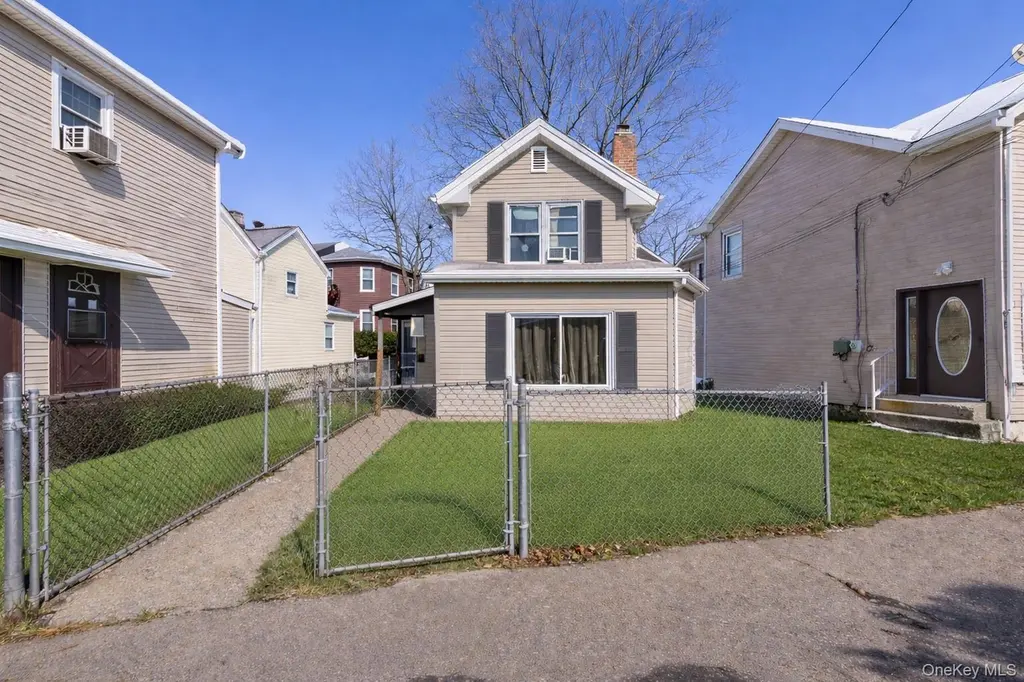
5 Pratt St · Haverstraw, NY
Flood risk 1/10 · Minimal
- FEMA flood zone
- X (unshaded)
- Chance of flooding over 30 yrs
- 0.0%
- Est. flood insurance / yr
- $473 – $860
Fire risk 4/10 · Minor
- Est. fire insurance / yr
- $691 – $1,283
Heat risk 6/10 · Moderate
- Hot days now (above 100°F)
- 7 days/yr
- Hot days in 30 yrs
- 16 days/yr
Wind risk 4/10 · Minor
- Chance of severe wind over 30 yrs
- 21.0%
Air-quality risk 3/10 · Minor
- Unhealthy air days now
- 2 days/yr
- Unhealthy air days in 30 yrs
- 3 days/yr
Risk factors via First Street. Map © Google.
Why this score? — see what drove the C- grade
The composite is a weighted blend of 9 inputs, each scored 0–100. Each bar is that input's sub-score; the figure is the points it added to the 100-point composite (weight × sub-score).
- ARV discount +15.0/15.0
- Cash flow +13.5/30.0
- Rent growth +4.4/5.0
- DSCR +4.1/10.0
- Schools +4.1/10.0
- 1% rule +3.8/10.0
- Livability +2.9/5.0
- Condition / age +2.5/5.0
- Appreciation +0.0/10.0
$349,000
🖨 Deal sheet 📄 Offer letter ✓ Due diligence
Listing remarks MLS
Why rent when you can own?! no need to look further, move into your very own beautiful cozy nest or rent it out for income/investment. Perfect starter home in desirable Village of Haverstraw, features 2 bedrooms, full bath, eat-in kitchen with dinette/living room. Nice size patio to hang out out and enjoy your privacy. House was updated in 2010 and has a new hot water tank.
Key facts
- 1,307 sq ft lot
- Built 1890
- Listed 45 days
Property features AI
Exterior
- Parking: No designated parking or carport
- Utilities: Electric service by Orange & Rockland; Public sewer; Public trash collection
- Home design: Single family residence; Two levels
- Construction: Frame construction with shingle siding
- Exterior features: Level lot; Near public transit; Near schools; Near shops; Fenced yard; Not waterfront
Interior
- Kitchen: Eat-in kitchen
- Bedrooms: 2-story home with rooms across two levels
- Flooring: Hardwood floors
- Bathrooms: 1 full bathroom
- Heating & cooling: Forced air heating; Natural gas heating; No central cooling
- Interior features: First-floor bedroom; First-floor full bathroom; Eat-in kitchen; Patio
- Laundry & utility: Unfinished basement (utility/storage space)
Neighborhood map
What this means for you Summary
Snapshot
- This is a 2-bed/1.0-bath single-family listed at $349k.
Deal economics
- At list price, monthly cash flow is $10 ($122/yr) — positive.
- The deal already cash-flows at list — no discount required.
- To meet the 1% rule (rent ≥ 1% of price), the offer needs to be $307k (12.2% below list).
- Recommended offer: $307k (12.2% below list) — sets the bar for 1% rule.
- Cap rate 6.3% vs local median 5.2% in Haverstraw — meaningfully above typical; check what's discounted (condition, days-on-market, listing class) to confirm the premium yield is real.
Location & tenants
- Location reads 57/100 on livability (#1,087 in NY) — a working-class tenant base; expect higher turnover. Strengths: housing A+, employment B+; Watch: crime D+, amenities F, commute F.
- Haverstraw-Stony Point CSD (North Rockland) (suburban): math 41% / reading 47% proficiency, ranked #427 of 590 in NY (top 72%) — families likely to look elsewhere, expect single-tenant / working-renter base with shorter leases.
- Zoned schools: West Haverstraw Elementary School (math 22% / reading 37%, grade F, #1,729 of 2,108 statewide, top 84%, 742 students, 22% FRL); Fieldstone Middle School (math 18% / reading 46%, grade F, #511 of 729 statewide, top 71%, 1,247 students, 0% FRL); North Rockland High School (math 86% / reading 67%, grade A-, #612 of 1,100 statewide, top 56%, 2,687 students, 0% FRL) — zoned schools average 7% FRL vs 40% district-wide (33 pts lower); this property's tenant base skews higher-income than the district average.
- Market conditions: Rents rising fast (+7.6%/yr); 50 active listings in the ZIP; 20 comparable units currently listed for rent nearby; rentals leasing fast (median 10d on market — plan ~1-2 weeks tenant-placement turnaround); solid renter incomes; 429 units permitted in Rockland County in 2024 (231 in 5+ unit buildings).
- At $3,066/mo this rent would consume 49% of the median local household income ($75k/yr) (locally 791% of renters already pay >50% of income on rent) — very limited rent-growth headroom before tenants either downsize or default.
Forward outlook
- Local home prices are declining (-3.0%/yr); year-one equity from $2k of loan paydown is wiped out by about $10k of value loss. Plan a longer hold.
- Rockland County population projected at +7% by 2050 — modest demand growth; plan on rents tracking national, not racing it.
Negotiation context
- It's been on market 45 days — a 3% lower offer ($339k) is reasonable based on typical stale-listing flexibility.
- 6 sale attempts since 23y ago with the ask held roughly flat each time — persistent listings suggest the price (not the market) is what's stuck; bring a comps-based counter.
- Current owner paid $226k; list at $349k implies a 54% gain — meaningful room to come down on a strong offer.
Risks & watch-outs
- Watch-outs: built in 1890 — expect roof / HVAC / electrical / plumbing capex.
- Climate carrying-cost: extreme-heat days projected 7→16/yr by 2055 (HVAC capex compounding) — expect insurance premiums to compound above CPI over the hold.
Questions for the listing agent
- It's been on market 45 days. Have you received any prior offers? Is the seller open to a 12% concession, seller financing, or rate buy-down credit?
- Built in 1890 — when were the roof, HVAC, electrical panel, plumbing, and water heater last replaced?
- Is there a deadline driving the sale (1031 exchange, divorce, estate, relocation)? That informs how much negotiation room exists.
- Schools are F-rated, which usually means shorter tenancies and higher turnover. Who's the typical renter profile here, and what's been the actual vacancy rate?
- Crime grade is D in this area — have there been break-ins, vandalism, or insurance claims at this property in the last 3 years? What carrier currently insures it and at what premium?
- What's the average days-on-market for RENTAL listings here right now (not sales)? A rising rental-DOM trend means longer vacancies and softer asking-rent achievability than the comps imply.
- What's the recent tenant-quality profile in this submarket — average credit score on applications, eviction rate, late-payment / NSF rate, and stable-employment percentage? A property-management company in the area should have these aggregated.
- How much new for-sale + rental construction is in the pipeline within 1–3 miles? Heavy new supply typically softens prices + rents 12–24 months out; constrained supply supports both.
Investment metrics
- 1% rule
- 0.88% ✗
- Cap rate
- 6.33%
- Cash-on-cash
- 0.13%
- DSCR
- 1.01
- GRM
- 9.5
CMA / ARV
- ARV (median comp)
- $499,848
- List price
- $349,000
- Delta
- -30.18%
- Verdict
- UNDERPRICED
- Comps
- 20 within 1.0 mi
Show comp detail 12 sales within ~0.75 mi
| Address | Dist | Beds/Ba | Sqft | Sold | Price | $/sf | Match |
|---|---|---|---|---|---|---|---|
| 24 Mackey Ct | 0.27mi | 3/1.0 (+1) | 1,008 (-1%) | 8mo | $459,999 | $456 | 74 |
| 19 Tanneyanns Ln | 0.44mi | 3/2.0 (+1) | 1,020 (0%) | 4mo | $485,000 | $475 | 68 |
| 5 Peck St | 0.51mi | 3/1.0 (+1) | 1,038 (+2%) | 5mo | $485,000 | $467 | 64 |
| 86 Gurnee Ave | 0.34mi | 3/1.0 (+1) | 1,040 (+2%) | 18mo | $469,000 | $451 | 61 |
| 5 Simenovsky Dr | 0.28mi | 3/2.0 (+1) | 1,062 (+4%) | 14mo | $410,000 | $386 | 59 |
| 16 Peck St | 0.44mi | 3/1.0 (+1) | 1,052 (+3%) | 16mo | $429,000 | $408 | 56 |
| 2 Hoover Ave | 0.49mi | 2/2.0 | 980 (-4%) | 19mo | $410,000 | $418 | 51 |
| 147 E Railroad Ave | 0.56mi | 2/2.0 | 1,056 (+4%) | 18mo | $355,000 | $336 | 49 |
| 31 N Wayne Ave | 0.72mi | 3/2.0 (+1) | 1,080 (+6%) | 4mo | $410,000 | $380 | 44 |
| 22 Tanneyanns Ln | 0.42mi | 3/2.0 (+1) | 1,152 (+13%) | 13mo | $500,000 | $434 | 39 |
| 63 Clove Ave | 0.54mi | 3/1.5 (+1) | 1,168 (+14%) | 12mo | $466,000 | $399 | 34 |
| 158 Hudson Ave | 0.73mi | 3/1.0 (+1) | 1,144 (+12%) | 18mo | $395,000 | $345 | 26 |
Match score weights: distance 35% · size 25% · config 20% · recency 20%. Top-matched comps best support the ARV.
Projected returns pro-forma
-3.0% appreciation · 7.62% rent growth · sell at horizon
- IRR
- -11.0%
- Equity multiple
- 0.58×
- Total profit
- $-40,942
- Equity at exit
- $52,037
- IRR
- 3.8%
- Equity multiple
- 1.33×
- Total profit
- $32,715
- Equity at exit
- $30,175
Cash invested: $97,720 (down + closing). Projections, not guarantees.
Landlord ↔ Tenant lean methodology
- Overall (STATE)
- 15 Strongly Tenant-Friendly
- State New York
- 15 Strongly Tenant-Friendly · D+10
- County
- — inherits STATE
- City
- — inherits STATE
ZIP-level market 10927
- Home prices YoY
- -23.6%
- Rents YoY
- 7.6%
- Active inventory
- 50
- Price-to-rent
- 9.5×
Monthly cashflow live
- Estimated rent
- $3,066 high interval (Pro) →
- Mortgage (P&I)
- −$1,830
- Tax est. 1.5%
- −$436 /mo · $5,235/yr
- Insurance
- −$145
- HOA
- −$0
- Vacancy / Maint / Mgmt
- −$644
- Net cashflow
- $10
Break-even live
UW: 25.0% down · 7.5% · 30yr · 1.5% tax · 5.0% vac · 8.0% maint · 8.0% mgmt
Financing live
Cash to close
- Down payment
- $87,250
- Closing costs
- $10,470
- Reserves months
- —
- Total cash needed
- —
Loan-product check · same deal, 3 products live
Conventional
25% down · 7.5% · 30yr
- Down + closing
- —
- Monthly P&I
- —
- Monthly cashflow
- —
- DSCR
- —
- Eligible?
- —
Personal DTI + credit; lowest rate.
DSCR
20% down · 8.5% · 30yr
- Down + closing
- —
- Monthly P&I
- —
- Monthly cashflow
- —
- DSCR
- —
- Eligible?
- —
No personal income docs; deal must DSCR.
Hard money
10% down · 12.0% · 12mo
- Down + closing
- —
- Monthly P&I
- —
- Monthly cashflow
- —
- DSCR
- —
- Eligible?
- —
Short-term bridge; refi at stabilization.
Rent comps 20 comps
| Address | Beds | Baths | Sqft | Rent | $/sqft | DOM | Units | Dist |
|---|---|---|---|---|---|---|---|---|
| 22 Westside Ave Haverstraw, NY | 3.0 | 2.0 | 1260 | $3,200 | $2.54 | 43d | 1 | 0.06mi |
| 42 Peck St West Haverstraw, NY | 2.0 | 2.0 | 1000 | $2,950 | $2.95 | 43d | 1 | 0.35mi |
| 27-29-31 Lakeview Ct Unit 29 Haverstraw, NY | 2.0 | 1.0 | 1200 | $2,550 | $2.12 | 10d | 1 | 0.38mi |
| 100 Westside Ave Unit 2 Haverstraw, NY | 3.0 | 1.0 | 1492 | $2,485 | $1.67 | 1d | 1 | 0.38mi |
| 56 Coolidge St Haverstraw, NY | 3.0 | 1.5 | 1440 | $3,500 | $2.43 | 11d | 1 | 0.44mi |
| 19 Conger Ave Unit 2 Haverstraw, NY | 2.0 | 1.0 | 900 | $2,750 | $3.06 | 43d | 1 | 0.51mi |
| 31 N Wayne Ave West Haverstraw, NY | 3.0 | 2.0 | 1080 | $3,400 | $3.15 | 24d | 1 | 0.74mi |
| 1 Kensington Cir Haverstraw, NY | 1.0–2.0 | 1.0 | 1017 | $2,975 | $2.92 | 1d | 3 | 0.86mi |
| 176 Ramapo Rd Garnerville, NY | 1.0 | 1.0 | 818 | $2,395 | $2.93 | 1d | 3 | 0.88mi |
| 72 Benson St Unit 4 West Haverstraw, NY | 2.0 | 1.0 | 825 | $2,500 | $3.03 | 13d | 1 | 0.89mi |
| 126 Roosevelt Dr West Haverstraw, NY | 3.0 | 1.5 | 1404 | $3,600 | $2.56 | 43d | 1 | 0.90mi |
| 1100 Admirals Cove Blvd Haverstraw, NY | 2.0 | 1.0–2.0 | 887 | $6,095 | $6.87 | 1d | 36 | 0.95mi |
| 12 Roosevelt Dr West Haverstraw, NY | 3.0 | 1.5 | 1400 | $3,600 | $2.57 | 16d | 1 | 0.96mi |
| 1405 Round Pointe Dr Haverstraw, NY | 1.0 | 1.5 | 817 | $3,500 | $4.28 | 1d | 1 | 0.96mi |
| 1321 Round Pointe Dr Haverstraw, NY | 1.0 | 1.5 | 1095 | $3,850 | $3.52 | 1d | 1 | 0.97mi |
| 2100 Round Pointe Dr Haverstraw, NY | 1.0–2.0 | 1.5–2.0 | 1143 | $4,295 | $3.76 | 1d | 7 | 1.05mi |
| 11 Brush Ct Garnerville, NY | 2.0 | 1.0 | 1100 | $2,500 | $2.27 | 7d | 1 | 1.07mi |
| 3111 Leeward Dr Haverstraw, NY | 1.0 | 1.0 | 979 | $2,950 | $3.01 | 2d | 1 | 1.08mi |
| 3106 Leeward Dr Haverstraw, NY | 1.0 | 1.0 | 906 | $2,650 | $2.92 | 21d | 1 | 1.09mi |
| 4100 Southerly Pointe Dr Haverstraw, NY | 2.0 | 1.0–2.5 | 1055 | $4,450 | $4.22 | 1d | 7 | 1.11mi |
Listing history 31 events
-
2026-06-18days on market $349,000 Active 45 DOM
-
2026-06-17days on market $349,000 Active 44 DOM
-
2026-06-16days on market $349,000 Active 43 DOM
-
2026-06-15days on market $349,000 Active 42 DOM
-
2026-06-13days on market $349,000 Active 40 DOM
-
2026-06-10days on market $349,000 Active 36 DOM
-
2026-06-08days on market $349,000 Active 35 DOM
-
2026-06-07days on market $349,000 Active 34 DOM
-
2026-06-04days on market $349,000 Active 31 DOM
-
2026-06-03days on market $349,000 Active 30 DOM
-
2026-06-02days on market $349,000 Active 29 DOM
-
2026-06-01days on market $349,000 Active 28 DOM
-
2026-05-31days on market $349,000 Active 27 DOM
-
2026-05-04$349,000 Active 863-char remark
-
2026-05-03historical
-
2026-04-15price $349,000
-
2026-04-13status Active
-
2026-02-02$379,000 Active
-
2021-11-08soldstatus $226,000
-
2021-10-28soldstatus $226,000 Closed
Show marketing remark (376 chars)
Why rent when you can own?! no need to look further, move into your very own beautiful cozy nest or rent it out for income/investment. Perfect starter home in desirable Village of Haverstraw, features 2 bedrooms, full bath, eat-in kitchen with dinette/living room. Nice size patio to hang out out and enjoy your privacy. House was updated in 2010 and has a new hot water tank.
-
2021-07-26status Pending
Show marketing remark (376 chars)
Why rent when you can own?! no need to look further, move into your very own beautiful cozy nest or rent it out for income/investment. Perfect starter home in desirable Village of Haverstraw, features 2 bedrooms, full bath, eat-in kitchen with dinette/living room. Nice size patio to hang out out and enjoy your privacy. House was updated in 2010 and has a new hot water tank.
-
2021-06-21$199,000 Active
Show marketing remark (376 chars)
Why rent when you can own?! no need to look further, move into your very own beautiful cozy nest or rent it out for income/investment. Perfect starter home in desirable Village of Haverstraw, features 2 bedrooms, full bath, eat-in kitchen with dinette/living room. Nice size patio to hang out out and enjoy your privacy. House was updated in 2010 and has a new hot water tank.
-
2007-12-27soldstatus $141,000
-
2007-12-24price $149,900
-
2007-12-24historical
-
2007-05-31$141,000
-
2003-05-23soldstatus $145,000
-
2003-03-18price $147,500
-
2003-03-18historical
-
2003-02-20$145,000
-
1979-11-21soldstatus $6,765
ⓘ Source: listings_history table (triggers on properties + properties_extension) + one-shot
backfill from property_details.listing_events for pre-trigger history.
Climate risk First Street
- Flood 1/10 Low FEMA zone X (unshaded) · 0% chance over 30 yrs
- Wildfire 4/10 Moderate
- Heat 6/10 Major 7 d/yr ≥100°F today · 16 d/yr by 30 yrs out
- Wind 4/10 Moderate 21% chance of damaging wind over 30 yrs
- Air quality 3/10 Moderate 2 unhealthy d/yr today · 3 by 30 yrs out
Nearby sold comps map
Loading sold comps map…
Walkable amenities ~0.75 mi
Loading nearby amenities…
Taxation est. · year 1
- Rental income
- $36,791
- − Mortgage interest
- −$19,549
- − Property taxes
- −$5,235
- − Insurance
- −$1,745
- − Repairs & maintenance
- −$2,943
- − Management
- −$2,943
- − Depreciation
- −$10,153
- Taxable loss
- −$5,778
- Est. tax savings @ 24.0%
- +$1,387
- After-tax cash flow
- $1,509/yr
For passive investors: Depreciation is non-cash, so a rental often shows a tax loss while cash-flowing — sheltering income. Rental losses are passive: they offset passive income freely, and up to $25,000/yr can offset ordinary (W-2) income if you actively participate and your MAGI is under $100k (phasing out to $0 by $150k); unused losses carry forward. On sale, claimed depreciation is recaptured at up to 25%, and gains may owe capital-gains tax (a 1031 exchange can defer both). Figures are a year-1 estimate at your 24.0% rate — not tax advice; consult a CPA.
Schools (NCES district)
- District
- Haverstraw-Stony Point CSD (North Rockland)
- NCES district ID
- 3614010
- Math proficiency
- 41% ▼ -7.00%
- Reading proficiency
- 47% ▼ -1.00%
- Median HH income
- $80,218
- Composite
- 40.68/100
- National rank
- #3672
- State rank
- #427 of 590 in NY
Livability — Haverstraw
- Score
- 57/100
- State rank
- #1087
- US rank
- #21649
Category grades
Schools grade is shown separately in the Schools card above.
Census & demographics
- Census place
- Haverstraw, NY
- County
- Rockland County · 98,828 people
- City population
- 12,325
- Metro
- New York-Newark-Jersey City, NY-NJ-PA
- Population (ZIP)
- 12,325
- Household income
- $75,167
- Rent vs Own
- Severe rent burden
- 791.0
Population outlook (Rockland County) Hauer SSP2
- Today (2025)
- 339,642 people
- By 2030
- 345,987 · +1.9%
- By 2040
- 357,178 · +5.2%
- By 2050
- 362,456 · +6.7%
- By 2075
- 367,281 · +8.1%
- By 2100
- 328,211 · -3.4%
Race, ethnicity, and origin ACS 2023
- Neighborhood character
- Diverse neighborhood (Simpson 0.57)
- Race & ethnicity
- Hispanic / Latino 61% Two or more races 24% White 18% Black 17% Asian 3% Native American 2%
- Hispanic origin (detail)
- Mexican 3% Puerto Rican 8% Dominican 32%
- Common ancestry
- Hispanic 5% Romanian 1% Scotch-Irish 1%
- Foreign-born
- 43% · Canada, Dominican Republic, Guatemala
- Languages at home
- 38% English-only · Spanish 53% French/Haitian/Cajun 6% Other Asian/Pacific 2%
Political lean MEDSL · Rockland
- 2024 margin
- R (+11.8) · D 44.1% · R 55.9%
- 2008→2024 swing
- -17.7pp toward R · 2008: 5.9pp · 2024: -11.8pp
- All cycles
- 2024: R+11.8 2020: D+1.7 2016: D+5.1 2012: D+6.6 2008: D+5.9
Not yet ingested
- Civics
- —
Market trends
- HPI YoY
- ▼ -73.63%
- Current HPI
- 238.4313
- Rent YoY
- ▲ 7.62%
- Metro
- New York-Newark-Jersey City, NY-NJ-PA
- State GDP YoY
- ▲ 2.60%
- F500 in state
- 92
Industry mix (Fortune 500 HQ in NY)
| Industry | F500 HQs | Revenue |
|---|---|---|
| Financial Services | 10 | $950B |
|
||
| Consumer Goods | 9 | $162B |
|
||
| Insurance | 4 | $225B |
|
||
| Telecommunications | 2 | $144B |
|
||
| Pharmaceuticals | 2 | $112B |
|
||
| Media / Entertainment | 2 | $69B |
|
||
Price history
+5058.9% since first listed18 events — show timeline
- 2026-05-04 Listed $349,000 OneKey® MLS as Distributed by MLS Grid
- 2026-05-03 Listing Removed — OneKey® MLS as Distributed by MLS Grid
- 2026-04-15 Price Changed $349,000 OneKey® MLS as Distributed by MLS Grid
- 2026-04-13 Relisted — OneKey® MLS as Distributed by MLS Grid
- 2026-02-02 Listed $379,000 OneKey® MLS as Distributed by MLS Grid
- 2021-11-08 Sold (Public Records) $226,000 Public Records
- 2021-10-28 Sold (MLS) $226,000 OneKey® MLS as Distributed by MLS Grid
- 2021-07-26 Pending — OneKey® MLS as Distributed by MLS Grid
- 2021-06-21 Listed $199,000 OneKey® MLS as Distributed by MLS Grid
- 2007-12-27 Sold (MLS) $141,000 HGMLS
- 2007-12-24 Delisted — HGMLS
- 2007-12-24 Price Changed $149,900 HGMLS
- 2007-05-31 Listed $141,000 HGMLS
- 2003-05-23 Sold (MLS) $145,000 HGMLS
- 2003-03-18 Delisted — HGMLS
- 2003-03-18 Price Changed $147,500 HGMLS
- 2003-02-20 Listed $145,000 HGMLS
- 1979-11-21 Sold (Public Records) $6,765 Public Records
Property tax history
+17.4%/yrLatest (2025): $44,682 · +7.8% YoY. Source: county tax records.
Cash-flow waterfall
monthlySold comps — $/sqft
last 12 mo · ≤1 miLoading sold comps…