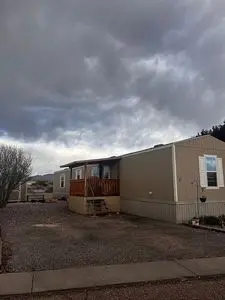
3501 N Camino Atocha · Santa Fe, NM
Flood risk No data
- FEMA flood zone
- —
- Chance of flooding over 30 yrs
- —
- Est. flood insurance / yr
- —
Fire risk No data
- Est. fire insurance / yr
- —
Heat risk No data
- Hot days now (above threshold)
- —
- Hot days in 30 yrs
- —
Wind risk No data
- Chance of severe wind over 30 yrs
- —
Air-quality risk No data
- Unhealthy air days now
- —
- Unhealthy air days in 30 yrs
- —
Risk factors via First Street. Map © Google.
Why this score? — see what drove the B grade
The composite is a weighted blend of 9 inputs, each scored 0–100. Each bar is that input's sub-score; the figure is the points it added to the 100-point composite (weight × sub-score).
- Cash flow +30.0/30.0
- DSCR +10.0/10.0
- 1% rule +9.2/10.0
- ARV discount +7.5/15.0
- Schools +4.5/10.0
- Livability +3.7/5.0
- Rent growth +2.6/5.0
- Condition / age +2.5/5.0
- Appreciation +0.0/10.0
$175,000
🖨 Deal sheet 📄 Offer letter ✓ Due diligence
Listing remarks
This single wide mobile home has two bedrooms and two full bathrooms. Along with an extra room that can be used as an office or small bedroom. It is fully furnished and has all appliances. It has refrigerated air. The home has a porch at the entrance and there is an 8x10 shed available for extra storage.
Key facts
- Refrigerated air
- Porch
- Extra room
Tags
Neighborhood map
What this means for you Summary
Snapshot
- This is a 3-bed/2.0-bath other listed at $175k.
Deal economics
- At list price, monthly cash flow is $759 ($9k/yr) — positive.
- The deal already cash-flows at list — no discount required.
- Meets the 1% rule at list price ($2k rent vs $175k).
- Recommended offer: $172k (1.5% below list) — sets the bar for market timing.
- Cap rate 11.5% vs local median 2.4% in Santa Fe — top-decile yield for the area; either an underpriced asset or a hidden risk that comps aren't pricing in. Stress-test before assuming the spread holds.
Location & tenants
- Location reads 74/100 on livability (#9 in NM, #4,641 nationally) — a middle-class / working-renter tenant base. Strengths: amenities A+, commute A+, health & safety A+; Watch: schools D-, crime F.
- Santa Fe Public Schools (urban): math 34% / reading 70% proficiency, ranked #6 of 29 in NM (top 21%) — acceptable for families but not a draw, mixed tenant base, ~2y average lease; 64% free/reduced lunch — lower-income household profile, screen leases tightly.
- Market conditions: Rents flat; 260 active listings in the ZIP; 13 comparable units currently listed for rent nearby; rentals lingering (median 44d on market — plan ~5-8 weeks vacancy on turnover, expect pricing pressure); 62% of comp listings sitting > 30 days — soft ceiling on asking rent; 244 units permitted in Santa Fe County in 2024 (0 in 5+ unit buildings).
- This rent runs 42% of the median local income ($70k/yr) — at the standard rent-burdened threshold; future hikes will face affordability resistance.
Forward outlook
- Local home prices are declining (-3.0%/yr); year-one equity from $1k of loan paydown is wiped out by about $5k of value loss. Plan a longer hold.
- At projected returns (-3.0% appreciation + 0.4% rent growth), your $49k cash investment doubles in ~9 years — after that, you're playing with house money.
Negotiation context
- It's been on market 25 days — a 2% lower offer ($172k) is reasonable based on typical stale-listing flexibility.
Questions for the listing agent
- Is there a deadline driving the sale (1031 exchange, divorce, estate, relocation)? That informs how much negotiation room exists.
- Schools are D-rated, which usually means shorter tenancies and higher turnover. Who's the typical renter profile here, and what's been the actual vacancy rate?
- Crime grade is F in this area — have there been break-ins, vandalism, or insurance claims at this property in the last 3 years? What carrier currently insures it and at what premium?
- What's the average days-on-market for RENTAL listings here right now (not sales)? A rising rental-DOM trend means longer vacancies and softer asking-rent achievability than the comps imply.
- What's the recent tenant-quality profile in this submarket — average credit score on applications, eviction rate, late-payment / NSF rate, and stable-employment percentage? A property-management company in the area should have these aggregated.
- How much new for-sale + rental construction is in the pipeline within 1–3 miles? Heavy new supply typically softens prices + rents 12–24 months out; constrained supply supports both.
Investment metrics
- 1% rule
- 1.42% ✓
- Cap rate
- 11.50%
- Cash-on-cash
- 18.59%
- DSCR
- 1.83
- GRM
- 5.9
CMA / ARV
No comps found within radius.
Projected returns pro-forma
-3.0% appreciation · 0.43% rent growth · sell at horizon
- IRR
- 7.4%
- Equity multiple
- 1.28×
- Total profit
- $13,750
- Equity at exit
- $26,093
- IRR
- 14.3%
- Equity multiple
- 2.02×
- Total profit
- $49,901
- Equity at exit
- $15,131
Cash invested: $49,000 (down + closing). Projections, not guarantees.
Landlord ↔ Tenant lean methodology
- Overall (STATE)
- 55 Moderately Landlord-Leaning
- State New Mexico
- 55 Moderately Landlord-Leaning · D+3
- County
- — inherits STATE
- City
- — inherits STATE
ZIP-level market 87507
- Rents YoY
- 0.4%
- Active inventory
- 260
- Price-to-rent
- 5.9×
Monthly cashflow live
- Estimated rent
- $2,492 high interval (Pro) →
- Mortgage (P&I)
- −$918
- Tax est. 1.5%
- −$219 /mo · $2,625/yr
- Insurance
- −$73
- HOA
- −$0
- Vacancy / Maint / Mgmt
- −$523
- Net cashflow
- $759
Break-even live
UW: 25.0% down · 7.5% · 30yr · 1.5% tax · 5.0% vac · 8.0% maint · 8.0% mgmt
Financing live
Cash to close
- Down payment
- $43,750
- Closing costs
- $5,250
- Reserves months
- —
- Total cash needed
- —
Loan-product check · same deal, 3 products live
Conventional
25% down · 7.5% · 30yr
- Down + closing
- —
- Monthly P&I
- —
- Monthly cashflow
- —
- DSCR
- —
- Eligible?
- —
Personal DTI + credit; lowest rate.
DSCR
20% down · 8.5% · 30yr
- Down + closing
- —
- Monthly P&I
- —
- Monthly cashflow
- —
- DSCR
- —
- Eligible?
- —
No personal income docs; deal must DSCR.
Hard money
10% down · 12.0% · 12mo
- Down + closing
- —
- Monthly P&I
- —
- Monthly cashflow
- —
- DSCR
- —
- Eligible?
- —
Short-term bridge; refi at stabilization.
Rent comps 13 comps
| Address | Beds | Baths | Sqft | Rent | $/sqft | DOM | Units | Dist |
|---|---|---|---|---|---|---|---|---|
| 521 Camino Solano Santa Fe, NM | 2.0 | 2.0 | 1300 | $2,800 | $2.15 | 43d | 1 | 0.14mi |
| 1703A Jay St Santa Fe, NM | 3.0 | 2.0 | 1500 | $2,650 | $1.77 | 43d | 1 | 0.67mi |
| 1704 2nd St Unit B Santa Fe, NM | 2.0 | 1.0 | 1081 | $1,800 | $1.67 | 21d | 1 | 0.72mi |
| 2412 Rosina St Santa Fe, NM | 3.0 | 2.0 | 1498 | $2,500 | $1.67 | 43d | 1 | 0.79mi |
| 920 Shoofly St Unit W9 Santa Fe, NM | 2.0 | 1.0 | 811 | $1,975 | $2.44 | 43d | 1 | 0.84mi |
| 920 Shoofly St Unit E8 Santa Fe, NM | 2.0 | 2.0 | 983 | $2,300 | $2.34 | 43d | 1 | 0.84mi |
| 920 Shoofly St Unit E3 Santa Fe, NM | 2.0 | 2.0 | 925 | $2,100 | $2.27 | 43d | 1 | 0.86mi |
| 1361 Santa Rosa Dr Santa Fe, NM | 3.0 | 2.0 | 1242 | $3,000 | $2.42 | 21d | 1 | 0.86mi |
| 950 W Cordova Rd Santa Fe, NM | 1.0–2.0 | 1.0–2.0 | 781 | $2,562 | $3.28 | 21d | 7 | 1.17mi |
| 406 Cortez Pl Santa Fe, NM | 3.0 | 2.0 | 1450 | $2,650 | $1.83 | 43d | 1 | 1.23mi |
| 2029 Cll Lorca Santa Fe, NM | 1.0–3.0 | 1.0–2.0 | 775 | $1,799 | $2.32 | 21d | 7 | 1.23mi |
| 1896 Lorca Dr Santa Fe, NM | 1.0–3.0 | 1.0–2.5 | 1025 | $2,405 | $2.35 | 21d | 12 | 1.32mi |
| 2800 Cerrillos Rd #118 Santa Fe, NM | 2.0 | 1.0 | 900 | $1,395 | $1.55 | 43d | 1 | 1.34mi |
Listing history 18 events
-
2026-06-19days on market $175,000 Active 25 DOM
-
2026-06-18days on market $175,000 Active 24 DOM
-
2026-06-17days on market $175,000 Active 23 DOM
-
2026-06-16days on market $175,000 Active 22 DOM
-
2026-06-15days on market $175,000 Active 21 DOM
-
2026-06-14days on market $175,000 Active 19 DOM
-
2026-06-13days on market $175,000 Active 18 DOM
-
2026-06-10days on market $175,000 Active 16 DOM
-
2026-06-09days on market $175,000 Active 15 DOM
-
2026-06-08days on market $175,000 Active 14 DOM
-
2026-06-07days on market $175,000 Active 13 DOM
-
2026-06-03days on market $175,000 Active 9 DOM
-
2026-06-02days on market $175,000 Active 8 DOM
-
2026-06-01days on market $175,000 Active 7 DOM
-
2026-05-31days on market $175,000 Active 6 DOM
-
2026-05-30days on market $175,000 Active 5 DOM
-
2026-05-26$175,000 Active
-
2011-05-18soldstatus
ⓘ Source: listings_history table (triggers on properties + properties_extension) + one-shot
backfill from property_details.listing_events for pre-trigger history.
Nearby sold comps map
Loading sold comps map…
Walkable amenities ~0.75 mi
Loading nearby amenities…
Taxation est. · year 1
- Rental income
- $29,902
- − Mortgage interest
- −$9,803
- − Property taxes
- −$2,625
- − Insurance
- −$875
- − Repairs & maintenance
- −$2,392
- − Management
- −$2,392
- − Depreciation
- −$5,091
- Taxable income
- $6,724
- Est. tax owed @ 24.0%
- −$1,614
- After-tax cash flow
- $7,496/yr
For passive investors: Depreciation is non-cash, so a rental often shows a tax loss while cash-flowing — sheltering income. Rental losses are passive: they offset passive income freely, and up to $25,000/yr can offset ordinary (W-2) income if you actively participate and your MAGI is under $100k (phasing out to $0 by $150k); unused losses carry forward. On sale, claimed depreciation is recaptured at up to 25%, and gains may owe capital-gains tax (a 1031 exchange can defer both). Figures are a year-1 estimate at your 24.0% rate — not tax advice; consult a CPA.
Schools (NCES district)
- District
- Santa Fe Public Schools
- NCES district ID
- 3502370
- Math proficiency
- 34% ▲ 16.00%
- Reading proficiency
- 70% ▲ 40.00%
- Median HH income
- $55,031
- Composite
- 44.78/100
- National rank
- #2744
- State rank
- #6 of 29 in NM
Livability — Santa Fe
- Score
- 74/100
- State rank
- #9
- US rank
- #4641
Category grades
Schools grade is shown separately in the Schools card above.
Census & demographics
- Census place
- Santa Fe, NM
- County
- Santa Fe County · 118,003 people
- City population
- 118,003
- Metro
- Santa Fe, NM
- Population (ZIP)
- 51,386
- Household income
- $70,398
- Rent vs Own
- Severe rent burden
- 2054.0
Population outlook (Santa Fe County) Hauer SSP2
- Today (2025)
- 156,674 people
- By 2030
- 159,422 · +1.8%
- By 2040
- 160,891 · +2.7%
- By 2050
- 159,966 · +2.1%
- By 2075
- 161,318 · +3.0%
- By 2100
- 157,302 · +0.4%
Race, ethnicity, and origin ACS 2023
- Neighborhood character
- Predominantly Hispanic (68%)
- Race & ethnicity
- Hispanic / Latino 68% Two or more races 28% White 25% Native American 3% Asian 2%
- Hispanic origin (detail)
- Mexican 42%
- Common ancestry
- Slovak 2% Lithuanian 2% Italian 1%
- Foreign-born
- 20% · Canada, China
- Languages at home
- 56% English-only · Spanish 41% Russian/Polish/Slavic 1%
Political lean MEDSL · Santa Fe
- 2024 margin
- Solid D (+48.9) · D 73.3% · R 24.4% · Other 2.2%
- 2008→2024 swing
- -6.1pp toward R · 2008: 55.0pp · 2024: 48.9pp
- All cycles
- 2024: D+48.9 2020: D+53.8 2016: D+51.0 2012: D+51.0 2008: D+55.0
Not yet ingested
- Civics
- —
Market trends
- HPI YoY
- ▼ -272.71%
- Current HPI
- 248.2978
- Rent YoY
- ▲ 0.43%
- Metro
- Santa Fe, NM
- State GDP YoY
- —
- F500 in state
- 0
Price history
2 events — show timeline
- 2026-05-26 Listed $175,000 FSBO.com
- 2011-05-18 Sold (Public Records) — Public Records
Property tax history
+1.6%/yrLatest (2025): $9,470 · -3.3% YoY. Source: county tax records.
Cash-flow waterfall
monthlySold comps — $/sqft
last 12 mo · ≤1 miLoading sold comps…