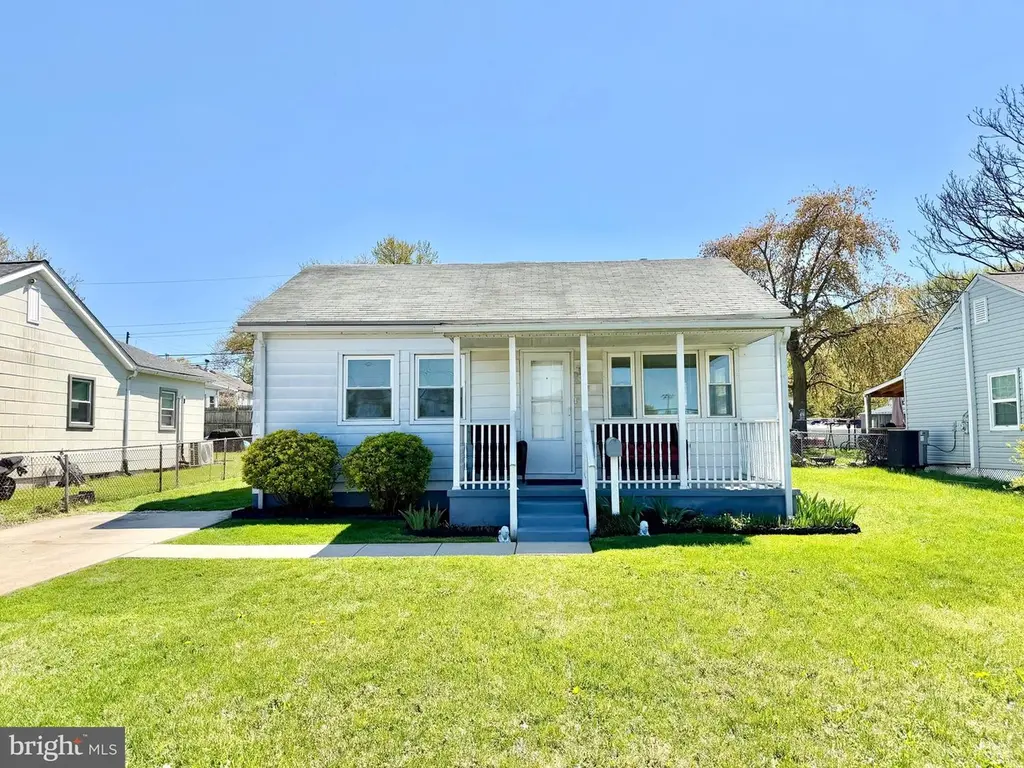
557 Compass Rd · Middle River, MD
Flood risk 1/10 · Minimal
- FEMA flood zone
- X (unshaded)
- Chance of flooding over 30 yrs
- 0.0%
- Est. flood insurance / yr
- $507 – $1,088
Fire risk 3/10 · Minor
- Est. fire insurance / yr
- $755 – $1,403
Heat risk 8/10 · Major
- Hot days now (above 104°F)
- 7 days/yr
- Hot days in 30 yrs
- 15 days/yr
Wind risk 6/10 · Moderate
- Chance of severe wind over 30 yrs
- 27.0%
Air-quality risk 5/10 · Moderate
- Unhealthy air days now
- 6 days/yr
- Unhealthy air days in 30 yrs
- 8 days/yr
Risk factors via First Street. Map © Google.
Why this score? — see what drove the C- grade
The composite is a weighted blend of 9 inputs, each scored 0–100. Each bar is that input's sub-score; the figure is the points it added to the 100-point composite (weight × sub-score).
- Cash flow +15.9/30.0
- ARV discount +15.0/15.0
- DSCR +4.9/10.0
- 1% rule +4.1/10.0
- Livability +3.9/5.0
- Rent growth +2.7/5.0
- Condition / age +2.5/5.0
- Schools +2.3/10.0
- Appreciation +0.0/10.0
$225,000
🖨 Deal sheet (PDF) 📄 Offer letter ✓ Due diligence
Listing remarks MLS
One of the largest homes in the neighborhood; over 1200 sq ft of livable space. Includes many upgrades; dual pane replacement windows, HVAC system only 7 years old, the roof is approximately 9 years old, electrical upgrades were made in 2008; 200 amp service. The seller is still in the process of making cosmetic improvements. Come and take a look at this home; you will be impressed.
Key facts
- Level yard
- 5,000 sq ft lot
- 2 parking spots
Tags
Neighborhood map
What this means for you Summary
Snapshot
- This is a 3-bed/1.0-bath single-family listed at $225k.
Deal economics
- At list price, monthly cash flow is $105 ($1k/yr) — positive.
- The deal already cash-flows at list — no discount required.
- To meet the 1% rule (rent ≥ 1% of price), the offer needs to be $205k (9.1% below list).
- Recommended offer: $205k (9.1% below list) — sets the bar for 1% rule.
- Cap rate 6.9% vs local median 4.2% in Middle River — top-decile yield for the area; either an underpriced asset or a hidden risk that comps aren't pricing in. Stress-test before assuming the spread holds.
Location & tenants
- Location reads 78/100 on livability (#76 in MD, #2,777 nationally) — a middle-class / working-renter tenant base. Strengths: commute A+, housing A+, health & safety A+; Watch: crime F.
- Baltimore County Public Schools (suburban): math 15% / reading 34% proficiency, ranked #11 of 24 in MD (top 46%) — low school quality limits family demand, transient renter base, plan for 1-2y turnover.
- Zoned schools: Victory Villa Elementary (math 8% / reading 13%, grade F, #590 of 860 statewide, top 70%, 659 students, 75% FRL); Middle River Middle (math 5% / reading 32%, grade F, #159 of 225 statewide, top 73%, 978 students, 62% FRL); Kenwood High (math 10% / reading 43%, grade F, #161 of 222 statewide, top 72%, 1,908 students, 63% FRL) — zoned schools average 67% FRL vs 39% district-wide (28 pts higher); higher-poverty schools than district average — tighter screening recommended.
- Market conditions: Rents flat; 252 active listings in the ZIP; 24 comparable units currently listed for rent nearby; rentals at typical pace (median 26d on market — plan ~3-4 weeks tenant-placement turnaround); 42% of comp listings sitting > 30 days — soft ceiling on asking rent; solid renter incomes; 1,511 units permitted in Baltimore County in 2024 (643 in 5+ unit buildings).
- This rent runs 30% of the median local income ($82k/yr) — at the standard rent-burdened threshold; future hikes will face affordability resistance.
Forward outlook
- Local home prices are declining (-3.0%/yr); year-one equity from $2k of loan paydown is wiped out by about $7k of value loss. Plan a longer hold.
- Baltimore County population projected at +12% by 2050 — modest demand growth; plan on rents tracking national, not racing it.
Negotiation context
- Only 4 days on market — expect competitive offers; lowballing is unlikely to land.
- 3 sale attempts since 8y ago with the ask held roughly flat each time — persistent listings suggest the price (not the market) is what's stuck; bring a comps-based counter.
- Current owner paid $130k; list at $225k implies a 73% gain — meaningful room to come down on a strong offer.
Risks & watch-outs
- Watch-outs: built in 1942 — expect roof / HVAC / electrical / plumbing capex.
- Climate carrying-cost: major wind risk, 27% chance of damaging wind over 30y; extreme-heat days projected 7→15/yr by 2055 (HVAC capex compounding) — expect insurance premiums to compound above CPI over the hold.
Questions for the listing agent
- Built in 1942 — when were the roof, HVAC, electrical panel, plumbing, and water heater last replaced?
- Is there a deadline driving the sale (1031 exchange, divorce, estate, relocation)? That informs how much negotiation room exists.
- Schools are F-rated, which usually means shorter tenancies and higher turnover. Who's the typical renter profile here, and what's been the actual vacancy rate?
- Crime grade is F in this area — have there been break-ins, vandalism, or insurance claims at this property in the last 3 years? What carrier currently insures it and at what premium?
- What's the average days-on-market for RENTAL listings here right now (not sales)? A rising rental-DOM trend means longer vacancies and softer asking-rent achievability than the comps imply.
- What's the recent tenant-quality profile in this submarket — average credit score on applications, eviction rate, late-payment / NSF rate, and stable-employment percentage? A property-management company in the area should have these aggregated.
- How much new for-sale + rental construction is in the pipeline within 1–3 miles? Heavy new supply typically softens prices + rents 12–24 months out; constrained supply supports both.
Investment metrics
- 1% rule
- 0.91% ✗
- Cap rate
- 6.85%
- Cash-on-cash
- 2.00%
- DSCR
- 1.09
- GRM
- 9.2
CMA / ARV
- ARV (on-the-fly)
- $279,328
- Comps found
- 12
Show comp detail 12 sales within ~0.75 mi
| Address | Dist | Beds/Ba | Sqft | Sold | Price | $/sf | Match |
|---|---|---|---|---|---|---|---|
| 557 Compass Rd | 0.00mi | 3/1.0 | 1,204 (0%) | 1mo | $247,000 | $205 | 99 |
| 559 Compass Rd | 0.01mi | 3/1.0 | 1,160 (-4%) | 14mo | $220,000 | $190 | 82 |
| 563 Compass Rd | 0.04mi | 3/2.0 | 1,164 (-3%) | 14mo | $270,000 | $232 | 77 |
| 29 Transverse Ave | 0.39mi | 3/2.0 | 1,200 (-0%) | 11mo | $324,900 | $271 | 68 |
| 4 Manifold Ct | 0.05mi | 3/1.0 | 1,102 (-8%) | 23mo | $220,000 | $200 | 65 |
| 501 Middle River Rd | 0.35mi | 2/1.0 (-1) | 1,188 (-1%) | 22mo | $185,000 | $156 | 58 |
| 320 Harding Ave | 0.41mi | 2/2.0 (-1) | 1,152 (-4%) | 8mo | $242,500 | $211 | 58 |
| 67 Torque Way | 0.34mi | 3/1.0 | 1,064 (-12%) | 13mo | $285,000 | $268 | 54 |
| 13 Helicopter | 0.72mi | 3/1.0 | 1,148 (-5%) | 19mo | $259,900 | $226 | 42 |
| 53 Longeron Dr | 0.65mi | 3/2.0 | 1,050 (-13%) | 7mo | $260,000 | $248 | 39 |
| 10 Taxi Way | 0.52mi | 3/2.0 | 1,035 (-14%) | 12mo | $300,000 | $290 | 38 |
| 125 Dihedral Dr | 0.70mi | 3/2.0 | 1,056 (-12%) | 13mo | $300,000 | $284 | 32 |
Match score weights: distance 35% · size 25% · config 20% · recency 20%. Top-matched comps best support the ARV.
Projected returns pro-forma
-3.0% appreciation · 0.83% rent growth · sell at horizon
- IRR
- -15.5%
- Equity multiple
- 0.46×
- Total profit
- $-34,137
- Equity at exit
- $33,548
- IRR
- -11.2%
- Equity multiple
- 0.39×
- Total profit
- $-38,272
- Equity at exit
- $19,454
Cash invested: $63,000 (down + closing). Projections, not guarantees.
Landlord ↔ Tenant lean methodology
- Overall (STATE)
- 27 Tenant-Leaning
- State Maryland
- 27 Tenant-Leaning · D+14
- County
- — inherits STATE
- City
- — inherits STATE
ZIP-level market 21220
- Rents YoY
- 0.8%
- Active inventory
- 252
- Price-to-rent
- 9.2×
Monthly cashflow live
- Estimated rent
- $2,046 high interval (Pro) →
- Mortgage (P&I)
- −$1,180
- Tax from tax record
- −$238 /mo · $2,853/yr
- Insurance
- −$94
- HOA
- −$0
- Vacancy / Maint / Mgmt
- −$430
- Net cashflow
- $105
Break-even live
Sensitivity live
| Price | -10% $232 | -5% $169 | +0% $105 | +5% $41 | +10% $-22 |
|---|---|---|---|---|---|
| Rent | -10% $-57 | -5% $24 | +0% $105 | +5% $186 | +10% $267 |
| Rate | -1.0pp $218 | -0.5pp $162 | base $105 | +0.5pp $47 | +1.0pp $-13 |
UW: 25.0% down · 7.5% · 30yr · 1.5% tax · 5.0% vac · 8.0% maint · 8.0% mgmt
Financing live
Cash to close
- Down payment
- $56,250
- Closing costs
- $6,750
- Reserves months
- —
- Total cash needed
- —
Loan-product check · same deal, 3 products live
Conventional
25% down · 7.5% · 30yr
- Down + closing
- —
- Monthly P&I
- —
- Monthly cashflow
- —
- DSCR
- —
- Eligible?
- —
Personal DTI + credit; lowest rate.
DSCR
20% down · 8.5% · 30yr
- Down + closing
- —
- Monthly P&I
- —
- Monthly cashflow
- —
- DSCR
- —
- Eligible?
- —
No personal income docs; deal must DSCR.
Hard money
10% down · 12.0% · 12mo
- Down + closing
- —
- Monthly P&I
- —
- Monthly cashflow
- —
- DSCR
- —
- Eligible?
- —
Short-term bridge; refi at stabilization.
Rent comps 24 comps
| Address | Beds | Baths | Sqft | Rent | $/sqft | DOM | Units | Dist |
|---|---|---|---|---|---|---|---|---|
| 42 Holcumb Ct Middle River, MD | 3.0 | 1.5 | 1452 | $2,200 | $1.52 | 46d | 1 | 0.40mi |
| 2 Chelmsford Ct Middle River, MD | 3.0 | 1.5 | 1122 | $2,100 | $1.87 | 4d | 1 | 0.43mi |
| 22 Nakota Ct Middle River, MD | 3.0 | 1.5 | 1194 | $2,000 | $1.68 | 46d | 1 | 0.50mi |
| 1513 Aldeney Ave Middle River, MD | 4.0 | 2.0 | 1324 | $2,295 | $1.73 | 26d | 1 | 0.51mi |
| 1516 Becklow Ave Middle River, MD | 3.0 | 1.0 | 1144 | $2,100 | $1.84 | 24d | 1 | 0.54mi |
| 1542 Becklow Ave Middle River, MD | 4.0 | 2.0 | 1224 | $1,800 | $1.47 | 0d | 1 | 0.57mi |
| 201 Middleway Rd Middle River, MD | 1.0–2.0 | 1.0 | 750 | $1,571 | $2.09 | 4d | 24 | 0.58mi |
| 9901 Langs Rd Middle River, MD | 1.0–3.0 | 1.0–1.5 | 950 | $1,795 | $1.89 | 46d | 10 | 0.61mi |
| 303 Endsleigh Ave Middle River, MD | 3.0 | 2.0 | 1144 | $1,950 | $1.70 | 24d | 1 | 0.66mi |
| 303 Holly Dr Middle River, MD | 1.0–2.0 | 1.0 | 739 | $1,510 | $2.04 | 0d | 10 | 0.73mi |
| 233 Orville Rd Essex, MD | 3.0 | 2.0 | 1144 | $1,850 | $1.62 | 46d | 1 | 1.06mi |
| 9 Windsor Way Rosedale, MD | 2.0 | 1.0 | 576 | $1,400 | $2.43 | 0d | 10 | 1.13mi |
| 8 King Henry Cir Rosedale, MD | 3.0 | 1.0 | 1012 | $1,895 | $1.87 | 46d | 1 | 1.13mi |
| 8908 Golden Tree Ln Essex, MD | 4.0 | 1.5 | 1466 | $3,000 | $2.05 | 46d | 1 | 1.20mi |
| 832 N Marlyn Ave Essex, MD | 3.0 | 2.0 | 1416 | $2,300 | $1.62 | 46d | 1 | 1.20mi |
| 153 Bennett Rd Unit Labs Essex, MD | 2.0 | 2.0 | 1196 | $1,800 | $1.51 | 7d | 1 | 1.21mi |
| 47 S Hawthorne Rd Middle River, MD | 3.0 | 1.0 | 1024 | $1,900 | $1.86 | 26d | 1 | 1.25mi |
| 2125 Hawthorne Rd Middle River, MD | 3.0 | 2.0 | 1299 | $2,100 | $1.62 | 46d | 1 | 1.28mi |
| 60 S Hawthorne Rd Middle River, MD | 3.0 | 1.0 | 1234 | $2,250 | $1.82 | 46d | 1 | 1.28mi |
| 421 Torner Rd Essex, MD | 3.0 | 2.0 | 1024 | $2,050 | $2.00 | 24d | 1 | 1.28mi |
| 9206 Oswald Way Rosedale, MD | 1.0–2.0 | 1.0–2.0 | 867 | $2,018 | $2.33 | 0d | 21 | 1.31mi |
| 326 Stemmers Run Rd Essex, MD | 4.0 | 2.0 | 1144 | $2,300 | $2.01 | 46d | 1 | 1.34mi |
| 120 Kingston Rd Middle River, MD | 3.0 | 2.0 | 1024 | $1,950 | $1.90 | 26d | 1 | 1.34mi |
| 5326 King Arthur Cir Rosedale, MD | 3.0 | 1.5 | 1424 | $2,300 | $1.62 | 26d | 1 | 1.35mi |
Listing history 10 events
-
2026-04-18status Pending
-
2026-04-14$225,000 Active
-
2018-08-29soldstatus $130,000
-
2018-08-17soldstatus $130,000 Sold 385-char remark
Show marketing remark (385 chars)
One of the largest homes in the neighborhood; over 1200 sq ft of livable space. Includes many upgrades; dual pane replacement windows, HVAC system only 7 years old, the roof is approximately 9 years old, electrical upgrades were made in 2008; 200 amp service. The seller is still in the process of making cosmetic improvements. Come and take a look at this home; you will be impressed.
-
2018-08-17soldstatus $130,000 Closed 385-char remark
Show marketing remark (385 chars)
One of the largest homes in the neighborhood; over 1200 sq ft of livable space. Includes many upgrades; dual pane replacement windows, HVAC system only 7 years old, the roof is approximately 9 years old, electrical upgrades were made in 2008; 200 amp service. The seller is still in the process of making cosmetic improvements. Come and take a look at this home; you will be impressed.
-
2018-07-19status Pending 385-char remark
Show marketing remark (385 chars)
One of the largest homes in the neighborhood; over 1200 sq ft of livable space. Includes many upgrades; dual pane replacement windows, HVAC system only 7 years old, the roof is approximately 9 years old, electrical upgrades were made in 2008; 200 amp service. The seller is still in the process of making cosmetic improvements. Come and take a look at this home; you will be impressed.
-
2018-07-09historical Active Under Contract 385-char remark
Show marketing remark (385 chars)
One of the largest homes in the neighborhood; over 1200 sq ft of livable space. Includes many upgrades; dual pane replacement windows, HVAC system only 7 years old, the roof is approximately 9 years old, electrical upgrades were made in 2008; 200 amp service. The seller is still in the process of making cosmetic improvements. Come and take a look at this home; you will be impressed.
-
2018-07-09status Contingent (No Kick Out) 385-char remark
Show marketing remark (385 chars)
One of the largest homes in the neighborhood; over 1200 sq ft of livable space. Includes many upgrades; dual pane replacement windows, HVAC system only 7 years old, the roof is approximately 9 years old, electrical upgrades were made in 2008; 200 amp service. The seller is still in the process of making cosmetic improvements. Come and take a look at this home; you will be impressed.
-
2018-07-06$125,000 Active 385-char remark
Show marketing remark (385 chars)
One of the largest homes in the neighborhood; over 1200 sq ft of livable space. Includes many upgrades; dual pane replacement windows, HVAC system only 7 years old, the roof is approximately 9 years old, electrical upgrades were made in 2008; 200 amp service. The seller is still in the process of making cosmetic improvements. Come and take a look at this home; you will be impressed.
ⓘ Source: listings_history table (triggers on properties + properties_extension) + one-shot
backfill from property_details.listing_events for pre-trigger history.
Tax reassessment forecast MD · Partial reset (capped growth)
- Current annual tax
- $2,853 · $238/mo
- Projected year-2 tax
- $2,853 · $238/mo
- Expected delta
- $0/yr ($0/mo · 0.0%)
ⓘ Screening estimate from a state-policy table — verify with the county assessor before closing.
Climate risk First Street
- Flood 1/10 Low FEMA zone X (unshaded) · 0% chance over 30 yrs
- Wildfire 3/10 Moderate
- Heat 8/10 Severe 7 d/yr ≥104°F today · 15 d/yr by 30 yrs out
- Wind 6/10 Major 27% chance of damaging wind over 30 yrs
- Air quality 5/10 Major 6 unhealthy d/yr today · 8 by 30 yrs out
Nearby sold comps map
Loading sold comps map…
Walkable amenities ~0.75 mi
Loading nearby amenities…
Taxation est. · year 1
- Rental income
- $24,554
- − Mortgage interest
- −$12,603
- − Property taxes
- −$2,853
- − Insurance
- −$1,125
- − Repairs & maintenance
- −$1,964
- − Management
- −$1,964
- − Depreciation
- −$6,545
- Taxable loss
- −$2,501
- Est. tax savings @ 24.0%
- +$600
- After-tax cash flow
- $1,861/yr
For passive investors: Depreciation is non-cash, so a rental often shows a tax loss while cash-flowing — sheltering income. Rental losses are passive: they offset passive income freely, and up to $25,000/yr can offset ordinary (W-2) income if you actively participate and your MAGI is under $100k (phasing out to $0 by $150k); unused losses carry forward. On sale, claimed depreciation is recaptured at up to 25%, and gains may owe capital-gains tax (a 1031 exchange can defer both). Figures are a year-1 estimate at your 24.0% rate — not tax advice; consult a CPA.
Schools (NCES district)
- District
- Baltimore County Public Schools
- NCES district ID
- 2400120
- Math proficiency
- 15% ▼ -16.00%
- Reading proficiency
- 34% ▼ -5.00%
- Median HH income
- $66,746
- Composite
- 23.17/100
- National rank
- #7948
- State rank
- #11 of 24 in MD
Livability — Middle River
- Score
- 78/100
- State rank
- #76
- US rank
- #2777
Category grades
Schools grade is shown separately in the Schools card above.
Census & demographics
- Census place
- Middle River, MD
- County
- Baltimore County · 769,527 people
- City population
- 42,824
- Metro
- Baltimore-Columbia-Towson, MD
- Population (ZIP)
- 42,824
- Household income
- $81,817
- Rent vs Own
- Severe rent burden
- 1921.0
Population outlook (Baltimore County) Hauer SSP2
- Today (2025)
- 885,518 people
- By 2030
- 909,272 · +2.7%
- By 2040
- 951,547 · +7.5%
- By 2050
- 990,955 · +11.9%
- By 2075
- 1,086,411 · +22.7%
- By 2100
- 1,135,078 · +28.2%
Race, ethnicity, and origin ACS 2023
- Neighborhood character
- Diverse neighborhood (Simpson 0.60)
- Race & ethnicity
- White 57% Black 27% Two or more races 6% Hispanic / Latino 6% Asian 5%
- Hispanic origin (detail)
- Puerto Rican 1%
- Common ancestry
- Romanian 4% Ukrainian 2% Lithuanian 1%
- Foreign-born
- 12% · Canada, Vietnam
- Languages at home
- 86% English-only · Spanish 3% Arabic 3% Tagalog/Filipino 2%
Political lean MEDSL · Baltimore
- 2024 margin
- Strong D (+24.5) · D 61.0% · R 36.5% · Other 2.5%
- 2008→2024 swing
- +9.9pp toward D · 2008: 14.6pp · 2024: 24.5pp
- All cycles
- 2024: D+24.5 2020: D+27.0 2016: D+17.4 2012: D+16.4 2008: D+14.6
Not yet ingested
- Civics
- —
Market trends
- HPI YoY
- ▼ -199.31%
- Current HPI
- 254.5597
- Rent YoY
- ▲ 0.83%
- Metro
- Baltimore-Columbia-Towson, MD
- State GDP YoY
- ▲ 2.97%
- F500 in state
- 12
Industry mix (Fortune 500 HQ in MD)
| Industry | F500 HQs | Revenue |
|---|---|---|
| Aerospace / Defense | 1 | $71B |
|
||
| Utilities | 1 | $25B |
|
||
| Hotels | 1 | $24B |
|
||
| Consumer Goods | 1 | $7B |
|
||
| Real Estate | 1 | $6B |
|
||
| Chemicals | 1 | $2B |
|
||
Price history
+80.0% since first listed10 events — show timeline
- 2026-04-18 Pending — BRIGHT MLS
- 2026-04-14 Listed $225,000 BRIGHT MLS
- 2018-08-29 Sold (Public Records) $130,000 Public Records
- 2018-08-17 Sold (MLS) $130,000 BRIGHT MLS
- 2018-08-17 Sold (MLS) $130,000 MRIS
- 2018-07-19 Pending — BRIGHT MLS
- 2018-07-09 Contingent — BRIGHT MLS
- 2018-07-09 Pending — MRIS
- 2018-07-06 Listed $125,000 BRIGHT MLS
- 2018-07-06 Listed $125,000 MRIS
Property tax history
+4.1%/yrLatest (2025): $2,853 · +2.8% YoY. Source: county tax records.
Cash-flow waterfall
monthlySold comps — $/sqft
last 12 mo · ≤1 miLoading sold comps…