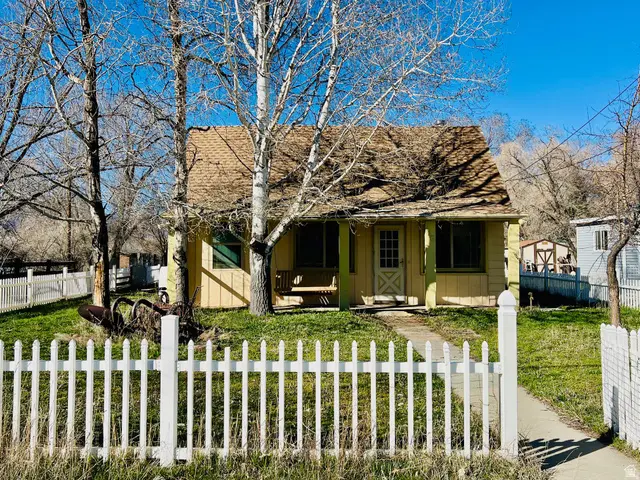
446 W 200 S · Heber, UT
Flood risk 1/10 · Minimal
- FEMA flood zone
- X (shaded)
- Chance of flooding over 30 yrs
- 0.0%
- Est. flood insurance / yr
- $507 – $1,088
Fire risk 6/10 · Moderate
- Est. fire insurance / yr
- $453 – $841
Heat risk 3/10 · Minor
- Hot days now (above 90°F)
- 7 days/yr
- Hot days in 30 yrs
- 21 days/yr
Wind risk 1/10 · Minimal
- Chance of severe wind over 30 yrs
- —
Air-quality risk 3/10 · Minor
- Unhealthy air days now
- 2 days/yr
- Unhealthy air days in 30 yrs
- 3 days/yr
Risk factors via First Street. Map © Google.
Why this score? — see what drove the D grade
The composite is a weighted blend of 9 inputs, each scored 0–100. Each bar is that input's sub-score; the figure is the points it added to the 100-point composite (weight × sub-score).
- Cash flow +15.1/30.0
- ARV discount +7.5/15.0
- DSCR +4.6/10.0
- Schools +4.3/10.0
- Livability +3.7/5.0
- Rent growth +3.5/5.0
- 1% rule +3.2/10.0
- Condition / age +2.5/5.0
- Appreciation +0.0/10.0
$320,000
🖨 Deal sheet (PDF) 📄 Offer letter ✓ Due diligence
Listing remarks MLS
There are no remarks available.
Key facts
- 0.23 acre lot
- Built 1927
Neighborhood map
What this means for you Summary
Snapshot
- This is a 3-bed/2.0-bath single-family listed at $320k.
Deal economics
- At list price, monthly cash flow is $104 ($1k/yr) — positive.
- The deal already cash-flows at list — no discount required.
- To meet the 1% rule (rent ≥ 1% of price), the offer needs to be $261k (18.4% below list).
- Recommended offer: $261k (18.4% below list) — sets the bar for 1% rule.
- Cap rate 6.7% vs local median 1.0% in Heber — top-decile yield for the area; either an underpriced asset or a hidden risk that comps aren't pricing in. Stress-test before assuming the spread holds.
Location & tenants
- Location reads 74/100 on livability (#68 in UT, #4,763 nationally) — a middle-class / working-renter tenant base. Strengths: employment A+, housing A+, crime A-; Watch: amenities F, commute F, cost of living D-.
- Wasatch District (town): math 45% / reading 51% proficiency, ranked #23 of 80 in UT (top 29%) — families likely to look elsewhere, expect single-tenant / working-renter base with shorter leases.
- Zoned schools: Heber Valley School (math 18% / reading 30%, grade F, #488 of 585 statewide, top 84%, 598 students, 49% FRL); Rocky Mountain Middle (math 40% / reading 50%, grade D, #43 of 138 statewide, top 33%, 717 students, 26% FRL); Wasatch High (math 34% / reading 50%, grade F, #55 of 171 statewide, top 32%, 2,531 students, 16% FRL) — zoned schools at 30% FRL track the district average.
- Market conditions: Rents rising (+3.9%/yr); 1365 active listings in the ZIP; 9 comparable units currently listed for rent nearby; rentals at typical pace (median 21d on market — plan ~3-4 weeks tenant-placement turnaround); solid renter incomes; 835 units permitted in Wasatch County in 2024 (22 in 5+ unit buildings).
- This rent runs 30% of the median local income ($103k/yr) — at the standard rent-burdened threshold; future hikes will face affordability resistance.
Forward outlook
- Local home prices are declining (-3.0%/yr); year-one equity from $2k of loan paydown is wiped out by about $10k of value loss. Plan a longer hold.
- Wasatch County population projected at +87% by 2050 — long-run rental-demand tailwind backs the buy-and-hold thesis.
Negotiation context
- Only 0 days on market — expect competitive offers; lowballing is unlikely to land.
- 5 sale attempts since 33y ago with the ask held roughly flat each time — persistent listings suggest the price (not the market) is what's stuck; bring a comps-based counter.
Risks & watch-outs
- Watch-outs: built in 1927 — expect roof / HVAC / electrical / plumbing capex.
- Climate carrying-cost: major wildfire risk — expect insurance premiums to compound above CPI over the hold.
Questions for the listing agent
- Built in 1927 — when were the roof, HVAC, electrical panel, plumbing, and water heater last replaced?
- Is there a deadline driving the sale (1031 exchange, divorce, estate, relocation)? That informs how much negotiation room exists.
- The area grade is low — what's the realistic commute time and amenity access for the typical tenant pool here? Any planned neighborhood developments (good or bad) we should know about?
- What's the average days-on-market for RENTAL listings here right now (not sales)? A rising rental-DOM trend means longer vacancies and softer asking-rent achievability than the comps imply.
- What's the recent tenant-quality profile in this submarket — average credit score on applications, eviction rate, late-payment / NSF rate, and stable-employment percentage? A property-management company in the area should have these aggregated.
- How much new for-sale + rental construction is in the pipeline within 1–3 miles? Heavy new supply typically softens prices + rents 12–24 months out; constrained supply supports both.
Investment metrics
- 1% rule
- 0.82% ✗
- Cap rate
- 6.68%
- Cash-on-cash
- 1.39%
- DSCR
- 1.06
- GRM
- 10.2
CMA / ARV
No comps found within radius.
Projected returns pro-forma
-3.0% appreciation · 3.93% rent growth · sell at horizon
- IRR
- -13.2%
- Equity multiple
- 0.52×
- Total profit
- $-42,873
- Equity at exit
- $47,713
- IRR
- -3.0%
- Equity multiple
- 0.79×
- Total profit
- $-18,948
- Equity at exit
- $27,668
Cash invested: $89,600 (down + closing). Projections, not guarantees.
Landlord ↔ Tenant lean methodology
- Overall (STATE)
- 86 Strongly Landlord-Friendly
- State Utah
- 86 Strongly Landlord-Friendly · R+15
- County
- — inherits STATE
- City
- — inherits STATE
ZIP-level market 84032
- Rents YoY
- 3.9%
- Active inventory
- 1365
- Price-to-rent
- 10.2×
Monthly cashflow live
- Estimated rent
- $2,613 high interval (Pro) →
- Mortgage (P&I)
- −$1,678
- Tax from tax record
- −$148 /mo · $1,782/yr
- Insurance
- −$133
- HOA
- −$0
- Vacancy / Maint / Mgmt
- −$549
- Net cashflow
- $104
Break-even live
Sensitivity live
| Price | -10% $285 | -5% $195 | +0% $104 | +5% $14 | +10% $-77 |
|---|---|---|---|---|---|
| Rent | -10% $-102 | -5% $1 | +0% $104 | +5% $207 | +10% $310 |
| Rate | -1.0pp $265 | -0.5pp $185 | base $104 | +0.5pp $21 | +1.0pp $-63 |
UW: 25.0% down · 7.5% · 30yr · 1.5% tax · 5.0% vac · 8.0% maint · 8.0% mgmt
Financing live
Cash to close
- Down payment
- $80,000
- Closing costs
- $9,600
- Reserves months
- —
- Total cash needed
- —
Loan-product check · same deal, 3 products live
Conventional
25% down · 7.5% · 30yr
- Down + closing
- —
- Monthly P&I
- —
- Monthly cashflow
- —
- DSCR
- —
- Eligible?
- —
Personal DTI + credit; lowest rate.
DSCR
20% down · 8.5% · 30yr
- Down + closing
- —
- Monthly P&I
- —
- Monthly cashflow
- —
- DSCR
- —
- Eligible?
- —
No personal income docs; deal must DSCR.
Hard money
10% down · 12.0% · 12mo
- Down + closing
- —
- Monthly P&I
- —
- Monthly cashflow
- —
- DSCR
- —
- Eligible?
- —
Short-term bridge; refi at stabilization.
Rent comps 9 comps
| Address | Beds | Baths | Sqft | Rent | $/sqft | DOM | Units | Dist |
|---|---|---|---|---|---|---|---|---|
| 386 W 500 N Heber City, UT | 3.0 | 2.0 | 1763 | $2,700 | $1.53 | 16d | 1 | 0.66mi |
| 397 N 100 E Unit 1 Heber City, UT | 3.0 | 2.0 | 1500 | $2,400 | $1.60 | 21d | 1 | 0.72mi |
| 1448 W 1200 S Heber City, UT | 4.0 | 2.0 | 1569 | $2,695 | $1.72 | 25d | 1 | 1.21mi |
| 105 E Turner Mill Rd Heber City, UT | 1.0–3.0 | 1.0–2.0 | 935 | $2,739 | $2.93 | 4d | 62 | 1.26mi |
| 1128 S 820 E #1202 Heber City, UT | 3.0 | 2.0 | 1200 | $1,950 | $1.62 | 13d | 1 | 1.26mi |
| 144 E Turner Mill Rd Heber City, UT | 1.0–3.0 | 1.0–2.5 | 988 | $3,230 | $3.27 | 15d | 51 | 1.35mi |
| 998 S 960 E Unit Downstairs Heber City, UT | 2.0 | 1.0 | 1298 | $1,500 | $1.16 | 25d | 1 | 1.36mi |
| 1266 S Sawmill Blvd Heber City, UT | 3.0 | 2.0 | 1406 | $2,450 | $1.74 | 25d | 1 | 1.44mi |
| 1322 S Sawmill Blvd #508 Heber City, UT | 3.0 | 2.0 | 1406 | $2,450 | $1.74 | 25d | 1 | 1.48mi |
Listing history 12 events
-
2026-05-18historical
-
2026-05-11$320,000
-
2026-05-11historical
-
2026-03-31$320,000 Active
-
2022-07-07soldstatus
-
2002-10-21soldstatus 31-char remark
Show marketing remark (31 chars)
There are no remarks available.
-
2002-10-18soldstatus
-
2002-09-21historical
-
2002-08-03$130,000
-
2002-08-01$130,000 31-char remark
Show marketing remark (31 chars)
There are no remarks available.
-
1994-03-31historical
-
1993-12-02
ⓘ Source: listings_history table (triggers on properties + properties_extension) + one-shot
backfill from property_details.listing_events for pre-trigger history.
Tax reassessment forecast UT · Resets to sale price
- Current annual tax
- $1,782 · $148/mo
- Projected year-2 tax
- $2,112 · $176/mo
- Expected delta
- +$330/yr (+$28/mo · 18.5%)
ⓘ Screening estimate from a state-policy table — verify with the county assessor before closing.
Climate risk First Street
- Flood 1/10 Low FEMA zone X (shaded) · 0% chance over 30 yrs
- Wildfire 6/10 Major
- Heat 3/10 Moderate 7 d/yr ≥90°F today · 21 d/yr by 30 yrs out
- Wind 1/10 Low
- Air quality 3/10 Moderate 2 unhealthy d/yr today · 3 by 30 yrs out
Nearby sold comps map
Loading sold comps map…
Walkable amenities ~0.75 mi
Loading nearby amenities…
Taxation est. · year 1
- Rental income
- $31,352
- − Mortgage interest
- −$17,925
- − Property taxes
- −$1,782
- − Insurance
- −$1,600
- − Repairs & maintenance
- −$2,508
- − Management
- −$2,508
- − Depreciation
- −$9,309
- Taxable loss
- −$4,280
- Est. tax savings @ 24.0%
- +$1,027
- After-tax cash flow
- $2,276/yr
For passive investors: Depreciation is non-cash, so a rental often shows a tax loss while cash-flowing — sheltering income. Rental losses are passive: they offset passive income freely, and up to $25,000/yr can offset ordinary (W-2) income if you actively participate and your MAGI is under $100k (phasing out to $0 by $150k); unused losses carry forward. On sale, claimed depreciation is recaptured at up to 25%, and gains may owe capital-gains tax (a 1031 exchange can defer both). Figures are a year-1 estimate at your 24.0% rate — not tax advice; consult a CPA.
Schools (NCES district)
- District
- Wasatch District
- NCES district ID
- 4901110
- Math proficiency
- 45% ▼ -2.00%
- Reading proficiency
- 51% ▼ -1.00%
- Median HH income
- $67,315
- Composite
- 42.77/100
- National rank
- #3154
- State rank
- #23 of 80 in UT
Livability — Heber
- Score
- 74/100
- State rank
- #68
- US rank
- #4763
Category grades
Schools grade is shown separately in the Schools card above.
Census & demographics
- Census place
- Heber, UT
- County
- Wasatch County · 42,185 people
- Metro
- Heber, UT
- Population (ZIP)
- 26,111
- Household income
- $103,440
- Rent vs Own
- Severe rent burden
- 358.0
Population outlook (Wasatch County) Hauer SSP2
- Today (2025)
- 42,214 people
- By 2030
- 49,113 · +16.3%
- By 2040
- 63,675 · +50.8%
- By 2050
- 78,879 · +86.9%
- By 2075
- 116,912 · +177.0%
- By 2100
- 147,290 · +248.9%
Race, ethnicity, and origin ACS 2023
- Neighborhood character
- Predominantly White (79%)
- Race & ethnicity
- White 79% Hispanic / Latino 16% Two or more races 8% Asian 2%
- Hispanic origin (detail)
- Mexican 13% Puerto Rican 1%
- Common ancestry
- Slovak 5% Portuguese 5% Italian 3%
- Foreign-born
- 9% · Canada, Jamaica
- Languages at home
- 82% English-only · Spanish 13% Other Indo-European 2% Tagalog/Filipino 1%
Political lean MEDSL · Wasatch
- 2024 margin
- Strong R (+27.4) · D 35.2% · R 62.6% · Other 2.2%
- 2008→2024 swing
- +2.3pp toward D · 2008: -29.8pp · 2024: -27.4pp
- All cycles
- 2024: R+27.4 2020: R+26.2 2016: R+25.2 2012: R+52.2 2008: R+29.8
Not yet ingested
- Civics
- —
Market trends
- HPI YoY
- ▼ -262.10%
- Current HPI
- 298.4537
- Rent YoY
- ▲ 3.93%
- Metro
- Heber, UT
- State GDP YoY
- ▲ 3.54%
- F500 in state
- 2
Industry mix (Fortune 500 HQ in UT)
| Industry | F500 HQs | Revenue |
|---|---|---|
| Financial Services | 1 | $3B |
|
||
Price history
+146.2% since first listed12 events — show timeline
- 2026-05-18 Listing Removed — WFRMLS
- 2026-05-11 Listed $320,000 WFRMLS
- 2026-05-11 Listing Removed — WFRMLS
- 2026-03-31 Listed $320,000 WFRMLS
- 2022-07-07 Sold (Public Records) — Public Records
- 2002-10-21 Sold (MLS) — WFRMLS
- 2002-10-18 Sold (MLS) — PCMLS
- 2002-09-21 Delisted — PCMLS
- 2002-08-03 Listed $130,000 PCMLS
- 2002-08-01 Listed $130,000 WFRMLS
- 1994-03-31 Delisted — PCMLS
- 1993-12-02 Listed — PCMLS
Property tax history
+7.5%/yrLatest (2025): $1,782 · -12.7% YoY. Source: county tax records.
Cash-flow waterfall
monthlySold comps — $/sqft
last 12 mo · ≤1 miLoading sold comps…