 8-Plex
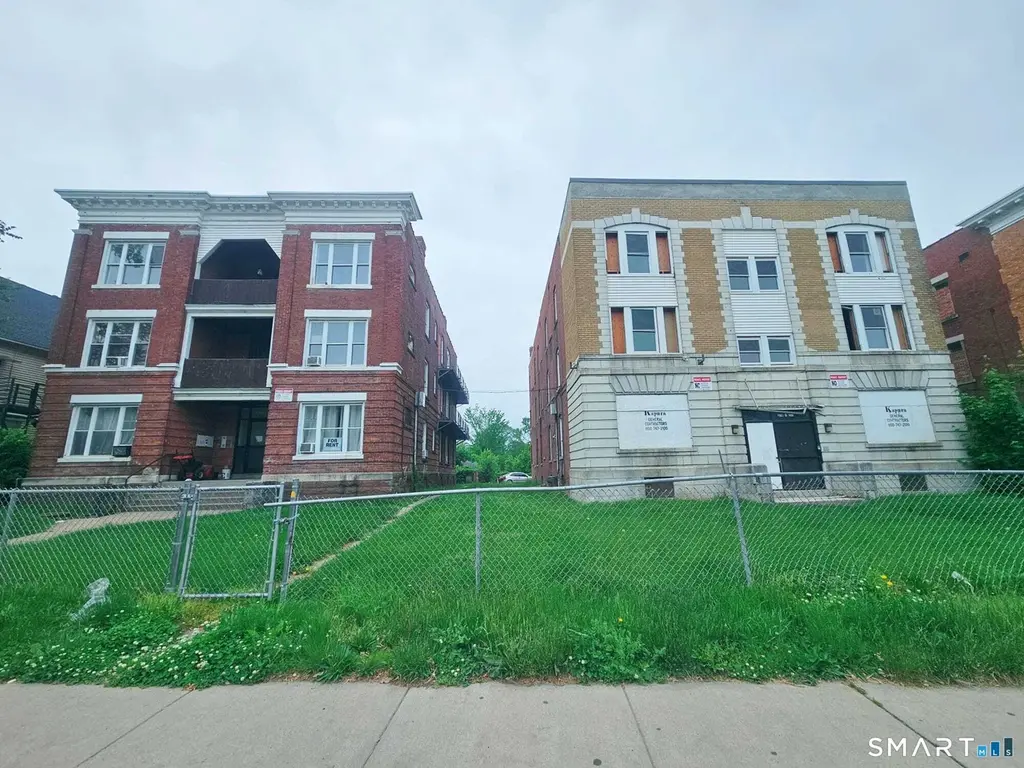
277-281-283 WETHERSFIELD Ave · Hartford, CT
Flood risk 1/10 · Minimal
- FEMA flood zone
- X (unshaded)
- Chance of flooding over 30 yrs
- 0.0%
- Est. flood insurance / yr
- $473 – $860
Fire risk 1/10 · Minimal
- Est. fire insurance / yr
- $829 – $1,539
Heat risk 5/10 · Moderate
- Hot days now (above 97°F)
- 7 days/yr
- Hot days in 30 yrs
- 16 days/yr
Wind risk 6/10 · Moderate
- Chance of severe wind over 30 yrs
- 27.0%
Air-quality risk 3/10 · Minor
- Unhealthy air days now
- 3 days/yr
- Unhealthy air days in 30 yrs
- 4 days/yr
Risk factors via First Street. Map © Google.
Why this score? — see what drove the B+ grade
The composite is a weighted blend of 9 inputs, each scored 0–100. Each bar is that input's sub-score; the figure is the points it added to the 100-point composite (weight × sub-score).
- Cash flow +29.6/30.0
- DSCR +10.0/10.0
- Appreciation +10.0/10.0
- 1% rule +8.8/10.0
- ARV discount +7.5/15.0
- Livability +3.8/5.0
- Rent growth +2.9/5.0
- Condition / age +2.5/5.0
- Schools +1.4/10.0
$1,200,000
🖨 Deal sheet 📄 Offer letter ✓ Due diligence
Multi-family units
County records classify this as Multi-Family (5+ Unit). Listing-text estimate: 8 units. confirmed
5+ unit building — per-unit beds/baths from public records are typically unavailable; the breakdown below (if shown) is an estimate from the listing text.
Listing remarks MLS
2 buildings total of 13 units net income of 87000, Also listed as MLS#G10166453
Key facts
- High income property
- Two buildings
- Fully rented
Tags
Property features AI
Exterior
- Parking: Parking lot; 12 parking spaces
- Utilities: Public water connected; Public sewer connected
- Home design: Multi-family property (5+ units)
- Construction: Brick construction; Brick foundation
- Exterior features: Level lot; Brick exterior siding; Flat roof
Interior
- Bedrooms: 24 total bedrooms
- Bathrooms: 6 full bathrooms
- Heating & cooling: Baseboard heating; Natural gas heat fuel; Electric 30-gallon hot water tank
- Interior features: Full basement
Neighborhood map
What this means for you Summary
Snapshot
- This is a 8 × 3-bed/?-bath units multifamily listed at $1.20M.
Deal economics
- At list price, monthly cash flow is $4k ($52k/yr) — positive. Per door: $540/mo.
- The deal already cash-flows at list — no discount required.
- Meets the 1% rule at list price ($17k rent vs $1.20M).
- Recommended offer: $1.18M (1.5% below list) — sets the bar for market timing.
Location & tenants
- Location reads 76/100 on livability (#58 in CT, #3,553 nationally) — a middle-class / working-renter tenant base. Strengths: amenities A+, commute A+, health & safety A+; Watch: schools D-, crime F, employment F.
- Hartford School District (urban): math 13% / reading 21% proficiency, ranked #150 of 153 in CT (top 98%) — low school quality limits family demand, transient renter base, plan for 1-2y turnover; 84% free/reduced lunch — lower-income household profile, screen leases tightly.
- Market conditions: Rents rising (+1.5%/yr); 54 active listings in the ZIP; 1,867 units permitted in Capitol Planning Region in 2024 (1,399 in 5+ unit buildings).
- At $16,602/mo this rent would consume 382% of the median local household income ($52k/yr) (locally 1897% of renters already pay >50% of income on rent) — very limited rent-growth headroom before tenants either downsize or default.
Forward outlook
- In year one you build about $128k of equity ($8k loan paydown + $120k appreciation (10.0% local appreciation)).
- At projected returns (10.0% appreciation + 1.5% rent growth), your $336k cash investment doubles in ~2 years — after that, you're playing with house money.
- By year 2, paydown + projected appreciation supports a ~$206k cash-out refi (75% LTV) — recoverable capital for the next deal without selling this one.
Negotiation context
- It's been on market 28 days — a 2% lower offer ($1.18M) is reasonable based on typical stale-listing flexibility.
- 9 sale attempts since 20y ago with the ask held roughly flat each time — persistent listings suggest the price (not the market) is what's stuck; bring a comps-based counter.
- Current owner paid $720k; list at $1.20M implies a 67% gain — meaningful room to come down on a strong offer.
Risks & watch-outs
- Watch-outs: built in 1900 — expect roof / HVAC / electrical / plumbing capex.
- Climate carrying-cost: major wind risk, 27% chance of damaging wind over 30y; extreme-heat days projected 7→16/yr by 2055 (HVAC capex compounding) — expect insurance premiums to compound above CPI over the hold.
Questions for the listing agent
- Can we see the unit-by-unit rent roll, current vacancy, and any below-market leases? What's the average tenancy length?
- What capital expenditures (roof, boiler, parking lot, exteriors) have been made in the last 5 years, and what's planned in the next 2?
- Built in 1900 — when were the roof, HVAC, electrical panel, plumbing, and water heater last replaced?
- Is there a deadline driving the sale (1031 exchange, divorce, estate, relocation)? That informs how much negotiation room exists.
- Schools are D-rated, which usually means shorter tenancies and higher turnover. Who's the typical renter profile here, and what's been the actual vacancy rate?
- Crime grade is F in this area — have there been break-ins, vandalism, or insurance claims at this property in the last 3 years? What carrier currently insures it and at what premium?
- What's the average days-on-market for RENTAL listings here right now (not sales)? A rising rental-DOM trend means longer vacancies and softer asking-rent achievability than the comps imply.
- What's the recent tenant-quality profile in this submarket — average credit score on applications, eviction rate, late-payment / NSF rate, and stable-employment percentage? A property-management company in the area should have these aggregated.
- How much new apartment / multifamily construction is in the pipeline within 1–3 miles? Heavy new supply (>2% of stock underway) typically softens rents 12–24 months out; light construction supports rent growth.
Investment metrics
- 1% rule
- 1.38% ✓
- Cap rate
- 10.62%
- Cash-on-cash
- 15.44%
- DSCR
- 1.69
- GRM
- 6.0
CMA / ARV
No comps found within radius.
Projected returns pro-forma
10.0% appreciation · 1.47% rent growth · sell at horizon
- IRR
- 34.9%
- Equity multiple
- 3.69×
- Total profit
- $904,262
- Equity at exit
- $1,081,055
- IRR
- 29.6%
- Equity multiple
- 8.14×
- Total profit
- $2,399,536
- Equity at exit
- $2,331,336
Cash invested: $336,000 (down + closing). Projections, not guarantees.
Landlord ↔ Tenant lean methodology
- Overall (STATE)
- 27 Tenant-Leaning
- State Connecticut
- 27 Tenant-Leaning · D+7
- County
- — inherits STATE
- City
- — inherits STATE
ZIP-level market 06114
- Home prices YoY
- 4.7%
- Rents YoY
- 1.5%
- Active inventory
- 54
- Price-to-rent
- 48.2×
Monthly cashflow live
- Estimated rent
- $16,602 high interval (Pro) →
- Mortgage (P&I)
- −$6,293
- Tax from tax record
- −$2,000 /mo · $23,997/yr
- Insurance
- −$500
- HOA
- −$0
- Vacancy / Maint / Mgmt
- −$3,486
- Net cashflow
- $4,323
Break-even live
8-unit breakdown (identical units grouped — click to expand)
| Units | Beds | Baths | Est. rent |
|---|---|---|---|
| 8× units | 3 | — | $16,600 |
| #1 | 3 | — | $2,075 |
| #2 | 3 | — | $2,075 |
| #3 | 3 | — | $2,075 |
| #4 | 3 | — | $2,075 |
| #5 | 3 | — | $2,075 |
| #6 | 3 | — | $2,075 |
| #7 | 3 | — | $2,075 |
| #8 | 3 | — | $2,075 |
| Total (8 units) | $16,602 | ||
UW: 25.0% down · 7.5% · 30yr · 1.5% tax · 5.0% vac · 8.0% maint · 8.0% mgmt
Financing live
Cash to close
- Down payment
- $300,000
- Closing costs
- $36,000
- Reserves months
- —
- Total cash needed
- —
Loan-product check · same deal, 3 products live
Conventional
25% down · 7.5% · 30yr
- Down + closing
- —
- Monthly P&I
- —
- Monthly cashflow
- —
- DSCR
- —
- Eligible?
- —
Personal DTI + credit; lowest rate.
DSCR
20% down · 8.5% · 30yr
- Down + closing
- —
- Monthly P&I
- —
- Monthly cashflow
- —
- DSCR
- —
- Eligible?
- —
No personal income docs; deal must DSCR.
Hard money
10% down · 12.0% · 12mo
- Down + closing
- —
- Monthly P&I
- —
- Monthly cashflow
- —
- DSCR
- —
- Eligible?
- —
Short-term bridge; refi at stabilization.
Listing history 39 events
-
2026-06-18days on market $1,200,000 Active 28 DOM
-
2026-06-17days on market $1,200,000 Active 27 DOM
-
2026-06-16days on market $1,200,000 Active 26 DOM
-
2026-06-15days on market $1,200,000 Active 25 DOM
-
2026-06-13days on market $1,200,000 Active 23 DOM
-
2026-06-13days on market $1,200,000 Active 22 DOM
-
2026-06-10days on market $1,200,000 Active 20 DOM
-
2026-06-09days on market $1,200,000 Active 19 DOM
-
2026-06-08days on market $1,200,000 Active 18 DOM
-
2026-06-07days on market $1,200,000 Active 17 DOM
-
2026-06-05days on market $1,200,000 Active 14 DOM
-
2026-06-03days on market $1,200,000 Active 13 DOM
-
2026-06-02days on market $1,200,000 Active 12 DOM
-
2026-06-01days on market $1,200,000 Active 11 DOM
-
2026-05-31days on market $1,200,000 Active 10 DOM
-
2026-05-21$1,200,000 Active
-
2019-09-20soldstatus $720,000 Closed 79-char remark
Show marketing remark (79 chars)
2 buildings total of 13 units net income of 87000, Also listed as MLS#G10166453
-
2018-05-31historical 79-char remark
Show marketing remark (79 chars)
2 buildings total of 13 units net income of 87000, Also listed as MLS#G10166453
-
2016-11-30historical 79-char remark
Show marketing remark (79 chars)
2 buildings total of 13 units net income of 87000, Also listed as MLS#G10166453
-
2016-09-07$750,000 79-char remark
Show marketing remark (79 chars)
2 buildings total of 13 units net income of 87000, Also listed as MLS#G10166453
-
2014-04-28historical
-
2013-08-27$420,000
-
2013-04-19historical
-
2012-10-22$475,000
-
2012-09-28historical
-
2012-06-06$950,000
-
2009-06-12historical
-
2008-07-30historical
-
2008-02-02$590,000
-
2008-02-02$590,000
-
2007-10-29historical
-
2007-04-30$480,000
-
2007-03-13historical
-
2006-09-20$560,000
-
2003-12-30soldstatus $680,240
-
1993-06-01soldstatus $142,800
-
1989-06-14soldstatus $820,000
-
1989-06-14soldstatus $820,000
-
1989-06-01soldstatus $820,000
ⓘ Source: listings_history table (triggers on properties + properties_extension) + one-shot
backfill from property_details.listing_events for pre-trigger history.
Tax reassessment forecast CT · Partial reset (capped growth)
- Current annual tax
- $23,997 · $2,000/mo
- Projected year-2 tax
- $24,838 · $2,070/mo
- Expected delta
- +$842/yr (+$70/mo · 3.5%)
ⓘ Screening estimate from a state-policy table — verify with the county assessor before closing.
Climate risk First Street
- Flood 1/10 Low FEMA zone X (unshaded) · 0% chance over 30 yrs
- Wildfire 1/10 Low
- Heat 5/10 Major 7 d/yr ≥97°F today · 16 d/yr by 30 yrs out
- Wind 6/10 Major 27% chance of damaging wind over 30 yrs
- Air quality 3/10 Moderate 3 unhealthy d/yr today · 4 by 30 yrs out
Nearby sold comps map
Loading sold comps map…
Walkable amenities ~0.75 mi
Loading nearby amenities…
Taxation est. · year 1
- Rental income
- $199,224
- − Mortgage interest
- −$67,219
- − Property taxes
- −$23,997
- − Insurance
- −$6,000
- − Repairs & maintenance
- −$15,938
- − Management
- −$15,938
- − Depreciation
- −$34,909
- Taxable income
- $35,223
- Est. tax owed @ 24.0%
- −$8,454
- After-tax cash flow
- $43,421/yr
For passive investors: Depreciation is non-cash, so a rental often shows a tax loss while cash-flowing — sheltering income. Rental losses are passive: they offset passive income freely, and up to $25,000/yr can offset ordinary (W-2) income if you actively participate and your MAGI is under $100k (phasing out to $0 by $150k); unused losses carry forward. On sale, claimed depreciation is recaptured at up to 25%, and gains may owe capital-gains tax (a 1031 exchange can defer both). Figures are a year-1 estimate at your 24.0% rate — not tax advice; consult a CPA.
Schools (NCES district)
- District
- Hartford School District
- NCES district ID
- 0901920
- Math proficiency
- 13% ▼ -5.00%
- Reading proficiency
- 21% ▼ -6.00%
- Median HH income
- $30,521
- Composite
- 13.54/100
- National rank
- #9514
- State rank
- #150 of 153 in CT
Livability — Hartford
- Score
- 76/100
- State rank
- #58
- US rank
- #3553
Category grades
Schools grade is shown separately in the Schools card above.
Census & demographics
- Census place
- Hartford, CT
- County
- Hartford County · 754,208 people
- City population
- 121,162
- Metro
- Hartford-East Hartford-Middletown, CT
- Population (ZIP)
- 26,458
- Household income
- $52,110
- Rent vs Own
- Severe rent burden
- 1897.0
Population outlook (Capitol County) Hauer SSP2
- By 2040
- 1,063,519
Race, ethnicity, and origin ACS 2023
- Neighborhood character
- Diverse neighborhood (Simpson 0.57)
- Race & ethnicity
- Hispanic / Latino 60% White 19% Black 19% Two or more races 10% Native American 1%
- Hispanic origin (detail)
- Mexican 4% Puerto Rican 36% Dominican 6%
- Common ancestry
- American 6% Romanian 1% Lithuanian 1%
- Foreign-born
- 31% · Canada, Jamaica
- Languages at home
- 36% English-only · Spanish 49% Russian/Polish/Slavic 8% Other Indo-European 4%
Political lean MEDSL · Capitol
- 2024 margin
- Strong D (+21.9) · D 60.1% · R 38.2% · Other 1.7%
- All cycles
- 2024: D+21.9
Not yet ingested
- Civics
- —
Market trends
- HPI YoY
- ▲ 16.02%
- Current HPI
- 356.5892
- Rent YoY
- ▲ 1.47%
- Metro
- Hartford-East Hartford-Middletown, CT
- State GDP YoY
- ▲ 1.06%
- F500 in state
- 38
Industry mix (Fortune 500 HQ in CT)
| Industry | F500 HQs | Revenue |
|---|---|---|
| Industrial Machinery | 4 | $38B |
|
||
| Insurance | 3 | $71B |
|
||
| Financial Services | 2 | $25B |
|
||
| Transportation / Logistics | 2 | $18B |
|
||
| Healthcare | 1 | $247B |
|
||
| Telecommunications | 1 | $55B |
|
||
Price history
+46.3% since first listed24 events — show timeline
- 2026-05-21 Listed $1,200,000 Smart MLS
- 2019-09-20 Sold (MLS) $720,000 Smart MLS
- 2018-05-31 Listing Removed — Smart MLS
- 2016-11-30 Listing Removed — Smart MLS
- 2016-09-07 Listed $750,000 Smart MLS
- 2014-04-28 Listing Removed — Smart MLS
- 2013-08-27 Listed $420,000 Smart MLS
- 2013-04-19 Listing Removed — Smart MLS
- 2012-10-22 Listed $475,000 Smart MLS
- 2012-09-28 Listing Removed — Smart MLS
- 2012-06-06 Listed $950,000 Smart MLS
- 2009-06-12 Listing Removed — Smart MLS
- 2008-07-30 Listing Removed — Smart MLS
- 2008-02-02 Listed $590,000 Smart MLS
- 2008-02-02 Listed $590,000 Smart MLS
- 2007-10-29 Listing Removed — Smart MLS
- 2007-04-30 Listed $480,000 Smart MLS
- 2007-03-13 Listing Removed — Smart MLS
- 2006-09-20 Listed $560,000 Smart MLS
- 2003-12-30 Sold (Public Records) $680,240 Public Records
- 1993-06-01 Sold (Public Records) $142,800 Public Records
- 1989-06-14 Sold (Public Records) $820,000 Public Records
- 1989-06-14 Sold (Public Records) $820,000 Public Records
- 1989-06-01 Sold (Public Records) $820,000 Public Records
Property tax history
+4.3%/yrLatest (2025): $23,997 · +0.0% YoY. Source: county tax records.
Cash-flow waterfall
monthlySold comps — $/sqft
last 12 mo · ≤1 miLoading sold comps…