None · Portsmouth, VA
Flood risk 6/10 · Moderate
- FEMA flood zone
- X (shaded)
- Chance of flooding over 30 yrs
- 0.55%
- Est. flood insurance / yr
- $507 – $1,088
Fire risk 1/10 · Minimal
- Est. fire insurance / yr
- $666 – $1,236
Heat risk 9/10 · Severe
- Hot days now (above 106°F)
- 7 days/yr
- Hot days in 30 yrs
- 16 days/yr
Wind risk 8/10 · Major
- Chance of severe wind over 30 yrs
- 80.0%
Air-quality risk 2/10 · Minimal
- Unhealthy air days now
- 2 days/yr
- Unhealthy air days in 30 yrs
- 2 days/yr
Risk factors via First Street. Map © Google.
Why this score? — see what drove the C grade
The composite is a weighted blend of 9 inputs, each scored 0–100. Each bar is that input's sub-score; the figure is the points it added to the 100-point composite (weight × sub-score).
- Cash flow +18.2/30.0
- ARV discount +15.0/15.0
- DSCR +5.7/10.0
- 1% rule +4.8/10.0
- Schools +3.9/10.0
- Livability +3.7/5.0
- Rent growth +2.5/5.0
- Condition / age +2.5/5.0
- Appreciation +0.0/10.0
$164,900
🖨 Deal sheet 📄 Offer letter ✓ Due diligence
Listing remarks
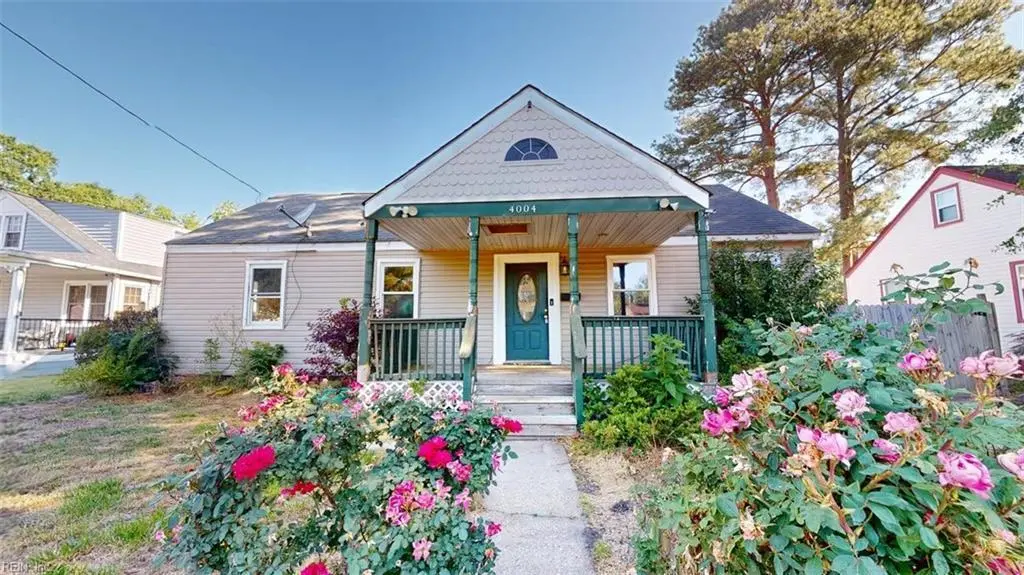
This ranch-style home in Portsmouth's historic Cradock neighborhood is your next project. Sitting on a 60x108 lot with 1,032 sq ft and a detached 600 sq ft garage, this property has great bones and unlimited potential. Sold strictly as-is — seller will make no repairs. Bring your vision and your tools. Priced to sell! Make sure to ask about the 3D True Immersive Virtual Tour. This technology allows you to literally experience the home on any mobile device, laptop or desktop. You can measure rooms, view 3D dollhouse, view exterior, and interior and so much more. Check it out today!
Key facts
- 6,534 sq ft lot
- Garage
- Built 1952
Property features AI
Finance
- HOA & community: No HOA fees
Exterior
- Parking: Driveway and street parking; Detached garage (approximately 600 sq ft)
- Utilities: City/County water; City/County sewer; Electric water heater
- Home design: Detached ranch; Single-story home (1 living level); Crawl space foundation
- Construction: Asphalt shingle roof
- Exterior features: Vinyl siding; Back yard fenced
Interior
- Kitchen: Electric range
- Bedrooms: First-floor bedroom with full bathroom (first floor master bedroom noted)
- Flooring: Carpet; Laminate
- Bathrooms: 1 full bathroom
- Heating & cooling: Heat pump with central air; Electric forced hot air heating
- Interior features: Carpet and laminate flooring; Attic; Breakfast area; Porch; Utility room
- Laundry & utility: Washer hookup; Dryer hookup
Neighborhood map
What this means for you Summary
Snapshot
- This is a 3-bed/1.0-bath single-family listed at $165k.
Deal economics
- At list price, monthly cash flow is $146 ($2k/yr) — positive.
- The deal already cash-flows at list — no discount required.
- To meet the 1% rule (rent ≥ 1% of price), the offer needs to be $162k (2.1% below list).
- Recommended offer: $160k (3.0% below list) — sets the bar for market timing.
- Cap rate 7.4% vs local median 4.6% in Portsmouth — top-decile yield for the area; either an underpriced asset or a hidden risk that comps aren't pricing in. Stress-test before assuming the spread holds.
Location & tenants
- Location reads 73/100 on livability (#172 in VA) — a middle-class / working-renter tenant base. Strengths: amenities A+, cost of living A+, housing A+; Watch: employment C-, crime F, commute F.
- Portsmouth City Public School District (urban): math 34% / reading 58% proficiency, ranked #107 of 131 in VA (top 82%) — families likely to look elsewhere, expect single-tenant / working-renter base with shorter leases.
- Zoned schools: I.C. Norcom High (math 39% / reading 58%, grade D, #301 of 319 statewide, top 95%, 1,043 students, 100% FRL) — zoned schools average 100% FRL vs 60% district-wide (40 pts higher); higher-poverty schools than district average — tighter screening recommended.
- Market conditions: 84 active listings in the ZIP; 24 comparable units currently listed for rent nearby; rentals at typical pace (median 17d on market — plan ~3-4 weeks tenant-placement turnaround); 300 units permitted in Portsmouth city in 2024 (112 in 5+ unit buildings).
- This rent runs 40% of the median local income ($49k/yr) — at the standard rent-burdened threshold; future hikes will face affordability resistance.
Forward outlook
- Local home prices are declining (-3.0%/yr); year-one equity from $1k of loan paydown is wiped out by about $5k of value loss. Plan a longer hold.
Negotiation context
- It's been on market 34 days — a 3% lower offer ($160k) is reasonable based on typical stale-listing flexibility.
- 2 sale attempts with the ask held roughly flat each time — persistent listings suggest the price (not the market) is what's stuck; bring a comps-based counter.
- Current owner paid $120k; 37% above their basis — modest negotiation headroom, anchor on the comps not their cost.
Risks & watch-outs
- Watch-outs: built in 1952 — expect roof / HVAC / electrical / plumbing capex.
- Climate carrying-cost: major flood risk; severe wind risk, 80% chance of damaging wind over 30y; extreme-heat days projected 7→16/yr by 2055 (HVAC capex compounding) — expect insurance premiums to compound above CPI over the hold.
Questions for the listing agent
- It's been on market 34 days. Have you received any prior offers? Is the seller open to a 3% concession, seller financing, or rate buy-down credit?
- Built in 1952 — when were the roof, HVAC, electrical panel, plumbing, and water heater last replaced?
- Is there a deadline driving the sale (1031 exchange, divorce, estate, relocation)? That informs how much negotiation room exists.
- Schools are B-rated — typically a magnet for longer-tenancy family renters. What's the average tenant stay here, and is there a school-zone premium baked into asking?
- Crime grade is F in this area — have there been break-ins, vandalism, or insurance claims at this property in the last 3 years? What carrier currently insures it and at what premium?
- What's the average days-on-market for RENTAL listings here right now (not sales)? A rising rental-DOM trend means longer vacancies and softer asking-rent achievability than the comps imply.
- What's the recent tenant-quality profile in this submarket — average credit score on applications, eviction rate, late-payment / NSF rate, and stable-employment percentage? A property-management company in the area should have these aggregated.
- How much new for-sale + rental construction is in the pipeline within 1–3 miles? Heavy new supply typically softens prices + rents 12–24 months out; constrained supply supports both.
Investment metrics
- 1% rule
- 0.98% ✗
- Cap rate
- 7.36%
- Cash-on-cash
- 3.81%
- DSCR
- 1.17
- GRM
- 8.5
CMA / ARV
- ARV (median comp)
- $239,553
- List price
- $164,900
- Delta
- -31.16%
- Verdict
- UNDERPRICED
- Comps
- 20 within 1.0 mi
Show comp detail 12 sales within ~0.75 mi
| Address | Dist | Beds/Ba | Sqft | Sold | Price | $/sf | Match |
|---|---|---|---|---|---|---|---|
| 3521 County St | 0.40mi | 3/1.0 | 1,020 (-1%) | 2mo | $227,000 | $223 | 78 |
| 4103 Scott St | 0.19mi | 3/1.0 | 960 (-7%) | 5mo | $240,000 | $250 | 75 |
| 3710 King St | 0.34mi | 2/1.0 (-1) | 1,010 (-2%) | 4mo | $182,500 | $181 | 72 |
| 4721 Bart St | 0.60mi | 2/1.0 (-1) | 1,026 (-1%) | 1mo | $155,000 | $151 | 65 |
| 4110 Scott St | 0.18mi | 3/2.0 | 1,150 (+11%) | 6mo | $289,900 | $252 | 63 |
| 3813 Race St | 0.19mi | 3/2.0 | 1,165 (+13%) | 3mo | $289,500 | $248 | 63 |
| 4509 South St | 0.43mi | 3/1.5 | 1,107 (+7%) | 7mo | $260,000 | $235 | 60 |
| 3210 Brighton St | 0.64mi | 4/1.0 (+1) | 1,005 (-3%) | 1mo | $211,000 | $210 | 60 |
| 3306 Brighton St | 0.60mi | 3/2.0 | 1,080 (+5%) | 1mo | $238,000 | $220 | 60 |
| 3420 Scott St | 0.46mi | 4/1.0 (+1) | 1,080 (+5%) | 8mo | $156,626 | $145 | 60 |
| 58 Harvard Rd | 0.70mi | 3/1.5 | 1,100 (+7%) | 0mo | $239,900 | $218 | 54 |
| 105 Bolling Rd | 0.66mi | 3/1.5 | 909 (-12%) | 3mo | $190,000 | $209 | 45 |
Match score weights: distance 35% · size 25% · config 20% · recency 20%. Top-matched comps best support the ARV.
Projected returns pro-forma
-3.0% appreciation · 3.0% rent growth · sell at horizon
- IRR
- -10.3%
- Equity multiple
- 0.62×
- Total profit
- $-17,376
- Equity at exit
- $24,587
- IRR
- -1.0%
- Equity multiple
- 0.93×
- Total profit
- $-3,046
- Equity at exit
- $14,258
Cash invested: $46,172 (down + closing). Projections, not guarantees.
Landlord ↔ Tenant lean methodology
- Overall (STATE)
- 55 Moderately Landlord-Leaning
- State Virginia
- 55 Moderately Landlord-Leaning · D+2
- County
- — inherits STATE
- City
- — inherits STATE
ZIP-level market 23707
- Home prices YoY
- -23.7%
- Active inventory
- 84
- Price-to-rent
- 8.5×
Monthly cashflow live
- Estimated rent
- $1,615 high interval (Pro) →
- Mortgage (P&I)
- −$865
- Tax from tax record
- −$196 /mo · $2,353/yr
- Insurance
- −$69
- HOA
- −$0
- Vacancy / Maint / Mgmt
- −$339
- Net cashflow
- $146
Break-even live
UW: 25.0% down · 7.5% · 30yr · 1.5% tax · 5.0% vac · 8.0% maint · 8.0% mgmt
Financing live
Cash to close
- Down payment
- $41,225
- Closing costs
- $4,947
- Reserves months
- —
- Total cash needed
- —
Loan-product check · same deal, 3 products live
Conventional
25% down · 7.5% · 30yr
- Down + closing
- —
- Monthly P&I
- —
- Monthly cashflow
- —
- DSCR
- —
- Eligible?
- —
Personal DTI + credit; lowest rate.
DSCR
20% down · 8.5% · 30yr
- Down + closing
- —
- Monthly P&I
- —
- Monthly cashflow
- —
- DSCR
- —
- Eligible?
- —
No personal income docs; deal must DSCR.
Hard money
10% down · 12.0% · 12mo
- Down + closing
- —
- Monthly P&I
- —
- Monthly cashflow
- —
- DSCR
- —
- Eligible?
- —
Short-term bridge; refi at stabilization.
Rent comps 24 comps
| Address | Beds | Baths | Sqft | Rent | $/sqft | DOM | Units | Dist |
|---|---|---|---|---|---|---|---|---|
| 3717 Scott St Portsmouth, VA | 3.0 | 1.0 | 1157 | $1,400 | $1.21 | 23d | 1 | 0.28mi |
| 3626 Bart St Unit BAR3626-DF Portsmouth, VA | 2.0 | 1.0 | 900 | $1,000 | $1.11 | 7d | 1 | 0.28mi |
| 3607 Bart St Portsmouth, VA | 3.0 | 2.0 | 1326 | $1,850 | $1.40 | 10d | 1 | 0.30mi |
| 3401 Brighton St Portsmouth, VA | 3.0 | 2.5 | 1439 | $2,195 | $1.53 | 3d | 1 | 0.57mi |
| 3310 Glasgow St Portsmouth, VA | 2.0 | 1.0 | 1100 | $1,600 | $1.45 | 3d | 1 | 0.71mi |
| 13 Hedge Ln Unit I Portsmouth, VA | 2.0 | 1.5 | 816 | $1,275 | $1.56 | 7d | 1 | 0.85mi |
| 124 Tyler Cres E Unit B Portsmouth, VA | 2.0 | 1.0 | 1000 | $1,195 | $1.20 | 23d | 1 | 0.91mi |
| 49 Carver Cir Portsmouth, VA | 2.0 | 2.0 | 800 | $1,450 | $1.81 | 23d | 1 | 1.14mi |
| 821 Mt Vernon Ave Unit A Portsmouth, VA | 2.0 | 1.0 | 1200 | $1,250 | $1.04 | 3d | 1 | 1.15mi |
| 1 Shelby St Portsmouth, VA | 2.0 | 1.0 | 700 | $1,250 | $1.79 | 23d | 1 | 1.15mi |
| 26 Byers Ave Portsmouth, VA | 2.0 | 1.0 | 1008 | $1,575 | $1.56 | 43d | 1 | 1.21mi |
| 3304 Killian Ave Portsmouth, VA | 3.0 | 1.0 | 800 | $2,000 | $2.50 | 23d | 1 | 1.25mi |
| 804 City Park Ave Portsmouth, VA | 2.0 | 1.0 | 1228 | $1,800 | $1.47 | 43d | 1 | 1.25mi |
| 647 Mount Vernon Ave Unit B Portsmouth, VA | 2.0 | 1.0 | 900 | $1,650 | $1.83 | 7d | 1 | 1.28mi |
| 3317 Downes St Portsmouth, VA | 3.0 | 2.0 | 1148 | $1,995 | $1.74 | 10d | 1 | 1.34mi |
| 3317 Downes St Portsmouth, VA | 3.0 | 2.0 | 1148 | $1,995 | $1.74 | 3d | 1 | 1.34mi |
| 6 Harrower Ct Portsmouth, VA | 2.0 | 2.0 | 800 | $1,550 | $1.94 | 43d | 1 | 1.35mi |
| 509 Mount Vernon Ave Portsmouth, VA | 3.0 | 1.5 | 1125 | $1,250 | $1.11 | 21d | 1 | 1.42mi |
| 318 Edgewood Rd Portsmouth, VA | 3.0 | 1.0 | 1421 | $2,300 | $1.62 | 43d | 1 | 1.42mi |
| 2715 Portsmouth Blvd Portsmouth, VA | 2.0 | 1.0 | 1428 | $1,425 | $1.00 | 17d | 1 | 1.43mi |
| 2715 Portsmouth Blvd Portsmouth, VA | 2.0 | 1.0 | 1428 | $1,425 | $1.00 | 14d | 1 | 1.43mi |
| 816 Martin Ave Portsmouth, VA | 3.0 | 1.0 | 1100 | $2,195 | $2.00 | 3d | 1 | 1.44mi |
| 200 Chowan Dr Portsmouth, VA | 1.0–2.0 | 1.0–2.0 | 737 | $1,600 | $2.17 | 2d | 8 | 1.47mi |
| 70 Manly St Portsmouth, VA | 2.0 | 1.0 | 1000 | $1,350 | $1.35 | 43d | 1 | 1.48mi |
Listing history 14 events
-
2026-06-18status $164,900 Under Contract 34 DOM
-
2026-06-17days on market $164,900 Active Under Contract 34 DOM
-
2026-06-16days on market $164,900 Active Under Contract 33 DOM
-
2026-06-15days on market $164,900 Active Under Contract 32 DOM
-
2026-06-13days on market $164,900 Active Under Contract 30 DOM
-
2026-06-09statusdays on market $164,900 Active Under Contract 26 DOM
-
2026-06-08days on market $164,900 Active 25 DOM
-
2026-06-07days on market $164,900 Active 24 DOM
-
2026-06-03days on market $164,900 Active 20 DOM
-
2026-06-02days on market $164,900 Active 19 DOM
-
2026-06-01days on market $164,900 Active 18 DOM
-
2026-05-31days on market $164,900 Active 17 DOM
-
2026-05-12$164,900 Active 593-char remark
-
2007-03-26soldstatus $120,000
ⓘ Source: listings_history table (triggers on properties + properties_extension) + one-shot
backfill from property_details.listing_events for pre-trigger history.
Tax reassessment forecast VA · Resets to sale price
- Current annual tax
- $2,353 · $196/mo
- Projected year-2 tax
- $2,353 · $196/mo
- Expected delta
- $0/yr ($0/mo · 0.0%)
ⓘ Screening estimate from a state-policy table — verify with the county assessor before closing.
Climate risk First Street
- Flood 6/10 Major FEMA zone X (shaded) · 55% chance over 30 yrs
- Wildfire 1/10 Low
- Heat 9/10 Extreme 7 d/yr ≥106°F today · 16 d/yr by 30 yrs out
- Wind 8/10 Severe 80% chance of damaging wind over 30 yrs
- Air quality 2/10 Low 2 unhealthy d/yr today · 2 by 30 yrs out
Nearby sold comps map
Loading sold comps map…
Walkable amenities ~0.75 mi
Loading nearby amenities…
Taxation est. · year 1
- Rental income
- $19,382
- − Mortgage interest
- −$9,237
- − Property taxes
- −$2,353
- − Insurance
- −$824
- − Repairs & maintenance
- −$1,551
- − Management
- −$1,551
- − Depreciation
- −$4,797
- Taxable loss
- −$931
- Est. tax savings @ 24.0%
- +$223
- After-tax cash flow
- $1,981/yr
For passive investors: Depreciation is non-cash, so a rental often shows a tax loss while cash-flowing — sheltering income. Rental losses are passive: they offset passive income freely, and up to $25,000/yr can offset ordinary (W-2) income if you actively participate and your MAGI is under $100k (phasing out to $0 by $150k); unused losses carry forward. On sale, claimed depreciation is recaptured at up to 25%, and gains may owe capital-gains tax (a 1031 exchange can defer both). Figures are a year-1 estimate at your 24.0% rate — not tax advice; consult a CPA.
Schools (NCES district)
- District
- Portsmouth City Public School District
- NCES district ID
- 5103000
- Math proficiency
- 34% ▼ -40.00%
- Reading proficiency
- 58% ▼ -12.00%
- Median HH income
- $46,152
- Composite
- 39.01/100
- National rank
- #4071
- State rank
- #107 of 131 in VA
Livability — Portsmouth
- Score
- 73/100
- State rank
- #172
- US rank
- #5381
Category grades
Schools grade is shown separately in the Schools card above.
Census & demographics
- Census place
- Portsmouth, VA
- County
- Portsmouth City · 96,366 people
- City population
- 96,366
- Metro
- Virginia Beach-Norfolk-Newport News, VA-NC
- Population (ZIP)
- 14,766
- Household income
- $48,926
- Rent vs Own
- Severe rent burden
- 963.0
Population outlook (Portsmouth County) Hauer SSP2
- Today (2025)
- 96,730 people
- By 2030
- 96,760 · +0.0%
- By 2040
- 96,573 · -0.2%
- By 2050
- 95,606 · -1.2%
- By 2075
- 93,579 · -3.3%
- By 2100
- 83,756 · -13.4%
Race, ethnicity, and origin ACS 2023
- Neighborhood character
- Diverse neighborhood (Simpson 0.64)
- Race & ethnicity
- White 43% Black 41% Two or more races 9% Hispanic / Latino 3% Asian 3%
- Common ancestry
- Slovak 2% Italian 1% Serbian 1%
- Foreign-born
- 5% · Canada, China
- Languages at home
- 94% English-only · Spanish 2% Tagalog/Filipino 1% Chinese 1%
Political lean MEDSL · Portsmouth
- 2024 margin
- Solid D (+38.6) · D 68.6% · R 30.0% · Other 1.4%
- 2008→2024 swing
- -0.7pp no change · 2008: 39.3pp · 2024: 38.6pp
- All cycles
- 2024: D+38.6 2020: D+40.8 2016: D+36.5 2012: D+39.6 2008: D+39.3
Not yet ingested
- Civics
- —
Market trends
- HPI YoY
- ▼ -93.03%
- Current HPI
- 299.832
- Rent YoY
- —
- Metro
- Virginia Beach-Norfolk-Newport News, VA-NC
- State GDP YoY
- ▲ 2.40%
- F500 in state
- 50
Industry mix (Fortune 500 HQ in VA)
| Industry | F500 HQs | Revenue |
|---|---|---|
| Aerospace / Defense | 4 | $236B |
|
||
| Technology / Defense | 3 | $32B |
|
||
| Financial Services | 2 | $176B |
|
||
| Utilities | 2 | $27B |
|
||
| Insurance | 2 | $25B |
|
||
| Technology | 2 | $15B |
|
||
Price history
+37.4% since first listed6 events — show timeline
- 2026-06-17 Pending — REINMLS
- 2026-06-09 Contingent — REINMLS
- 2026-05-20 Relisted — REINMLS
- 2026-05-19 Listing Removed — REINMLS
- 2026-05-12 Listed $164,900 REINMLS
- 2007-03-26 Sold (Public Records) $120,000 Public Records
Property tax history
+2.0%/yrLatest (2025): $2,353 · +2.8% YoY. Source: county tax records.
Cash-flow waterfall
monthlySold comps — $/sqft
last 12 mo · ≤1 miLoading sold comps…