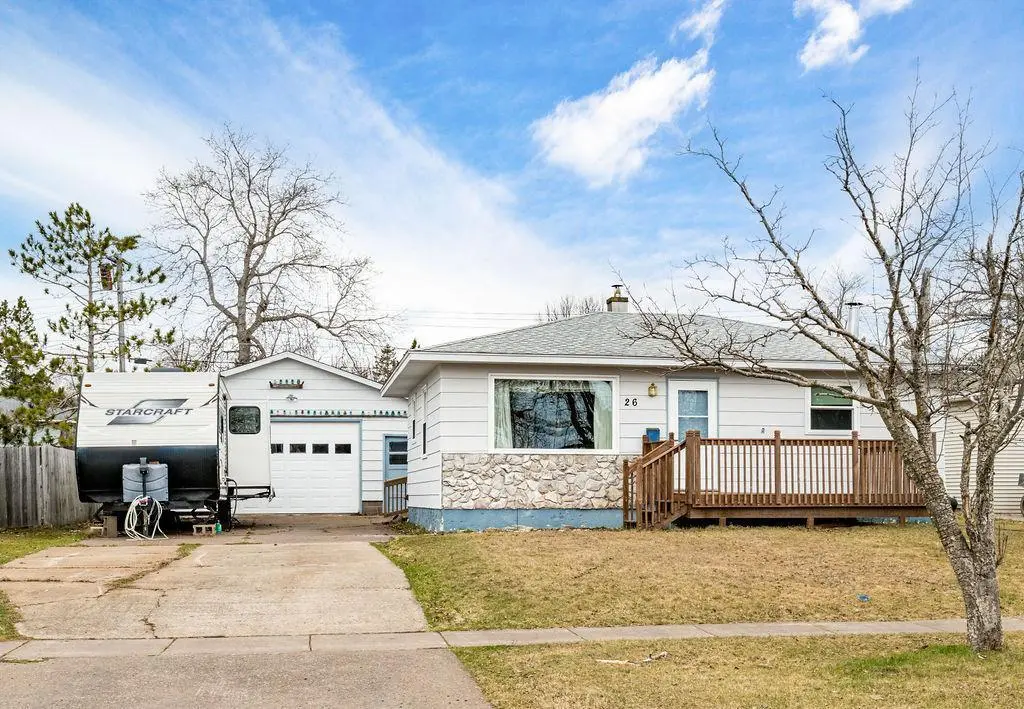
26 Gibson Rd · Silver Bay, MN
Flood risk 1/10 · Minimal
- FEMA flood zone
- —
- Chance of flooding over 30 yrs
- 0.0%
- Est. flood insurance / yr
- —
Fire risk 5/10 · Moderate
- Est. fire insurance / yr
- $888 – $1,650
Heat risk 1/10 · Minimal
- Hot days now (above 86°F)
- 7 days/yr
- Hot days in 30 yrs
- 14 days/yr
Wind risk 1/10 · Minimal
- Chance of severe wind over 30 yrs
- —
Air-quality risk 1/10 · Minimal
- Unhealthy air days now
- 0 days/yr
- Unhealthy air days in 30 yrs
- 0 days/yr
Risk factors via First Street. Map © Google.
Why this score? — see what drove the C+ grade
The composite is a weighted blend of 9 inputs, each scored 0–100. Each bar is that input's sub-score; the figure is the points it added to the 100-point composite (weight × sub-score).
- Cash flow +15.4/30.0
- ARV discount +15.0/15.0
- Appreciation +10.0/10.0
- DSCR +4.7/10.0
- Schools +3.8/10.0
- Livability +3.7/5.0
- 1% rule +3.6/10.0
- Rent growth +2.5/5.0
- Condition / age +2.5/5.0
$110,000
🖨 Deal sheet 📄 Offer letter ✓ Due diligence
Listing remarks
Welcome to this charming 2-bedroom, 2-bathroom home located in the picturesque town of Silver Bay, Minnesota. Nestled among the scenic beauty of the North Shore, this property offers a unique opportunity for those looking to invest in a home that needs a little TLC. As you step inside, you’ll find a layout that features a spacious living area and a cozy kitchen. The two bedrooms provide ample space for relaxation, while the bathroom offers the essentials. With some renovation and personal touches, this home has the potential to become a delightful retreat or a cozy year-round residence. The property boasts a generous yard, perfect for outdoor activities and gatherings with family and
Key facts
- Cozy kitchen
- Generous yard
- Beautiful lakes
Tags
Property features AI
Finance
- Other: Lot approximately 0.176 acres with 115 x 71 dimensions and city street frontage
- Financial info: Conventional mortgage accepted
Exterior
- Parking: Detached or attached garage with space for 1 vehicle
- Utilities: City water connected; City sewer connected; Electric with circuit breakers; Natural gas
- Home design: Residential property; One level; Accessibility features: other
- Construction: Block foundation; Built with block and frame materials
- Exterior features: Vinyl exterior; Asphalt roof; Block and frame construction
Interior
- Kitchen: Range; Dishwasher
- Bedrooms: Two bedrooms (one 15x11 on main level; one 11x11 on main level)
- Bathrooms: One full bath on main floor; One three-quarter bath
- Heating & cooling: Forced air heating; No central air
- Interior features: Breakfast area / eat-in kitchen; Full basement; One fireplace
- Laundry & utility: Laundry on lower level; Dryer
Neighborhood map
What this means for you Summary
Snapshot
- This is a 2-bed/1.0-bath single-family listed at $110k.
Deal economics
- At list price, monthly cash flow is $42 ($502/yr) — positive.
- The deal already cash-flows at list — no discount required.
- To meet the 1% rule (rent ≥ 1% of price), the offer needs to be $95k (13.5% below list).
- Recommended offer: $95k (13.5% below list) — sets the bar for 1% rule.
- Cap rate 6.7% vs local median 4.7% in Silver Bay — top-decile yield for the area; either an underpriced asset or a hidden risk that comps aren't pricing in. Stress-test before assuming the spread holds.
Location & tenants
- Location reads 74/100 on livability (#217 in MN, #4,547 nationally) — a middle-class / working-renter tenant base. Strengths: cost of living A+, housing A+, health & safety A+; Watch: amenities F, commute F.
- Lake Superior Public School District (rural): math 34% / reading 53% proficiency, ranked #191 of 301 in MN (top 64%) — families likely to look elsewhere, expect single-tenant / working-renter base with shorter leases.
- Market conditions: 66 active listings in the ZIP; 81 units permitted in Lake County in 2024 (0 in 5+ unit buildings).
Forward outlook
- In year one you build about $12k of equity ($761 loan paydown + $11k appreciation (10.0% local appreciation)).
- Lake County population projected at -26% by 2050 — secular population decline; favor cash flow + early exit over multi-decade hold.
- At projected returns (10.0% appreciation + 3.0% rent growth), your $31k cash investment doubles in ~3 years — after that, you're playing with house money.
- By year 4, paydown + projected appreciation supports a ~$42k cash-out refi (75% LTV) — recoverable capital for the next deal without selling this one.
Negotiation context
- It's been on market 41 days — a 3% lower offer ($107k) is reasonable based on typical stale-listing flexibility.
Risks & watch-outs
- Watch-outs: built in 1954 — expect roof / HVAC / electrical / plumbing capex.
- Climate carrying-cost: moderate wildfire risk — expect insurance premiums to compound above CPI over the hold.
Questions for the listing agent
- It's been on market 41 days. Have you received any prior offers? Is the seller open to a 14% concession, seller financing, or rate buy-down credit?
- Built in 1954 — when were the roof, HVAC, electrical panel, plumbing, and water heater last replaced?
- Is there a deadline driving the sale (1031 exchange, divorce, estate, relocation)? That informs how much negotiation room exists.
- Schools are B-rated — typically a magnet for longer-tenancy family renters. What's the average tenant stay here, and is there a school-zone premium baked into asking?
- What's the average days-on-market for RENTAL listings here right now (not sales)? A rising rental-DOM trend means longer vacancies and softer asking-rent achievability than the comps imply.
- What's the recent tenant-quality profile in this submarket — average credit score on applications, eviction rate, late-payment / NSF rate, and stable-employment percentage? A property-management company in the area should have these aggregated.
- How much new for-sale + rental construction is in the pipeline within 1–3 miles? Heavy new supply typically softens prices + rents 12–24 months out; constrained supply supports both.
Investment metrics
- 1% rule
- 0.86% ✗
- Cap rate
- 6.75%
- Cash-on-cash
- 1.63%
- DSCR
- 1.07
- GRM
- 9.6
CMA / ARV
- ARV (median comp)
- $170,278
- List price
- $110,000
- Delta
- -35.40%
- Verdict
- UNDERPRICED
- Comps
- 20 within 1.0 mi
Show comp detail 8 sales within ~0.75 mi
| Address | Dist | Beds/Ba | Sqft | Sold | Price | $/sf | Match |
|---|---|---|---|---|---|---|---|
| 66 Banks Blvd | 0.63mi | 2/1.0 | 768 (0%) | 4mo | $117,000 | $152 | 68 |
| 51 Davis Dr | 0.33mi | 3/1.0 (+1) | 864 (+12%) | 3mo | $107,500 | $124 | 56 |
| 88 Banks Blvd | 0.42mi | 3/1.0 (+1) | 864 (+12%) | 0mo | $105,000 | $122 | 54 |
| 11 Charles Crk | 0.72mi | 2/1.0 | 768 (0%) | 23mo | $145,000 | $189 | 47 |
| 12 Dodge Ln | 0.41mi | 2/1.0 | 864 (+12%) | 18mo | $141,000 | $163 | 45 |
| 10 Drake Cr Cir | 0.44mi | 2/1.0 | 864 (+12%) | 23mo | $150,000 | $174 | 40 |
| 31 Charles Cr Cir | 0.59mi | 2/1.0 | 864 (+12%) | 18mo | $145,000 | $168 | 36 |
| 33 Charles Crk | 0.58mi | 3/1.0 (+1) | 864 (+12%) | 14mo | $145,000 | $168 | 35 |
Match score weights: distance 35% · size 25% · config 20% · recency 20%. Top-matched comps best support the ARV.
Projected returns pro-forma
10.0% appreciation · 3.0% rent growth · sell at horizon
- IRR
- 25.4%
- Equity multiple
- 3.03×
- Total profit
- $62,559
- Equity at exit
- $99,097
- IRR
- 22.4%
- Equity multiple
- 6.91×
- Total profit
- $182,096
- Equity at exit
- $213,706
Cash invested: $30,800 (down + closing). Projections, not guarantees.
Landlord ↔ Tenant lean methodology
- Overall (STATE)
- 46 Balanced
- State Minnesota
- 46 Balanced · D+2
- County
- — inherits STATE
- City
- — inherits STATE
ZIP-level market 55614
- Home prices YoY
- 11.9%
- Active inventory
- 66
- Price-to-rent
- 9.6×
Monthly cashflow live
- Estimated rent
- $951 medium interval (Pro) →
- Mortgage (P&I)
- −$577
- Tax from tax record
- −$87 /mo · $1,042/yr
- Insurance
- −$46
- HOA
- −$0
- Vacancy / Maint / Mgmt
- −$200
- Net cashflow
- $42
Break-even live
UW: 25.0% down · 7.5% · 30yr · 1.5% tax · 5.0% vac · 8.0% maint · 8.0% mgmt
Financing live
Cash to close
- Down payment
- $27,500
- Closing costs
- $3,300
- Reserves months
- —
- Total cash needed
- —
Loan-product check · same deal, 3 products live
Conventional
25% down · 7.5% · 30yr
- Down + closing
- —
- Monthly P&I
- —
- Monthly cashflow
- —
- DSCR
- —
- Eligible?
- —
Personal DTI + credit; lowest rate.
DSCR
20% down · 8.5% · 30yr
- Down + closing
- —
- Monthly P&I
- —
- Monthly cashflow
- —
- DSCR
- —
- Eligible?
- —
No personal income docs; deal must DSCR.
Hard money
10% down · 12.0% · 12mo
- Down + closing
- —
- Monthly P&I
- —
- Monthly cashflow
- —
- DSCR
- —
- Eligible?
- —
Short-term bridge; refi at stabilization.
Listing history 10 events
-
2026-06-13statusdays on market $110,000 Pending 41 DOM
-
2026-06-10days on market $110,000 Active 39 DOM
-
2026-06-09days on market $110,000 Active 38 DOM
-
2026-06-08days on market $110,000 Active 37 DOM
-
2026-06-07days on market $110,000 Active 36 DOM
-
2026-06-02days on market $110,000 Active 31 DOM
-
2026-06-01days on market $110,000 Active 30 DOM
-
2026-05-31days on market $110,000 Active 29 DOM
-
2026-05-30days on market $110,000 Active 28 DOM
-
2026-05-02$125,000 Active 1286-char remark
ⓘ Source: listings_history table (triggers on properties + properties_extension) + one-shot
backfill from property_details.listing_events for pre-trigger history.
Tax reassessment forecast MN · Partial reset (capped growth)
- Current annual tax
- $1,042 · $87/mo
- Projected year-2 tax
- $1,137 · $95/mo
- Expected delta
- +$95/yr (+$8/mo · 9.1%)
ⓘ Screening estimate from a state-policy table — verify with the county assessor before closing.
Climate risk First Street
- Flood 1/10 Low 0% chance over 30 yrs
- Wildfire 5/10 Major
- Heat 1/10 Low 7 d/yr ≥86°F today · 14 d/yr by 30 yrs out
- Wind 1/10 Low
- Air quality 1/10 Low 0 unhealthy d/yr today · 0 by 30 yrs out
Nearby sold comps map
Loading sold comps map…
Walkable amenities ~0.75 mi
Loading nearby amenities…
Taxation est. · year 1
- Rental income
- $11,414
- − Mortgage interest
- −$6,162
- − Property taxes
- −$1,042
- − Insurance
- −$550
- − Repairs & maintenance
- −$913
- − Management
- −$913
- − Depreciation
- −$3,200
- Taxable loss
- −$1,366
- Est. tax savings @ 24.0%
- +$328
- After-tax cash flow
- $830/yr
For passive investors: Depreciation is non-cash, so a rental often shows a tax loss while cash-flowing — sheltering income. Rental losses are passive: they offset passive income freely, and up to $25,000/yr can offset ordinary (W-2) income if you actively participate and your MAGI is under $100k (phasing out to $0 by $150k); unused losses carry forward. On sale, claimed depreciation is recaptured at up to 25%, and gains may owe capital-gains tax (a 1031 exchange can defer both). Figures are a year-1 estimate at your 24.0% rate — not tax advice; consult a CPA.
Schools (NCES district)
- District
- Lake Superior Public School District
- NCES district ID
- 2740740
- Math proficiency
- 34% ▼ -24.00%
- Reading proficiency
- 53% ▼ -9.00%
- Median HH income
- $51,958
- Composite
- 37.51/100
- National rank
- #4399
- State rank
- #191 of 301 in MN
Livability — Silver Bay
- Score
- 74/100
- State rank
- #217
- US rank
- #4547
Category grades
Schools grade is shown separately in the Schools card above.
Census & demographics
- Census place
- Silver Bay, MN
- Population (ZIP)
- 2,450
Population outlook (Lake County) Hauer SSP2
- Today (2025)
- 9,943 people
- By 2030
- 9,437 · -5.1%
- By 2040
- 8,326 · -16.3%
- By 2050
- 7,365 · -25.9%
- By 2075
- 6,008 · -39.6%
- By 2100
- 5,038 · -49.3%
Race, ethnicity, and origin ACS 2023
- Neighborhood character
- Predominantly White (91%)
- Race & ethnicity
- White 91% Two or more races 7% Hispanic / Latino 2%
- Common ancestry
- Portuguese 21% Lithuanian 2% Scottish 2%
- Foreign-born
- 1% · Vietnam
- Languages at home
- 98% English-only · Other Indo-European 1%
Political lean MEDSL · Lake
- 2024 margin
- Toss-up / Even · D 51.0% · R 47.1% · Other 1.9%
- 2008→2024 swing
- -18.2pp toward R · 2008: 22.1pp · 2024: 3.9pp
- All cycles
- 2024: D+3.9 2020: D+3.5 2016: D+2.2 2012: D+21.1 2008: D+22.1
Not yet ingested
- Civics
- —
Market trends
- HPI YoY
- ▲ 52.26%
- Current HPI
- 490.17
- Rent YoY
- —
- Metro
- —
- State GDP YoY
- ▲ 2.41%
- F500 in state
- 34
Industry mix (Fortune 500 HQ in MN)
| Industry | F500 HQs | Revenue |
|---|---|---|
| Healthcare | 2 | $407B |
|
||
| Retail | 2 | $150B |
|
||
| Consumer Goods | 2 | $32B |
|
||
| Industrial Machinery | 2 | $6B |
|
||
| Agriculture | 1 | $40B |
|
||
| Healthcare / Medical Devices | 1 | $32B |
|
||
Price history
-12.0% since first listed3 events — show timeline
- 2026-06-12 Pending — NORTHSTARMLS as Distributed by MLS Grid
- 2026-05-20 Price Changed $110,000 NORTHSTARMLS as Distributed by MLS Grid
- 2026-05-02 Listed $125,000 NORTHSTARMLS as Distributed by MLS Grid
Property tax history
+8.6%/yrLatest (2025): $1,042 · +191.6% YoY. Source: county tax records.
Cash-flow waterfall
monthlySold comps — $/sqft
last 12 mo · ≤1 miLoading sold comps…