1002 S Sibley Dr · Pueblo West, CO
Flood risk 1/10 · Minimal
- FEMA flood zone
- X (unshaded)
- Chance of flooding over 30 yrs
- 0.0%
- Est. flood insurance / yr
- $473 – $860
Fire risk 5/10 · Moderate
- Est. fire insurance / yr
- $939 – $1,743
Heat risk 4/10 · Minor
- Hot days now (above 96°F)
- 6 days/yr
- Hot days in 30 yrs
- 16 days/yr
Wind risk 2/10 · Minimal
- Chance of severe wind over 30 yrs
- —
Air-quality risk 1/10 · Minimal
- Unhealthy air days now
- 0 days/yr
- Unhealthy air days in 30 yrs
- 0 days/yr
Risk factors via First Street. Map © Google.
Why this score? — see what drove the F grade
The composite is a weighted blend of 9 inputs, each scored 0–100. Each bar is that input's sub-score; the figure is the points it added to the 100-point composite (weight × sub-score).
- ARV discount +9.7/15.0
- Cash flow +7.4/30.0
- Livability +3.2/5.0
- Schools +3.0/10.0
- Rent growth +2.5/5.0
- Condition / age +2.5/5.0
- DSCR +1.6/10.0
- 1% rule +1.2/10.0
- Appreciation +0.0/10.0
$249,000
🖨 Deal sheet (PDF) 📄 Offer letter ✓ Due diligence
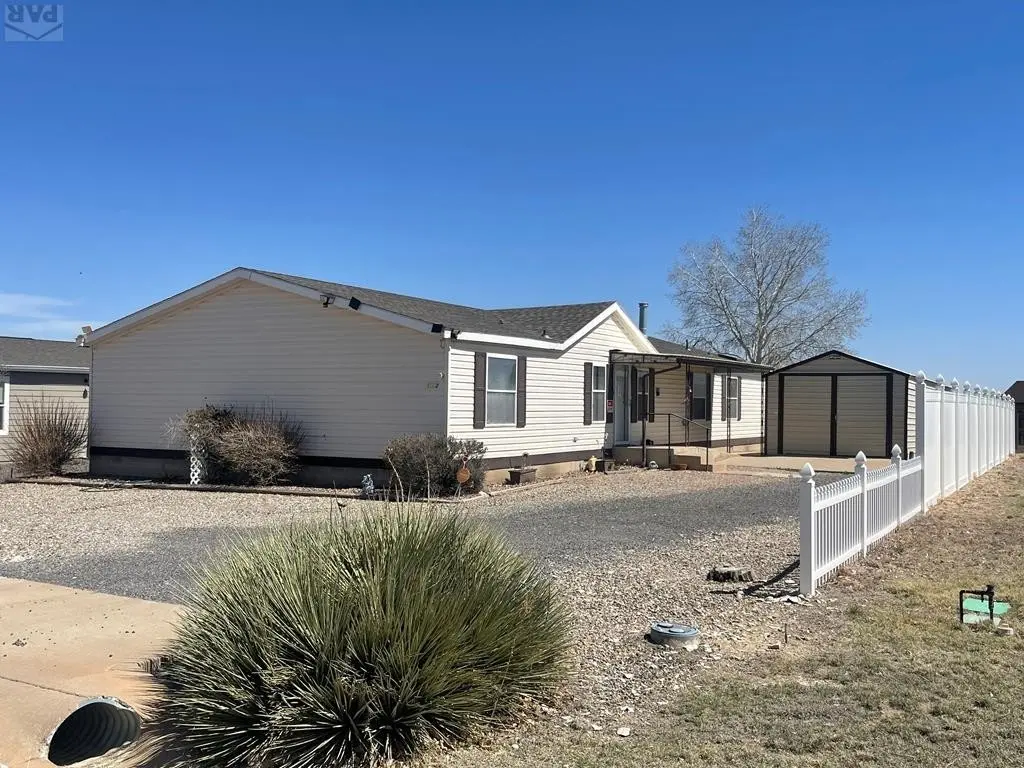
Listing remarks
Well-maintained ranch-style manufactured home located in Liberty Point Estates in Pueblo West. This spacious property offers over 2,000 square feet of living space with 3 bedrooms and 2 bathrooms. The open layout includes a large living room, separate family room, and a dedicated dining area, providing flexible space for a variety of needs. The kitchen features ample cabinetry and workspace, with convenient access to the dining area and main living spaces. The primary suite includes a 5-piece bathroom with a soaking tub, separate shower, and generous storage. Additional highlights include main-level laundry, comfortable bedroom sizes, and a 1-car detached garage. Situated on a manageable lo
Key facts
- 5-piece bathroom
- Ample cabinetry
- Large living room
Tags
Property features AI
Finance
- HOA & community: Homeowners association with a $20 monthly fee
Exterior
- Parking: Detached 1-car garage
- Security: Smoke detectors
- Utilities: Public water; Public sewer
- Home design: Manufactured single-family residence
- Construction: Vinyl siding; Composition roof
- Exterior features: Covered patio/porch
Interior
- Kitchen: Disposal; Dishwasher; Refrigerator; Electric cooktop
- Bedrooms: 3 bedrooms on the main level
- Flooring: Carpet; Vinyl
- Bathrooms: 2 full bathrooms (1 on the main level)
- Heating & cooling: Central air; Ceiling fans; Natural gas forced-air heating
- Interior features: Ceiling fans; Walk-in closets; Master suite on main level; Double-pane windows; Gas log fireplace in living room
- Laundry & utility: Laundry on the main level
Neighborhood map
What this means for you Summary
Snapshot
- This is a 3-bed/2.0-bath manufactured listed at $249k.
Deal economics
- At list price, monthly cash flow is $-319 ($-4k/yr) — negative.
- To cash-flow at today's rent, offer at most $193k (22.7% below list).
- To meet the 1% rule (rent ≥ 1% of price), the offer needs to be $154k (38.2% below list).
- Recommended offer: $154k (38.2% below list) — sets the bar for 1% rule.
- Cap rate 4.8% vs local median 3.6% in Pueblo West — top-decile yield for the area; either an underpriced asset or a hidden risk that comps aren't pricing in. Stress-test before assuming the spread holds.
Location & tenants
- Location reads 63/100 on livability (#189 in CO) — a middle-class / working-renter tenant base. Strengths: housing A+, employment B+; Watch: health & safety C-, crime F, amenities F.
- Pueblo County School District 70 (suburban): math 24% / reading 43% proficiency, ranked #40 of 86 in CO (top 46%) — families likely to look elsewhere, expect single-tenant / working-renter base with shorter leases.
- Zoned schools: Prairie Winds Elementary School (math 24% / reading 27%, grade F, #594 of 966 statewide, top 62%, 500 students, 47% FRL); Sky View Middle School (math 22% / reading 47%, grade F, #106 of 270 statewide, top 42%, 577 students, 41% FRL); Pueblo West High School (math 23% / reading 52%, grade F, #192 of 381 statewide, top 51%, 1,484 students, 40% FRL).
- Market conditions: Rents soft (-0.1%/yr); 650 active listings in the ZIP; 1 comparable units currently listed for rent nearby; solid renter incomes; 269 units permitted in Pueblo County in 2024 (0 in 5+ unit buildings).
Forward outlook
- Local home prices are declining (-3.0%/yr); year-one equity from $2k of loan paydown is wiped out by about $7k of value loss. Plan a longer hold.
- Pueblo County population projected at +10% by 2050 — modest demand growth; plan on rents tracking national, not racing it.
Negotiation context
- It's been on market 81 days — a 6% lower offer ($234k) is reasonable based on typical stale-listing flexibility.
- Current owner paid $16k; list at $249k implies a 1456% gain — meaningful room to come down on a strong offer.
Risks & watch-outs
- Climate carrying-cost: moderate wildfire risk — expect insurance premiums to compound above CPI over the hold.
Questions for the listing agent
- What do current leases actually rent for vs. the listed asking? Can we see a recent rent roll and the last 12 months of T-12 income?
- It's been on market 81 days. Have you received any prior offers? Is the seller open to a 38% concession, seller financing, or rate buy-down credit?
- What does the HOA fee cover, when was the last increase, and are there any pending special assessments or reserve-fund shortfalls?
- Why hasn't it sold? Are there any deal-killer items the seller is aware of (foundation, flood, title, zoning, code violations)?
- Is there a deadline driving the sale (1031 exchange, divorce, estate, relocation)? That informs how much negotiation room exists.
- Schools are D-rated, which usually means shorter tenancies and higher turnover. Who's the typical renter profile here, and what's been the actual vacancy rate?
- Crime grade is F in this area — have there been break-ins, vandalism, or insurance claims at this property in the last 3 years? What carrier currently insures it and at what premium?
- The area grade is low — what's the realistic commute time and amenity access for the typical tenant pool here? Any planned neighborhood developments (good or bad) we should know about?
- What's the average days-on-market for RENTAL listings here right now (not sales)? A rising rental-DOM trend means longer vacancies and softer asking-rent achievability than the comps imply.
- What's the recent tenant-quality profile in this submarket — average credit score on applications, eviction rate, late-payment / NSF rate, and stable-employment percentage? A property-management company in the area should have these aggregated.
- How much new for-sale + rental construction is in the pipeline within 1–3 miles? Heavy new supply typically softens prices + rents 12–24 months out; constrained supply supports both.
Investment metrics
- 1% rule
- 0.62% ✗
- Cap rate
- 4.75%
- Cash-on-cash
- -5.50%
- DSCR
- 0.76
- GRM
- 13.5
CMA / ARV
- ARV (on-the-fly)
- $262,080
- Comps found
- 3
Show comp detail 3 sales within ~0.75 mi
| Address | Dist | Beds/Ba | Sqft | Sold | Price | $/sf | Match |
|---|---|---|---|---|---|---|---|
| 978 S Saddlerock Dr | 0.41mi | 3/2.0 | 1,860 (-8%) | 2mo | $259,000 | $139 | 66 |
| 970 S Tolstoi Dr | 0.19mi | 3/2.0 | 2,128 (+6%) | 23mo | $270,000 | $127 | 62 |
| 1047 S Saddlerock Dr | 0.30mi | 3/2.0 | 1,728 (-14%) | 21mo | $225,000 | $130 | 45 |
Match score weights: distance 35% · size 25% · config 20% · recency 20%. Top-matched comps best support the ARV.
Projected returns pro-forma
-3.0% appreciation · 0.0% rent growth · sell at horizon
- IRR
- -28.7%
- Equity multiple
- 0.06×
- Total profit
- $-65,292
- Equity at exit
- $37,127
- IRR
- -42.9%
- Equity multiple
- -0.45×
- Total profit
- $-100,844
- Equity at exit
- $21,529
Cash invested: $69,720 (down + closing). Projections, not guarantees.
Landlord ↔ Tenant lean methodology
- Overall (STATE)
- 38 Tenant-Leaning
- State Colorado
- 38 Tenant-Leaning · D+4
- County
- — inherits STATE
- City
- — inherits STATE
ZIP-level market 81007
- Home prices YoY
- -22.9%
- Rents YoY
- -0.1%
- Active inventory
- 650
- Price-to-rent
- 13.5×
Monthly cashflow live
- Estimated rent
- $1,538 medium interval (Pro) →
- Mortgage (P&I)
- −$1,306
- Tax from tax record
- −$105 /mo · $1,261/yr
- Insurance
- −$104
- HOA
- −$20
- Lot rent leased land?
- −$0
- Vacancy / Maint / Mgmt
- −$323
- Net cashflow
- $-319
Break-even live
Sensitivity live
| Price | -10% $-178 | -5% $-249 | +0% $-319 | +5% $-390 | +10% $-460 |
|---|---|---|---|---|---|
| Rent | -10% $-441 | -5% $-380 | +0% $-319 | +5% $-259 | +10% $-198 |
| Rate | -1.0pp $-194 | -0.5pp $-256 | base $-319 | +0.5pp $-384 | +1.0pp $-450 |
UW: 25.0% down · 7.5% · 30yr · 1.5% tax · 5.0% vac · 8.0% maint · 8.0% mgmt
Financing live
Cash to close
- Down payment
- $62,250
- Closing costs
- $7,470
- Reserves months
- —
- Total cash needed
- —
Loan-product check · same deal, 3 products live
Conventional
25% down · 7.5% · 30yr
- Down + closing
- —
- Monthly P&I
- —
- Monthly cashflow
- —
- DSCR
- —
- Eligible?
- —
Personal DTI + credit; lowest rate.
DSCR
20% down · 8.5% · 30yr
- Down + closing
- —
- Monthly P&I
- —
- Monthly cashflow
- —
- DSCR
- —
- Eligible?
- —
No personal income docs; deal must DSCR.
Hard money
10% down · 12.0% · 12mo
- Down + closing
- —
- Monthly P&I
- —
- Monthly cashflow
- —
- DSCR
- —
- Eligible?
- —
Short-term bridge; refi at stabilization.
Rent comps 1 comps
| Address | Beds | Baths | Sqft | Rent | $/sqft | DOM | Units | Dist |
|---|---|---|---|---|---|---|---|---|
| 230 W Elbow Dr Unit 228 Pueblo, CO | 3.0 | 2.5 | 1427 | $2,025 | $1.42 | 15d | 1 | 1.40mi |
HOA detail
- Monthly dues
- $20 · $240/yr
Listing history 20 events
-
2026-06-21days on market $249,000 Active 81 DOM
-
2026-06-19days on market $249,000 Active 79 DOM
-
2026-06-18days on market $249,000 Active 78 DOM
-
2026-06-17days on market $249,000 Active 77 DOM
-
2026-06-16days on market $249,000 Active 76 DOM
-
2026-06-15days on market $249,000 Active 75 DOM
-
2026-06-14days on market $249,000 Active 73 DOM
-
2026-06-13pricedays on market $249,000 Active 72 DOM
-
2026-06-10days on market $259,000 Active 70 DOM
-
2026-06-09days on market $259,000 Active 69 DOM
-
2026-06-08days on market $259,000 Active 68 DOM
-
2026-06-07days on market $259,000 Active 67 DOM
-
2026-06-05days on market $259,000 Active 64 DOM
-
2026-06-03days on market $259,000 Active 63 DOM
-
2026-06-02days on market $259,000 Active 62 DOM
-
2026-06-01days on market $259,000 Active 61 DOM
-
2026-05-31days on market $259,000 Active 60 DOM
-
2026-05-30days on market $259,000 Active 59 DOM
-
2026-04-02$259,000 Active
-
2000-06-22soldstatus $16,000
ⓘ Source: listings_history table (triggers on properties + properties_extension) + one-shot
backfill from property_details.listing_events for pre-trigger history.
Tax reassessment forecast CO · Resets to sale price
- Current annual tax
- $1,261 · $105/mo
- Projected year-2 tax
- $1,370 · $114/mo
- Expected delta
- +$108/yr (+$9/mo · 8.6%)
ⓘ Screening estimate from a state-policy table — verify with the county assessor before closing.
Climate risk First Street
- Flood 1/10 Low FEMA zone X (unshaded) · 0% chance over 30 yrs
- Wildfire 5/10 Major
- Heat 4/10 Moderate 6 d/yr ≥96°F today · 16 d/yr by 30 yrs out
- Wind 2/10 Low
- Air quality 1/10 Low 0 unhealthy d/yr today · 0 by 30 yrs out
Nearby sold comps map
Loading sold comps map…
Walkable amenities ~0.75 mi
Loading nearby amenities…
Taxation est. · year 1
- Rental income
- $18,459
- − Mortgage interest
- −$13,948
- − Property taxes
- −$1,261
- − Insurance
- −$1,245
- − Repairs & maintenance
- −$1,477
- − Management
- −$1,477
- − HOA
- −$240
- − Depreciation
- −$7,244
- Taxable loss
- −$8,432
- Est. tax savings @ 24.0%
- +$2,024
- After-tax cash flow
- $-1,809/yr
For passive investors: Depreciation is non-cash, so a rental often shows a tax loss while cash-flowing — sheltering income. Rental losses are passive: they offset passive income freely, and up to $25,000/yr can offset ordinary (W-2) income if you actively participate and your MAGI is under $100k (phasing out to $0 by $150k); unused losses carry forward. On sale, claimed depreciation is recaptured at up to 25%, and gains may owe capital-gains tax (a 1031 exchange can defer both). Figures are a year-1 estimate at your 24.0% rate — not tax advice; consult a CPA.
Schools (NCES district)
- District
- Pueblo County School District 70
- NCES district ID
- 0806150
- Math proficiency
- 24% ▼ -4.00%
- Reading proficiency
- 43% ▼ -2.00%
- Median HH income
- $59,438
- Composite
- 29.93/100
- National rank
- #6381
- State rank
- #40 of 86 in CO
Livability — Pueblo West
- Score
- 63/100
- State rank
- #189
- US rank
- #15760
Category grades
Schools grade is shown separately in the Schools card above.
Census & demographics
- Census place
- Pueblo West, CO
- County
- Pueblo County · 151,887 people
- Metro
- Pueblo, CO
- Population (ZIP)
- 35,690
- Household income
- $96,713
- Rent vs Own
- Severe rent burden
- 353.0
Population outlook (Pueblo County) Hauer SSP2
- Today (2025)
- 173,240 people
- By 2030
- 177,716 · +2.6%
- By 2040
- 185,125 · +6.9%
- By 2050
- 190,642 · +10.0%
- By 2075
- 201,611 · +16.4%
- By 2100
- 196,443 · +13.4%
Race, ethnicity, and origin ACS 2023
- Neighborhood character
- Predominantly White (65%)
- Race & ethnicity
- White 65% Hispanic / Latino 29% Two or more races 11% Asian 1% Black 1%
- Hispanic origin (detail)
- Mexican 19%
- Common ancestry
- Romanian 2% Lithuanian 2% Italian 2%
- Foreign-born
- 4% · Canada
- Languages at home
- 92% English-only · Spanish 7%
Political lean MEDSL · Pueblo
- 2024 margin
- Lean R (+5.1) · D 46.2% · R 51.3% · Other 2.5%
- 2008→2024 swing
- -20.1pp toward R · 2008: 15.0pp · 2024: -5.1pp
- All cycles
- 2024: R+5.1 2020: D+1.7 2016: D+0.3 2012: D+13.1 2008: D+15.0
Not yet ingested
- Civics
- —
Market trends
- HPI YoY
- ▼ -82.80%
- Current HPI
- 279.191
- Rent YoY
- ▼ -0.10%
- Metro
- Pueblo, CO
- State GDP YoY
- ▲ 1.95%
- F500 in state
- 14
Industry mix (Fortune 500 HQ in CO)
| Industry | F500 HQs | Revenue |
|---|---|---|
| Technology Distribution | 1 | $31B |
|
||
| Food / Agriculture | 1 | $18B |
|
||
| Packaging | 1 | $14B |
|
||
| Healthcare | 1 | $13B |
|
||
| Energy | 1 | $10B |
|
||
| Technology | 1 | $4B |
|
||
Price history
+1518.8% since first listed2 events — show timeline
- 2026-04-02 Listed $259,000 PARMLS
- 2000-06-22 Sold (Public Records) $16,000 Public Records
Property tax history
+13.4%/yrLatest (2025): $1,261 · +58.0% YoY. Source: county tax records.
Cash-flow waterfall
monthlySold comps — $/sqft
last 12 mo · ≤1 miLoading sold comps…