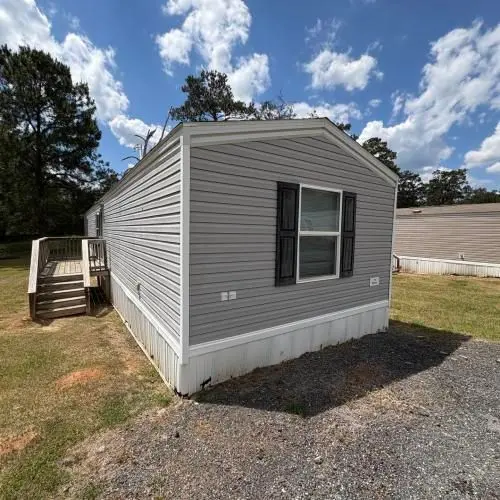
160 Railway Ave · Thomasville, GA
Flood risk 1/10 · Minimal
- FEMA flood zone
- X (unshaded)
- Chance of flooding over 30 yrs
- 0.0%
- Est. flood insurance / yr
- $507 – $1,088
Fire risk 5/10 · Moderate
- Est. fire insurance / yr
- $963 – $1,789
Heat risk 8/10 · Major
- Hot days now (above 108°F)
- 7 days/yr
- Hot days in 30 yrs
- 19 days/yr
Wind risk 9/10 · Severe
- Chance of severe wind over 30 yrs
- 99.0%
Air-quality risk 5/10 · Moderate
- Unhealthy air days now
- 8 days/yr
- Unhealthy air days in 30 yrs
- 9 days/yr
Risk factors via First Street. Map © Google.
Why this score? — see what drove the D grade
The composite is a weighted blend of 9 inputs, each scored 0–100. Each bar is that input's sub-score; the figure is the points it added to the 100-point composite (weight × sub-score).
- Cash flow +15.0/30.0
- ARV discount +7.5/15.0
- 1% rule +5.0/10.0
- DSCR +5.0/10.0
- Livability +3.6/5.0
- Rent growth +2.5/5.0
- Schools +2.5/10.0
- Condition / age +2.2/5.0
- Appreciation +0.0/10.0
$36,999
🖨 Deal sheet 📄 Offer letter ✓ Due diligence
Key facts
- Built 2026
- Listed 44 days
Property features AI
Finance
- Financial info: List price: $36,999
Exterior
- Home design: Single-family (spec plan named "Home Run")
- Construction: Living area: 924; Built as part of a spec inventory
- Exterior features: Shake roof
Interior
- Bedrooms: 3 bedrooms
- Interior features: 2 total bathrooms
Neighborhood map
What this means for you Summary
Snapshot
- This is a 3-bed/2.0-bath single-family listed at $37k. Condition is rated fair.
Deal economics
- At list price, monthly cash flow is $989 ($12k/yr) — positive.
- The deal already cash-flows at list — no discount required.
- Meets the 1% rule at list price ($2k rent vs $37k).
- Recommended offer: $36k (3.0% below list) — sets the bar for market timing.
- Cap rate 38.4% vs local median 3.7% in Thomasville — top-decile yield for the area; either an underpriced asset or a hidden risk that comps aren't pricing in. Stress-test before assuming the spread holds.
Location & tenants
- Location reads 71/100 on livability (#77 in GA) — a middle-class / working-renter tenant base. Strengths: amenities A+, cost of living A+, health & safety A+; Watch: schools D, crime F, commute F.
- Thomas County (rural): math 27% / reading 32% proficiency, ranked #97 of 174 in GA (top 56%) — low school quality limits family demand, transient renter base, plan for 1-2y turnover.
- Market conditions: 203 active listings in the ZIP; 3 comparable units currently listed for rent nearby; rentals lingering (median 44d on market — plan ~5-8 weeks vacancy on turnover, expect pricing pressure); 100% of comp listings sitting > 30 days — soft ceiling on asking rent; 213 units permitted in Thomas County in 2024 (72 in 5+ unit buildings).
- This rent runs 37% of the median local income ($50k/yr) — at the standard rent-burdened threshold; future hikes will face affordability resistance.
Forward outlook
- Local home prices are declining (-3.0%/yr); year-one equity from $256 of loan paydown is wiped out by about $1k of value loss. Plan a longer hold.
- Thomas County population projected to shrink 7% by 2050 — rents likely to lag national; underwrite the cash flow, not the appreciation.
- At projected returns (-3.0% appreciation + 3.0% rent growth), your $10k cash investment doubles in ~1 year — after that, you're playing with house money.
Negotiation context
- It's been on market 45 days — a 3% lower offer ($36k) is reasonable based on typical stale-listing flexibility.
Risks & watch-outs
- Climate carrying-cost: severe wind risk, 99% chance of damaging wind over 30y; moderate wildfire risk; extreme-heat days projected 7→19/yr by 2055 (HVAC capex compounding) — expect insurance premiums to compound above CPI over the hold.
Questions for the listing agent
- It's been on market 45 days. Have you received any prior offers? Is the seller open to a 3% concession, seller financing, or rate buy-down credit?
- Have any recent inspections been done? Can we get a copy of the seller's disclosures and any deferred-maintenance estimates?
- Is there a deadline driving the sale (1031 exchange, divorce, estate, relocation)? That informs how much negotiation room exists.
- Schools are D-rated, which usually means shorter tenancies and higher turnover. Who's the typical renter profile here, and what's been the actual vacancy rate?
- Crime grade is F in this area — have there been break-ins, vandalism, or insurance claims at this property in the last 3 years? What carrier currently insures it and at what premium?
- The area grade is low — what's the realistic commute time and amenity access for the typical tenant pool here? Any planned neighborhood developments (good or bad) we should know about?
- What's the average days-on-market for RENTAL listings here right now (not sales)? A rising rental-DOM trend means longer vacancies and softer asking-rent achievability than the comps imply.
- What's the recent tenant-quality profile in this submarket — average credit score on applications, eviction rate, late-payment / NSF rate, and stable-employment percentage? A property-management company in the area should have these aggregated.
- How much new for-sale + rental construction is in the pipeline within 1–3 miles? Heavy new supply typically softens prices + rents 12–24 months out; constrained supply supports both.
Investment metrics
- 1% rule
- 4.26% ✓
- Cap rate
- 38.38%
- Cash-on-cash
- 114.59%
- DSCR
- 6.10
- GRM
- 2.0
CMA / ARV
- ARV (median comp)
- $169,144
- List price
- $36,999
- Delta
- -78.13%
- Verdict
- UNDERPRICED
- Comps
- 14 within 1.0 mi
Show comp detail 1 sale within ~0.75 mi
| Address | Dist | Beds/Ba | Sqft | Sold | Price | $/sf | Match |
|---|---|---|---|---|---|---|---|
| 416 Tanglewood Dr | 0.43mi | 3/1.0 | 1,000 (+8%) | 12mo | $210,000 | $210 | 52 |
Match score weights: distance 35% · size 25% · config 20% · recency 20%. Top-matched comps best support the ARV.
Projected returns pro-forma
-3.0% appreciation · 3.0% rent growth · sell at horizon
- IRR
- —
- Equity multiple
- 6.51×
- Total profit
- $57,034
- Equity at exit
- $5,517
- IRR
- —
- Equity multiple
- 13.63×
- Total profit
- $130,892
- Equity at exit
- $3,199
Cash invested: $10,360 (down + closing). Projections, not guarantees.
Landlord ↔ Tenant lean methodology
- Overall (STATE)
- 90 Strongly Landlord-Friendly
- State Georgia
- 90 Strongly Landlord-Friendly · R+3
- County
- — inherits STATE
- City
- — inherits STATE
ZIP-level market 31792
- Home prices YoY
- -29.0%
- Active inventory
- 203
- Price-to-rent
- 2.0×
Monthly cashflow live
- Estimated rent
- $1,576 medium interval (Pro) →
- Mortgage (P&I)
- −$194
- Tax est. 1.5%
- −$46 /mo · $555/yr
- Insurance
- −$15
- HOA
- −$0
- Vacancy / Maint / Mgmt
- −$331
- Net cashflow
- $989
Break-even live
UW: 25.0% down · 7.5% · 30yr · 1.5% tax · 5.0% vac · 8.0% maint · 8.0% mgmt
Financing live
Cash to close
- Down payment
- $9,250
- Closing costs
- $1,110
- Reserves months
- —
- Total cash needed
- —
Loan-product check · same deal, 3 products live
Conventional
25% down · 7.5% · 30yr
- Down + closing
- —
- Monthly P&I
- —
- Monthly cashflow
- —
- DSCR
- —
- Eligible?
- —
Personal DTI + credit; lowest rate.
DSCR
20% down · 8.5% · 30yr
- Down + closing
- —
- Monthly P&I
- —
- Monthly cashflow
- —
- DSCR
- —
- Eligible?
- —
No personal income docs; deal must DSCR.
Hard money
10% down · 12.0% · 12mo
- Down + closing
- —
- Monthly P&I
- —
- Monthly cashflow
- —
- DSCR
- —
- Eligible?
- —
Short-term bridge; refi at stabilization.
Rent comps 3 comps
| Address | Beds | Baths | Sqft | Rent | $/sqft | DOM | Units | Dist |
|---|---|---|---|---|---|---|---|---|
| 124 Ginny Ln Thomasville, GA | 2.0–3.0 | 2.0 | 854 | $1,300 | $1.52 | 43d | 2 | 0.12mi |
| 220 Covington Ave Thomasville, GA | 1.0–3.0 | 1.0–2.0 | 1014 | $1,350 | $1.33 | 43d | 10 | 1.24mi |
| 11369 US Highway 84 E Thomasville, GA | 2.0 | 1.0 | 784 | $1,100 | $1.40 | 43d | 1 | 1.25mi |
Listing history 17 events
-
2026-06-19days on market $36,999 Active 45 DOM
-
2026-06-18days on market $36,999 Active 44 DOM
-
2026-06-17days on market $36,999 Active 43 DOM
-
2026-06-16days on market $36,999 Active 42 DOM
-
2026-06-15days on market $36,999 Active 41 DOM
-
2026-06-14days on market $36,999 Active 39 DOM
-
2026-06-12days on market $36,999 Active 38 DOM
-
2026-06-09days on market $36,999 Active 35 DOM
-
2026-06-08days on market $36,999 Active 34 DOM
-
2026-06-07days on market $36,999 Active 33 DOM
-
2026-06-07days on market $36,999 Active 32 DOM
-
2026-06-03days on market $36,999 Active 29 DOM
-
2026-06-02days on market $36,999 Active 28 DOM
-
2026-06-01days on market $36,999 Active 27 DOM
-
2026-05-31days on market $36,999 Active 26 DOM
-
2026-05-31days on market $36,999 Active 25 DOM
-
2026-05-05$36,999 Active
ⓘ Source: listings_history table (triggers on properties + properties_extension) + one-shot
backfill from property_details.listing_events for pre-trigger history.
Climate risk First Street
- Flood 1/10 Low FEMA zone X (unshaded) · 0% chance over 30 yrs
- Wildfire 5/10 Major
- Heat 8/10 Severe 7 d/yr ≥108°F today · 19 d/yr by 30 yrs out
- Wind 9/10 Extreme 99% chance of damaging wind over 30 yrs
- Air quality 5/10 Major 8 unhealthy d/yr today · 9 by 30 yrs out
Nearby sold comps map
Loading sold comps map…
Walkable amenities ~0.75 mi
Loading nearby amenities…
Taxation est. · year 1
- Rental income
- $18,911
- − Mortgage interest
- −$2,073
- − Property taxes
- −$555
- − Insurance
- −$185
- − Repairs & maintenance
- −$1,513
- − Management
- −$1,513
- − Depreciation
- −$1,076
- Taxable income
- $11,996
- Est. tax owed @ 24.0%
- −$2,879
- After-tax cash flow
- $8,992/yr
For passive investors: Depreciation is non-cash, so a rental often shows a tax loss while cash-flowing — sheltering income. Rental losses are passive: they offset passive income freely, and up to $25,000/yr can offset ordinary (W-2) income if you actively participate and your MAGI is under $100k (phasing out to $0 by $150k); unused losses carry forward. On sale, claimed depreciation is recaptured at up to 25%, and gains may owe capital-gains tax (a 1031 exchange can defer both). Figures are a year-1 estimate at your 24.0% rate — not tax advice; consult a CPA.
Condition & rehab AI · 3 photos
This home is in fair condition with cosmetic updates needed to enhance its resale and rental value.
Repairs flagged
- Minor Siding — Weathered appearance
- Minor Flooring — Worn condition
Value-add opportunities
- Both Paint interior walls — Fresh paint enhances curb appeal and interior aesthetics
- Both Replace worn flooring — New flooring improves comfort and value
- Both Paint exterior siding — Fresh paint improves curb appeal and reflects better
Renovation cost estimate screening
| Repair item | Severity | Est. cost |
|---|---|---|
| Siding · Weathered appearance | Minor | $500–3,000 |
| Flooring · Worn condition | Minor | $500–3,000 |
| Total estimated repair cost · 2 items | $1,000–6,000 |
Value-add ROI direction
- Both Paint interior walls — Fresh paint enhances curb appeal and interior aesthetics ↑
- Both Replace worn flooring — New flooring improves comfort and value ↑
- Both Paint exterior siding — Fresh paint improves curb appeal and reflects better ↑
ⓘ Cost ranges are severity-bucket heuristics (US national rule-of-thumb). Get contractor quotes + a written scope before underwriting a rehab budget.
Schools (NCES district)
- District
- Thomas County
- NCES district ID
- 1304890
- Math proficiency
- 27% ▼ -8.00%
- Reading proficiency
- 32% ▼ -3.00%
- Median HH income
- $41,341
- Composite
- 24.95/100
- National rank
- #7565
- State rank
- #97 of 174 in GA
Livability — Thomasville
- Score
- 71/100
- State rank
- #77
- US rank
- #6678
Category grades
Schools grade is shown separately in the Schools card above.
Census & demographics
- County
- Thomas County · 22,962 people
- City population
- 22,962
- Metro
- Thomasville, GA
- Population (ZIP)
- 22,962
- Household income
- $50,460
- Rent vs Own
- Severe rent burden
- 1059.0
Population outlook (Thomas County) Hauer SSP2
- Today (2025)
- 45,303 people
- By 2030
- 45,052 · -0.6%
- By 2040
- 44,034 · -2.8%
- By 2050
- 42,310 · -6.6%
- By 2075
- 37,569 · -17.1%
- By 2100
- 30,676 · -32.3%
Race, ethnicity, and origin ACS 2023
- Race & ethnicity
- Black 49% White 47% Two or more races 2% Hispanic / Latino 2%
- Common ancestry
- Slovak 2% Italian 1% Lithuanian 1%
- Foreign-born
- 2% · Canada
- Languages at home
- 96% English-only · Spanish 2%
Political lean MEDSL · Thomas
- 2024 margin
- Strong R (+24.1) · D 37.8% · R 61.9%
- 2008→2024 swing
- -8.3pp toward R · 2008: -15.8pp · 2024: -24.1pp
- All cycles
- 2024: R+24.1 2020: R+19.5 2016: R+21.8 2012: R+18.5 2008: R+15.8
Not yet ingested
- Civics
- —
Market trends
- HPI YoY
- ▼ -93.17%
- Current HPI
- 228.0107
- Rent YoY
- —
- Metro
- Thomasville, GA
- State GDP YoY
- ▲ 2.66%
- F500 in state
- 28
Industry mix (Fortune 500 HQ in GA)
| Industry | F500 HQs | Revenue |
|---|---|---|
| Paper / Packaging | 2 | $29B |
|
||
| Retail | 1 | $160B |
|
||
| Transportation / Logistics | 1 | $91B |
|
||
| Airlines | 1 | $62B |
|
||
| Consumer Goods | 1 | $47B |
|
||
| Utilities | 1 | $25B |
|
||
Cash-flow waterfall
monthlySold comps — $/sqft
last 12 mo · ≤1 miLoading sold comps…