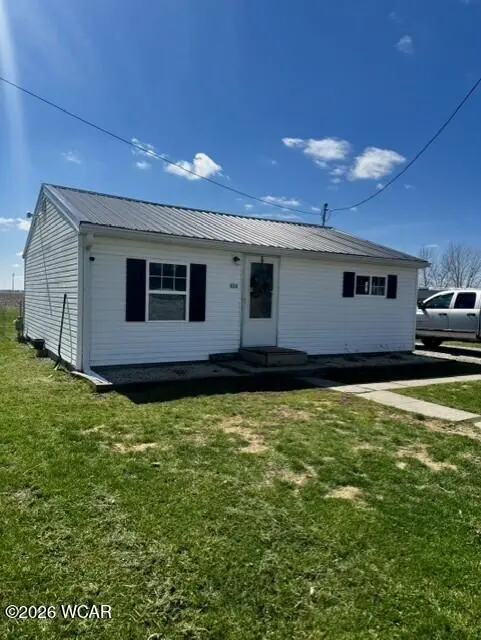
434 Haven St · Scott, OH
Flood risk 3/10 · Minor
- FEMA flood zone
- X (unshaded)
- Chance of flooding over 30 yrs
- 0.2%
- Est. flood insurance / yr
- $507 – $1,088
Fire risk 1/10 · Minimal
- Est. fire insurance / yr
- $713 – $1,323
Heat risk 3/10 · Minor
- Hot days now (above 100°F)
- 7 days/yr
- Hot days in 30 yrs
- 17 days/yr
Wind risk 2/10 · Minimal
- Chance of severe wind over 30 yrs
- 0.0%
Air-quality risk 2/10 · Minimal
- Unhealthy air days now
- 1 days/yr
- Unhealthy air days in 30 yrs
- 2 days/yr
Risk factors via First Street. Map © Google.
Why this score? — see what drove the B+ grade
The composite is a weighted blend of 9 inputs, each scored 0–100. Each bar is that input's sub-score; the figure is the points it added to the 100-point composite (weight × sub-score).
- Cash flow +26.7/30.0
- ARV discount +15.0/15.0
- DSCR +9.2/10.0
- Appreciation +8.7/10.0
- 1% rule +6.1/10.0
- Schools +5.7/10.0
- Livability +3.0/5.0
- Rent growth +2.5/5.0
- Condition / age +2.5/5.0
$75,000
🖨 Deal sheet 📄 Offer letter ✓ Due diligence
Listing remarks MLS
Cute starter home, located 10 minutes from Van Wert in Scott, Ohio. Corner lot, laminate flooring and roof 2017. New well 2026, septic repaired 2024, fresh paint 2025 and fenced yard.
Key facts
- Laminate flooring
- Roof 2017
- Corner lot
Tags
Neighborhood map
What this means for you Summary
Snapshot
- This is a 2-bed/1.0-bath single-family listed at $75k.
Deal economics
- At list price, monthly cash flow is $204 ($2k/yr) — positive.
- The deal already cash-flows at list — no discount required.
- Meets the 1% rule at list price ($829 rent vs $75k).
- Recommended offer: $73k (3.0% below list) — sets the bar for market timing.
Location & tenants
- Location reads 60/100 on livability (#997 in OH) — a middle-class / working-renter tenant base. Strengths: cost of living A+, housing A+; Watch: crime D, schools F, amenities F.
- Wayne Trace Local (rural): math 64% / reading 70% proficiency, ranked #188 of 656 in OH (top 29%) — acceptable for families but not a draw, mixed tenant base, ~2y average lease.
- Market conditions: 1 active listings in the ZIP; solid renter incomes; 44 units permitted in Van Wert County in 2024 (0 in 5+ unit buildings).
- This rent is only 12% of the median local income ($82k/yr) — well below the 30% rent-burden line; pricing power to push rent on renewal without tenant pushback.
Forward outlook
- In year one you build about $6k of equity ($519 loan paydown + $6k appreciation (7.5% local appreciation)).
- Van Wert County population projected at -11% by 2050 — secular population decline; favor cash flow + early exit over multi-decade hold.
- At projected returns (7.5% appreciation + 3.0% rent growth), your $21k cash investment doubles in ~3 years — after that, you're playing with house money.
- By year 6, paydown + projected appreciation supports a ~$34k cash-out refi (75% LTV) — recoverable capital for the next deal without selling this one.
Negotiation context
- It's been on market 57 days — a 3% lower offer ($73k) is reasonable based on typical stale-listing flexibility.
- Current owner paid $34k; list at $75k implies a 119% gain — meaningful room to come down on a strong offer.
Risks & watch-outs
- Watch-outs: built in 1900 — expect roof / HVAC / electrical / plumbing capex.
Questions for the listing agent
- It's been on market 57 days. Have you received any prior offers? Is the seller open to a 3% concession, seller financing, or rate buy-down credit?
- Built in 1900 — when were the roof, HVAC, electrical panel, plumbing, and water heater last replaced?
- Is there a deadline driving the sale (1031 exchange, divorce, estate, relocation)? That informs how much negotiation room exists.
- Schools are F-rated, which usually means shorter tenancies and higher turnover. Who's the typical renter profile here, and what's been the actual vacancy rate?
- Crime grade is D in this area — have there been break-ins, vandalism, or insurance claims at this property in the last 3 years? What carrier currently insures it and at what premium?
- What's the average days-on-market for RENTAL listings here right now (not sales)? A rising rental-DOM trend means longer vacancies and softer asking-rent achievability than the comps imply.
- What's the recent tenant-quality profile in this submarket — average credit score on applications, eviction rate, late-payment / NSF rate, and stable-employment percentage? A property-management company in the area should have these aggregated.
- How much new for-sale + rental construction is in the pipeline within 1–3 miles? Heavy new supply typically softens prices + rents 12–24 months out; constrained supply supports both.
Investment metrics
- 1% rule
- 1.11% ✓
- Cap rate
- 9.55%
- Cash-on-cash
- 11.64%
- DSCR
- 1.52
- GRM
- 7.5
CMA / ARV
- ARV (median comp)
- $95,783
- List price
- $75,000
- Delta
- -21.70%
- Verdict
- UNDERPRICED
- Comps
- 2 within 1.0 mi
Show comp detail 1 sale within ~0.75 mi
| Address | Dist | Beds/Ba | Sqft | Sold | Price | $/sf | Match |
|---|---|---|---|---|---|---|---|
| 434 Haven St | 0.00mi | 1/1.0 (-1) | 720 (0%) | 1mo | $65,000 | $90 | 94 |
Match score weights: distance 35% · size 25% · config 20% · recency 20%. Top-matched comps best support the ARV.
Projected returns pro-forma
7.5% appreciation · 3.0% rent growth · sell at horizon
- IRR
- 28.0%
- Equity multiple
- 2.97×
- Total profit
- $41,453
- Equity at exit
- $54,444
- IRR
- 25.3%
- Equity multiple
- 6.27×
- Total profit
- $110,569
- Equity at exit
- $105,739
Cash invested: $21,000 (down + closing). Projections, not guarantees.
Landlord ↔ Tenant lean methodology
- Overall (STATE)
- 73 Landlord-Friendly
- State Ohio
- 73 Landlord-Friendly · R+6
- County
- — inherits STATE
- City
- — inherits STATE
ZIP-level market 45886
- Home prices YoY
- 4.5%
- Active inventory
- 1
- Price-to-rent
- 7.5×
Monthly cashflow live
- Estimated rent
- $829 medium interval (Pro) →
- Mortgage (P&I)
- −$393
- Tax from tax record
- −$27 /mo · $325/yr
- Insurance
- −$31
- HOA
- −$0
- Vacancy / Maint / Mgmt
- −$174
- Net cashflow
- $204
Break-even live
UW: 25.0% down · 7.5% · 30yr · 1.5% tax · 5.0% vac · 8.0% maint · 8.0% mgmt
Financing live
Cash to close
- Down payment
- $18,750
- Closing costs
- $2,250
- Reserves months
- —
- Total cash needed
- —
Loan-product check · same deal, 3 products live
Conventional
25% down · 7.5% · 30yr
- Down + closing
- —
- Monthly P&I
- —
- Monthly cashflow
- —
- DSCR
- —
- Eligible?
- —
Personal DTI + credit; lowest rate.
DSCR
20% down · 8.5% · 30yr
- Down + closing
- —
- Monthly P&I
- —
- Monthly cashflow
- —
- DSCR
- —
- Eligible?
- —
No personal income docs; deal must DSCR.
Hard money
10% down · 12.0% · 12mo
- Down + closing
- —
- Monthly P&I
- —
- Monthly cashflow
- —
- DSCR
- —
- Eligible?
- —
Short-term bridge; refi at stabilization.
Listing history 3 events
-
2026-05-12status Pending 183-char remark
Show marketing remark (183 chars)
Cute starter home, located 10 minutes from Van Wert in Scott, Ohio. Corner lot, laminate flooring and roof 2017. New well 2026, septic repaired 2024, fresh paint 2025 and fenced yard.
-
2026-03-15$75,000 Active 183-char remark
Show marketing remark (183 chars)
Cute starter home, located 10 minutes from Van Wert in Scott, Ohio. Corner lot, laminate flooring and roof 2017. New well 2026, septic repaired 2024, fresh paint 2025 and fenced yard.
-
2021-05-28soldstatus $34,300
ⓘ Source: listings_history table (triggers on properties + properties_extension) + one-shot
backfill from property_details.listing_events for pre-trigger history.
Tax reassessment forecast OH · Partial reset (capped growth)
- Current annual tax
- $325 · $27/mo
- Projected year-2 tax
- $747 · $62/mo
- Expected delta
- +$423/yr (+$35/mo · 130.0%)
ⓘ Screening estimate from a state-policy table — verify with the county assessor before closing.
Climate risk First Street
- Flood 3/10 Moderate FEMA zone X (unshaded) · 20% chance over 30 yrs
- Wildfire 1/10 Low
- Heat 3/10 Moderate 7 d/yr ≥100°F today · 17 d/yr by 30 yrs out
- Wind 2/10 Low 0% chance of damaging wind over 30 yrs
- Air quality 2/10 Low 1 unhealthy d/yr today · 2 by 30 yrs out
Nearby sold comps map
Loading sold comps map…
Walkable amenities ~0.75 mi
Loading nearby amenities…
Taxation est. · year 1
- Rental income
- $9,953
- − Mortgage interest
- −$4,201
- − Property taxes
- −$325
- − Insurance
- −$375
- − Repairs & maintenance
- −$796
- − Management
- −$796
- − Depreciation
- −$2,182
- Taxable income
- $1,278
- Est. tax owed @ 24.0%
- −$307
- After-tax cash flow
- $2,137/yr
For passive investors: Depreciation is non-cash, so a rental often shows a tax loss while cash-flowing — sheltering income. Rental losses are passive: they offset passive income freely, and up to $25,000/yr can offset ordinary (W-2) income if you actively participate and your MAGI is under $100k (phasing out to $0 by $150k); unused losses carry forward. On sale, claimed depreciation is recaptured at up to 25%, and gains may owe capital-gains tax (a 1031 exchange can defer both). Figures are a year-1 estimate at your 24.0% rate — not tax advice; consult a CPA.
Schools (NCES district)
- District
- Wayne Trace Local
- NCES district ID
- 3904903
- Math proficiency
- 64% ▼ -10.00%
- Reading proficiency
- 70% ▼ -4.00%
- Median HH income
- $47,643
- Composite
- 56.63/100
- National rank
- #1140
- State rank
- #188 of 656 in OH
Livability — Scott
- Score
- 60/100
- State rank
- #997
- US rank
- #19563
Category grades
Schools grade is shown separately in the Schools card above.
Census & demographics
- Census place
- Scott, OH
- County
- Paulding · 17,531 people
- Population (ZIP)
- 422
- Household income
- $81,607
- Rent vs Own
- Severe rent burden
- 19.4
Population outlook (Van Wert County) Hauer SSP2
- Today (2025)
- 28,235 people
- By 2030
- 27,793 · -1.6%
- By 2040
- 26,650 · -5.6%
- By 2050
- 25,251 · -10.6%
- By 2075
- 22,247 · -21.2%
- By 2100
- 18,559 · -34.3%
Race, ethnicity, and origin ACS 2023
- Neighborhood character
- Predominantly White (96%)
- Race & ethnicity
- White 96% Two or more races 2% Hispanic / Latino 1%
- Common ancestry
- Iranian 4%
- Foreign-born
- 0% · Canada
Political lean MEDSL · Van Wert
- 2024 margin
- Solid R (+58.5) · D 20.4% · R 78.9%
- 2008→2024 swing
- -31.3pp toward R · 2008: -27.2pp · 2024: -58.5pp
- All cycles
- 2024: R+58.5 2020: R+57.4 2016: R+56.4 2012: R+40.5 2008: R+27.2
Not yet ingested
- Civics
- —
Market trends
- HPI YoY
- ▲ 7.50%
- Current HPI
- 173.3674
- Rent YoY
- —
- Metro
- —
- State GDP YoY
- ▲ 1.98%
- F500 in state
- 48
Industry mix (Fortune 500 HQ in OH)
| Industry | F500 HQs | Revenue |
|---|---|---|
| Insurance | 3 | $145B |
|
||
| Industrial Machinery | 3 | $49B |
|
||
| Financial Services | 3 | $24B |
|
||
| Consumer Goods | 2 | $93B |
|
||
| Aerospace / Defense | 2 | $47B |
|
||
| Utilities | 2 | $33B |
|
||
Price history
+118.7% since first listed3 events — show timeline
- 2026-05-12 Pending — WCARE
- 2026-03-15 Listed $75,000 WCARE
- 2021-05-28 Sold (Public Records) $34,300 Public Records
Property tax history
-1.1%/yrLatest (2025): $325 · -0.6% YoY. Source: county tax records.
Cash-flow waterfall
monthlySold comps — $/sqft
last 12 mo · ≤1 miLoading sold comps…