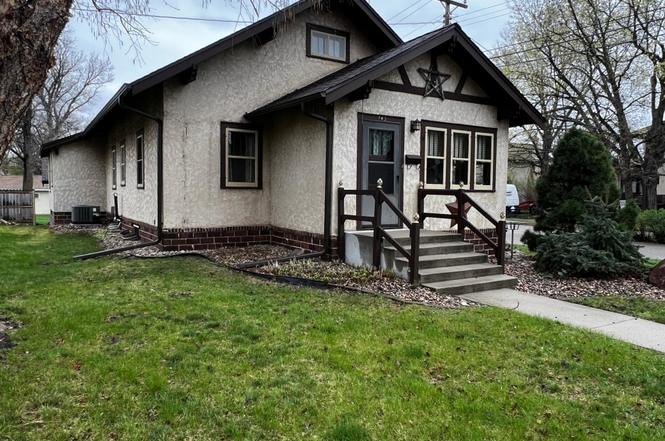
743 3rd St · Granite Falls, MN
Flood risk 1/10 · Minimal
- FEMA flood zone
- X (unshaded)
- Chance of flooding over 30 yrs
- 0.0%
- Est. flood insurance / yr
- $473 – $860
Fire risk 3/10 · Minor
- Est. fire insurance / yr
- $888 – $1,650
Heat risk 3/10 · Minor
- Hot days now (above 100°F)
- 7 days/yr
- Hot days in 30 yrs
- 14 days/yr
Wind risk 2/10 · Minimal
- Chance of severe wind over 30 yrs
- —
Air-quality risk 2/10 · Minimal
- Unhealthy air days now
- 1 days/yr
- Unhealthy air days in 30 yrs
- 1 days/yr
Risk factors via First Street. Map © Google.
Why this score? — see what drove the D grade
The composite is a weighted blend of 9 inputs, each scored 0–100. Each bar is that input's sub-score; the figure is the points it added to the 100-point composite (weight × sub-score).
- Appreciation +10.0/10.0
- Cash flow +9.3/30.0
- ARV discount +7.5/15.0
- Livability +3.8/5.0
- Schools +3.4/10.0
- DSCR +2.6/10.0
- Rent growth +2.5/5.0
- Condition / age +2.5/5.0
- 1% rule +1.9/10.0
$142,400
🖨 Deal sheet 📄 Offer letter ✓ Due diligence
Listing remarks
This cozy Bungalow style home welcomes you with a nice foyer with closet, large living room/dining room, three bedrooms, 2 bathrooms, nice kitchen and back entryway on the main floor. The home is located in a convenient location being close to the school, hospital and downtown. Inside you will find a well designed and welcoming layout that provides comfortable living spaces, perfect for families, downsizers or first time buyers alike. Recent updates include new shingles 2025, Central Air and Forced Air Furnace in 2024. Oak Hardwood Floors in all Bedrooms. Opportunity to finish off the attic space into an additional bedroom with ensuite, additional living space or storage. If a buyer would
Key facts
- 4,600 sq ft lot
- 2 garage spots
- Built 1926
Property features AI
Exterior
- Parking: 2-car garage with garage door opener (garage ~12' x 36")
- Utilities: City water connected; City sewer connected; Natural gas; Electric service with circuit breakers, 100 Amp
- Home design: Residential property; One and one-half stories; Walk-up attic
- Construction: Brick and concrete construction materials; Asphalt roof (age 8 years or less); Brick/mortar foundation; Foundation dimensions ~32' x 25'
- Exterior features: Stucco exterior; Light tree coverage; Patio; City street frontage with curb, paved streets, sidewalks, street lights and storm sewer
Interior
- Kitchen: Range; Microwave; Refrigerator; Freezer; Kitchen window
- Bedrooms: 3 bedrooms on one level; Main floor bedrooms (3 total); Bedroom sizes on main level: 11'6" x 11'1", 11' x 10', 13'2" x 12'11"
- Flooring: Hardwood floors
- Bathrooms: Main floor full bath (shower only); Main floor half bath; Basement bathroom
- Heating & cooling: Forced air heating; Central air conditioning
- Interior features: Living/Dining room; Main floor primary bedroom; Natural woodwork; Kitchen window; Patio; Walk-up attic; Full, unfinished concrete basement
- Laundry & utility: Washer; Dryer; Laundry in basement with utility sink; Electric water heater
Neighborhood map
What this means for you Summary
Snapshot
- This is a 3-bed/3.0-bath single-family listed at $142k.
Deal economics
- At list price, monthly cash flow is $-105 ($-1k/yr) — negative.
- To cash-flow at today's rent, offer at most $124k (13.0% below list).
- To meet the 1% rule (rent ≥ 1% of price), the offer needs to be $99k (30.8% below list).
- Recommended offer: $99k (30.8% below list) — sets the bar for 1% rule.
Location & tenants
- Location reads 75/100 on livability (#183 in MN, #3,945 nationally) — a middle-class / working-renter tenant base. Strengths: cost of living A+, housing A+, health & safety A+; Watch: schools C-, amenities F, commute F.
- Yellow Medicine East (town): math 31% / reading 47% proficiency, ranked #227 of 301 in MN (top 75%) — families likely to look elsewhere, expect single-tenant / working-renter base with shorter leases.
- Market conditions: 23 active listings in the ZIP; 7 units permitted in Yellow Medicine County in 2024 (0 in 5+ unit buildings).
Forward outlook
- In year one you build about $15k of equity ($985 loan paydown + $14k appreciation (10.0% local appreciation)).
- Yellow Medicine County population projected at -26% by 2050 — secular population decline; favor cash flow + early exit over multi-decade hold.
- By year 3, paydown + projected appreciation supports a ~$39k cash-out refi (75% LTV) — recoverable capital for the next deal without selling this one.
Negotiation context
- It's been on market 151 days — a 12% lower offer ($125k) is reasonable based on typical stale-listing flexibility.
Risks & watch-outs
- Watch-outs: built in 1926 — expect roof / HVAC / electrical / plumbing capex.
Questions for the listing agent
- What do current leases actually rent for vs. the listed asking? Can we see a recent rent roll and the last 12 months of T-12 income?
- It's been on market 151 days. Have you received any prior offers? Is the seller open to a 31% concession, seller financing, or rate buy-down credit?
- Built in 1926 — when were the roof, HVAC, electrical panel, plumbing, and water heater last replaced?
- Why hasn't it sold? Are there any deal-killer items the seller is aware of (foundation, flood, title, zoning, code violations)?
- Is there a deadline driving the sale (1031 exchange, divorce, estate, relocation)? That informs how much negotiation room exists.
- The area grade is low — what's the realistic commute time and amenity access for the typical tenant pool here? Any planned neighborhood developments (good or bad) we should know about?
- What's the average days-on-market for RENTAL listings here right now (not sales)? A rising rental-DOM trend means longer vacancies and softer asking-rent achievability than the comps imply.
- What's the recent tenant-quality profile in this submarket — average credit score on applications, eviction rate, late-payment / NSF rate, and stable-employment percentage? A property-management company in the area should have these aggregated.
- How much new for-sale + rental construction is in the pipeline within 1–3 miles? Heavy new supply typically softens prices + rents 12–24 months out; constrained supply supports both.
Investment metrics
- 1% rule
- 0.69% ✗
- Cap rate
- 5.41%
- Cash-on-cash
- -3.16%
- DSCR
- 0.86
- GRM
- 12.0
CMA / ARV
No comps found within radius.
Projected returns pro-forma
10.0% appreciation · 3.0% rent growth · sell at horizon
- IRR
- 22.0%
- Equity multiple
- 2.78×
- Total profit
- $70,820
- Equity at exit
- $128,285
- IRR
- 19.8%
- Equity multiple
- 6.36×
- Total profit
- $213,718
- Equity at exit
- $276,652
Cash invested: $39,872 (down + closing). Projections, not guarantees.
Landlord ↔ Tenant lean methodology
- Overall (STATE)
- 46 Balanced
- State Minnesota
- 46 Balanced · D+2
- County
- — inherits STATE
- City
- — inherits STATE
ZIP-level market 56241
- Home prices YoY
- 8.8%
- Active inventory
- 23
- Price-to-rent
- 12.0×
Monthly cashflow live
- Estimated rent
- $985 medium interval (Pro) →
- Mortgage (P&I)
- −$747
- Tax from tax record
- −$77 /mo · $928/yr
- Insurance
- −$59
- HOA
- −$0
- Vacancy / Maint / Mgmt
- −$207
- Net cashflow
- $-105
Break-even live
UW: 25.0% down · 7.5% · 30yr · 1.5% tax · 5.0% vac · 8.0% maint · 8.0% mgmt
Financing live
Cash to close
- Down payment
- $35,600
- Closing costs
- $4,272
- Reserves months
- —
- Total cash needed
- —
Loan-product check · same deal, 3 products live
Conventional
25% down · 7.5% · 30yr
- Down + closing
- —
- Monthly P&I
- —
- Monthly cashflow
- —
- DSCR
- —
- Eligible?
- —
Personal DTI + credit; lowest rate.
DSCR
20% down · 8.5% · 30yr
- Down + closing
- —
- Monthly P&I
- —
- Monthly cashflow
- —
- DSCR
- —
- Eligible?
- —
No personal income docs; deal must DSCR.
Hard money
10% down · 12.0% · 12mo
- Down + closing
- —
- Monthly P&I
- —
- Monthly cashflow
- —
- DSCR
- —
- Eligible?
- —
Short-term bridge; refi at stabilization.
Listing history 17 events
-
2026-06-18days on market $142,400 Active 151 DOM
-
2026-06-17days on market $142,400 Active 150 DOM
-
2026-06-16days on market $142,400 Active 149 DOM
-
2026-06-15days on market $142,400 Active 148 DOM
-
2026-06-13days on market $142,400 Active 146 DOM
-
2026-06-12days on market $142,400 Active 145 DOM
-
2026-06-09days on market $142,400 Active 142 DOM
-
2026-06-08days on market $142,400 Active 141 DOM
-
2026-06-07days on market $142,400 Active 140 DOM
-
2026-06-05days on market $142,400 Active 138 DOM
-
2026-06-04days on market $142,400 Active 136 DOM
-
2026-06-02days on market $142,400 Active 135 DOM
-
2026-06-01days on market $142,400 Active 134 DOM
-
2026-05-31days on market $142,400 Active 133 DOM
-
2026-05-14price $142,400
-
2026-01-19$149,900 Active
-
2026-01-17historical $149,900
ⓘ Source: listings_history table (triggers on properties + properties_extension) + one-shot
backfill from property_details.listing_events for pre-trigger history.
Tax reassessment forecast MN · Partial reset (capped growth)
- Current annual tax
- $928 · $77/mo
- Projected year-2 tax
- $1,261 · $105/mo
- Expected delta
- +$333/yr (+$28/mo · 35.9%)
ⓘ Screening estimate from a state-policy table — verify with the county assessor before closing.
Climate risk First Street
- Flood 1/10 Low FEMA zone X (unshaded) · 0% chance over 30 yrs
- Wildfire 3/10 Moderate
- Heat 3/10 Moderate 7 d/yr ≥100°F today · 14 d/yr by 30 yrs out
- Wind 2/10 Low
- Air quality 2/10 Low 1 unhealthy d/yr today · 1 by 30 yrs out
Nearby sold comps map
Loading sold comps map…
Walkable amenities ~0.75 mi
Loading nearby amenities…
Taxation est. · year 1
- Rental income
- $11,824
- − Mortgage interest
- −$7,977
- − Property taxes
- −$928
- − Insurance
- −$712
- − Repairs & maintenance
- −$946
- − Management
- −$946
- − Depreciation
- −$4,143
- Taxable loss
- −$3,827
- Est. tax savings @ 24.0%
- +$918
- After-tax cash flow
- $-342/yr
For passive investors: Depreciation is non-cash, so a rental often shows a tax loss while cash-flowing — sheltering income. Rental losses are passive: they offset passive income freely, and up to $25,000/yr can offset ordinary (W-2) income if you actively participate and your MAGI is under $100k (phasing out to $0 by $150k); unused losses carry forward. On sale, claimed depreciation is recaptured at up to 25%, and gains may owe capital-gains tax (a 1031 exchange can defer both). Figures are a year-1 estimate at your 24.0% rate — not tax advice; consult a CPA.
Schools (NCES district)
- District
- Yellow Medicine East
- NCES district ID
- 2700099
- Math proficiency
- 31% ▼ -7.00%
- Reading proficiency
- 47% ▼ -7.00%
- Median HH income
- $51,457
- Composite
- 33.74/100
- National rank
- #5369
- State rank
- #227 of 301 in MN
Livability — Granite Falls
- Score
- 75/100
- State rank
- #183
- US rank
- #3945
Category grades
Schools grade is shown separately in the Schools card above.
Census & demographics
- Census place
- Granite Falls, MN
- Population (ZIP)
- 3,829
Population outlook (Yellow Medicine County) Hauer SSP2
- Today (2025)
- 8,959 people
- By 2030
- 8,451 · -5.7%
- By 2040
- 7,514 · -16.1%
- By 2050
- 6,650 · -25.8%
- By 2075
- 5,306 · -40.8%
- By 2100
- 4,453 · -50.3%
Race, ethnicity, and origin ACS 2023
- Neighborhood character
- Predominantly White (79%)
- Race & ethnicity
- White 79% Hispanic / Latino 9% Native American 9% Two or more races 5% Black 1%
- Hispanic origin (detail)
- Mexican 4%
- Common ancestry
- Portuguese 32% Romanian 3% Iranian 2%
- Foreign-born
- 3% · Canada
- Languages at home
- 95% English-only · Spanish 4% Russian/Polish/Slavic 1%
Political lean MEDSL · Yellow Medicine
- 2024 margin
- Solid R (+40.6) · D 28.7% · R 69.3% · Other 1.9%
- 2008→2024 swing
- -44.9pp toward R · 2008: 4.3pp · 2024: -40.6pp
- All cycles
- 2024: R+40.6 2020: R+37.0 2016: R+35.4 2012: R+6.3 2008: D+4.3
Not yet ingested
- Civics
- —
Market trends
- HPI YoY
- ▲ 27.19%
- Current HPI
- 335.94
- Rent YoY
- —
- Metro
- —
- State GDP YoY
- ▲ 2.41%
- F500 in state
- 34
Industry mix (Fortune 500 HQ in MN)
| Industry | F500 HQs | Revenue |
|---|---|---|
| Healthcare | 2 | $407B |
|
||
| Retail | 2 | $150B |
|
||
| Consumer Goods | 2 | $32B |
|
||
| Industrial Machinery | 2 | $6B |
|
||
| Agriculture | 1 | $40B |
|
||
| Healthcare / Medical Devices | 1 | $32B |
|
||
Price history
-5.0% since first listed3 events — show timeline
- 2026-05-14 Price Changed $142,400 NORTHSTARMLS as Distributed by MLS Grid
- 2026-01-19 Listed $149,900 NORTHSTARMLS as Distributed by MLS Grid
- 2026-01-17 Coming Soon $149,900 NORTHSTARMLS as Distributed by MLS Grid
Property tax history
+2.7%/yrLatest (2025): $928 · +46.8% YoY. Source: county tax records.
Cash-flow waterfall
monthlySold comps — $/sqft
last 12 mo · ≤1 miLoading sold comps…