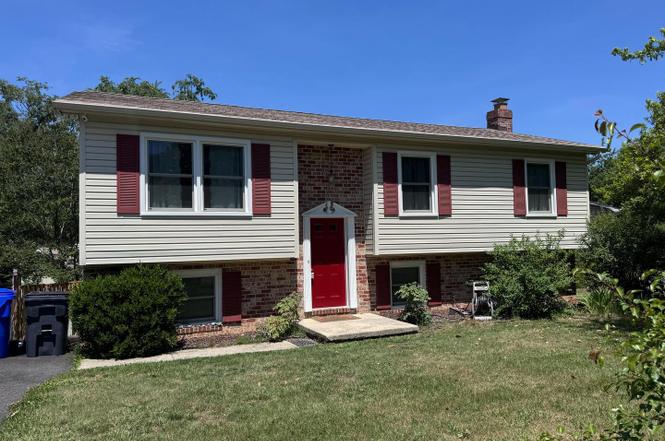
12208 Wendy Ln · Waldorf, MD
Flood risk 1/10 · Minimal
- FEMA flood zone
- X (unshaded)
- Chance of flooding over 30 yrs
- 0.0%
- Est. flood insurance / yr
- $473 – $860
Fire risk 3/10 · Minor
- Est. fire insurance / yr
- $755 – $1,403
Heat risk 8/10 · Major
- Hot days now (above 102°F)
- 7 days/yr
- Hot days in 30 yrs
- 16 days/yr
Wind risk 6/10 · Moderate
- Chance of severe wind over 30 yrs
- 27.0%
Air-quality risk 2/10 · Minimal
- Unhealthy air days now
- 1 days/yr
- Unhealthy air days in 30 yrs
- 2 days/yr
Risk factors via First Street. Map © Google.
Why this score? — see what drove the C- grade
The composite is a weighted blend of 9 inputs, each scored 0–100. Each bar is that input's sub-score; the figure is the points it added to the 100-point composite (weight × sub-score).
- Cash flow +16.2/30.0
- ARV discount +15.0/15.0
- DSCR +5.0/10.0
- 1% rule +4.4/10.0
- Livability +3.6/5.0
- Rent growth +3.3/5.0
- Condition / age +2.5/5.0
- Schools +2.3/10.0
- Appreciation +0.0/10.0
$299,900
🖨 Deal sheet 📄 Offer letter ✓ Due diligence
Listing remarks
Terrific investment opportunity to own this home in Northern Waldorf. Convenient location near shopping, restaurants and easy commute to Washington DC and Joint Base Andrews. Home needs a little TLC -to make it shine - But in overall good condition. House is sold AS-IS condition. Big fenced yard, shed, and has hardwood floors on upper level - basement is unfinished - there is a commode in basement and roughed in plumbing for a full bath. There's plenty of parking in oversized driveway and in a nice setting.
Key facts
- Roughed in plumbing
- Plenty of parking
- Big fenced yard
Tags
Property features AI
Finance
- HOA & community: Ground rent paid annually
Exterior
- Parking: Driveway parking (8 spaces); Off-street parking — total of 8 garage/parking spaces
- Utilities: Public water; Public sewer; Electric hot water; Electric heating and cooling
- Home design: Detached property; Property in good condition; Fee simple ownership
- Construction: Vinyl siding; Asphalt roof; Slab foundation; Building not winterized; Basement: unfinished walkout level with rough bath plumbing (100% footprint)
- Exterior features: Gutter system; Patio; Outbuilding(s); Shed; Cleared lot; Fencing: masonry/stone, rear, and wood
Interior
- Kitchen: Electric oven/range; Range hood; Refrigerator; Garbage disposal; Exhaust fan
- Bedrooms: Three bedrooms on the main level
- Flooring: Carpet; Hardwood; Vinyl; Concrete
- Bathrooms: One full bathroom on the main level; One half bathroom on a lower level
- Heating & cooling: Heat pump heating; Central air conditioning; Electric-powered cooling and heating
- Interior features: Dry wall walls and ceilings; Free-standing wood fireplace (1)
- Laundry & utility: Washer and dryer (electric); Front-loading dryer; Stacked washer/dryer configuration; Electric water heater
Neighborhood map
What this means for you Summary
Snapshot
- This is a 3-bed/1.5-bath single-family listed at $300k.
Deal economics
- At list price, monthly cash flow is $156 ($2k/yr) — positive.
- The deal already cash-flows at list — no discount required.
- To meet the 1% rule (rent ≥ 1% of price), the offer needs to be $281k (6.4% below list).
- Recommended offer: $281k (6.4% below list) — sets the bar for 1% rule.
- Cap rate 6.9% vs local median 4.8% in Waldorf — top-decile yield for the area; either an underpriced asset or a hidden risk that comps aren't pricing in. Stress-test before assuming the spread holds.
Location & tenants
- Location reads 72/100 on livability (#141 in MD) — a middle-class / working-renter tenant base. Strengths: commute A+, employment A+, housing A+; Watch: crime D-, amenities F, cost of living F.
- Charles County Public Schools (suburban): math 13% / reading 29% proficiency, ranked #14 of 24 in MD (top 58%) — low school quality limits family demand, transient renter base, plan for 1-2y turnover.
- Zoned schools: C. Paul Barnhart Elementary School (math 12% / reading 17%, grade F, #477 of 860 statewide, top 59%, 575 students, 56% FRL); Mattawoman Middle School (math 8% / reading 29%, grade F, #159 of 225 statewide, top 73%, 934 students, 48% FRL); Thomas Stone High School (math 13% / reading 35%, grade F, #168 of 222 statewide, top 76%, 1,177 students, 61% FRL) — zoned schools average 55% FRL vs 28% district-wide (28 pts higher); higher-poverty schools than district average — tighter screening recommended.
- Market conditions: Rents rising (+3.4%/yr); 181 active listings in the ZIP; 14 comparable units currently listed for rent nearby; rentals at typical pace (median 25d on market — plan ~3-4 weeks tenant-placement turnaround); 43% of comp listings sitting > 30 days — soft ceiling on asking rent; high-income renter base; 1,542 units permitted in Charles County in 2024 (516 in 5+ unit buildings).
Forward outlook
- Local home prices are declining (-3.0%/yr); year-one equity from $2k of loan paydown is wiped out by about $9k of value loss. Plan a longer hold.
- Charles County population projected at +27% by 2050 — long-run rental-demand tailwind backs the buy-and-hold thesis.
Negotiation context
- Only 1 days on market — expect competitive offers; lowballing is unlikely to land.
- Current owner paid $88k; list at $300k implies a 241% gain — meaningful room to come down on a strong offer.
Risks & watch-outs
- Climate carrying-cost: major wind risk, 27% chance of damaging wind over 30y; extreme-heat days projected 7→16/yr by 2055 (HVAC capex compounding) — expect insurance premiums to compound above CPI over the hold.
Questions for the listing agent
- Is there a deadline driving the sale (1031 exchange, divorce, estate, relocation)? That informs how much negotiation room exists.
- Schools are D-rated, which usually means shorter tenancies and higher turnover. Who's the typical renter profile here, and what's been the actual vacancy rate?
- Crime grade is D in this area — have there been break-ins, vandalism, or insurance claims at this property in the last 3 years? What carrier currently insures it and at what premium?
- What's the average days-on-market for RENTAL listings here right now (not sales)? A rising rental-DOM trend means longer vacancies and softer asking-rent achievability than the comps imply.
- What's the recent tenant-quality profile in this submarket — average credit score on applications, eviction rate, late-payment / NSF rate, and stable-employment percentage? A property-management company in the area should have these aggregated.
- How much new for-sale + rental construction is in the pipeline within 1–3 miles? Heavy new supply typically softens prices + rents 12–24 months out; constrained supply supports both.
Investment metrics
- 1% rule
- 0.94% ✗
- Cap rate
- 6.92%
- Cash-on-cash
- 2.24%
- DSCR
- 1.10
- GRM
- 8.9
CMA / ARV
- ARV (on-the-fly)
- $406,300
- Comps found
- 12
Show comp detail 12 sales within ~0.75 mi
| Address | Dist | Beds/Ba | Sqft | Sold | Price | $/sf | Match |
|---|---|---|---|---|---|---|---|
| 12276 Wendy Ln | 0.21mi | 3/3.0 | 1,704 (+0%) | 1mo | $414,900 | $243 | 83 |
| 2015 Wendy Ct | 0.17mi | 3/2.5 | 1,792 (+5%) | 11mo | $395,000 | $220 | 69 |
| 2116 Bell Tree Ln | 0.15mi | 3/3.0 | 1,814 (+7%) | 11mo | $455,000 | $251 | 66 |
| 2200 Holly Oak Ct | 0.57mi | 3/2.0 | 1,560 (-8%) | 3mo | $373,000 | $239 | 55 |
| 1914 Black Oak Ct | 0.68mi | 4/3.0 (+1) | 1,728 (+2%) | 3mo | $449,000 | $260 | 52 |
| 2414 Shade Oak Ct | 0.73mi | 4/3.0 (+1) | 1,728 (+2%) | 1mo | $365,000 | $211 | 52 |
| 2011 English Oak Ct | 0.63mi | 4/3.0 (+1) | 1,728 (+2%) | 9mo | $409,900 | $237 | 50 |
| 2002 English Oak | 0.59mi | 4/2.0 (+1) | 1,580 (-7%) | 7mo | $408,000 | $258 | 48 |
| 2213 Holly Oak Ct | 0.67mi | 4/2.0 (+1) | 1,640 (-4%) | 12mo | $410,000 | $250 | 46 |
| 2204 Holly Oak Ct | 0.60mi | 4/3.0 (+1) | 1,848 (+9%) | 1mo | $375,000 | $203 | 46 |
| 2212 Holly Oak Ct | 0.65mi | 4/3.0 (+1) | 1,560 (-8%) | 1mo | $350,000 | $224 | 44 |
| 1909 Black Oak Ct | 0.61mi | 4/3.0 (+1) | 1,796 (+6%) | 11mo | $425,000 | $237 | 42 |
Match score weights: distance 35% · size 25% · config 20% · recency 20%. Top-matched comps best support the ARV.
Projected returns pro-forma
-3.0% appreciation · 3.37% rent growth · sell at horizon
- IRR
- -12.3%
- Equity multiple
- 0.55×
- Total profit
- $-37,546
- Equity at exit
- $44,716
- IRR
- -2.7%
- Equity multiple
- 0.82×
- Total profit
- $-15,380
- Equity at exit
- $25,930
Cash invested: $83,972 (down + closing). Projections, not guarantees.
Landlord ↔ Tenant lean methodology
- Overall (STATE)
- 27 Tenant-Leaning
- State Maryland
- 27 Tenant-Leaning · D+14
- County
- — inherits STATE
- City
- — inherits STATE
ZIP-level market 20601
- Home prices YoY
- -24.2%
- Rents YoY
- 3.4%
- Active inventory
- 181
- Price-to-rent
- 8.9×
Monthly cashflow live
- Estimated rent
- $2,807 high interval (Pro) →
- Mortgage (P&I)
- −$1,573
- Tax from tax record
- −$364 /mo · $4,364/yr
- Insurance
- −$125
- HOA
- −$0
- Vacancy / Maint / Mgmt
- −$590
- Net cashflow
- $156
Break-even live
UW: 25.0% down · 7.5% · 30yr · 1.5% tax · 5.0% vac · 8.0% maint · 8.0% mgmt
Financing live
Cash to close
- Down payment
- $74,975
- Closing costs
- $8,997
- Reserves months
- —
- Total cash needed
- —
Loan-product check · same deal, 3 products live
Conventional
25% down · 7.5% · 30yr
- Down + closing
- —
- Monthly P&I
- —
- Monthly cashflow
- —
- DSCR
- —
- Eligible?
- —
Personal DTI + credit; lowest rate.
DSCR
20% down · 8.5% · 30yr
- Down + closing
- —
- Monthly P&I
- —
- Monthly cashflow
- —
- DSCR
- —
- Eligible?
- —
No personal income docs; deal must DSCR.
Hard money
10% down · 12.0% · 12mo
- Down + closing
- —
- Monthly P&I
- —
- Monthly cashflow
- —
- DSCR
- —
- Eligible?
- —
Short-term bridge; refi at stabilization.
Rent comps 14 comps
| Address | Beds | Baths | Sqft | Rent | $/sqft | DOM | Units | Dist |
|---|---|---|---|---|---|---|---|---|
| 3001 Hollins Ln Waldorf, MD | 2.0–3.0 | 1.0–2.0 | 1100 | $2,484 | $2.26 | 3d | 35 | 0.56mi |
| 374 Trefoil Pl Waldorf, MD | 3.0 | 1.5 | 1160 | $2,300 | $1.98 | 44d | 1 | 0.72mi |
| 374 Trefoil Pl Waldorf, MD | 3.0 | 1.5 | 1160 | $2,350 | $2.03 | 24d | 1 | 0.72mi |
| 11753 Tiffen Ct Waldorf, MD | 3.0 | 2.0 | 1792 | $2,695 | $1.50 | 22d | 1 | 0.83mi |
| 16605 Green Glade Dr Brandywine, MD | 4.0 | 3.5 | 1480 | $3,400 | $2.30 | 17d | 1 | 0.90mi |
| 2346 Hazelwood Ct Waldorf, MD | 3.0 | 2.5 | 1349 | $2,700 | $2.00 | 24d | 1 | 0.91mi |
| 2050 Nike Dr Unit 11 Waldorf, MD | 3.0 | 1.5 | 1265 | $2,600 | $2.06 | 24d | 1 | 0.92mi |
| 2050 Nike Dr Unit 3 Waldorf, MD | 3.0 | 1.5 | 1265 | $2,395 | $1.89 | 44d | 1 | 0.92mi |
| 11565 Timberbrook Dr Waldorf, MD | 4.0 | 2.0 | 1248 | $2,700 | $2.16 | 44d | 1 | 0.93mi |
| 2445 Sagewood Ct Waldorf, MD | 3.0 | 3.0 | 1296 | $2,450 | $1.89 | 44d | 1 | 0.97mi |
| 7530 Day Break Dr Brandywine, MD | 3.0 | 3.5 | 1969 | $3,500 | $1.78 | 1d | 1 | 0.99mi |
| 3506 Lisa Ln Waldorf, MD | 4.0 | 2.0 | 1822 | $2,950 | $1.62 | 44d | 1 | 1.10mi |
| 11526 Timberbrook Dr Waldorf, MD | 4.0 | 2.5 | 1970 | $3,400 | $1.73 | 44d | 1 | 1.18mi |
| 1314 Harwich Dr Waldorf, MD | 4.0 | 2.0 | 1974 | $3,995 | $2.02 | 1d | 1 | 1.38mi |
Listing history 3 events
-
2026-06-18remarks 518-char remark
-
2026-06-18remarks 486-char remark
-
2026-06-18$299,900 Active 1 DOM
ⓘ Source: listings_history table (triggers on properties + properties_extension) + one-shot
backfill from property_details.listing_events for pre-trigger history.
Tax reassessment forecast MD · Partial reset (capped growth)
- Current annual tax
- $4,364 · $364/mo
- Projected year-2 tax
- $4,364 · $364/mo
- Expected delta
- $0/yr ($0/mo · 0.0%)
ⓘ Screening estimate from a state-policy table — verify with the county assessor before closing.
Climate risk First Street
- Flood 1/10 Low FEMA zone X (unshaded) · 0% chance over 30 yrs
- Wildfire 3/10 Moderate
- Heat 8/10 Severe 7 d/yr ≥102°F today · 16 d/yr by 30 yrs out
- Wind 6/10 Major 27% chance of damaging wind over 30 yrs
- Air quality 2/10 Low 1 unhealthy d/yr today · 2 by 30 yrs out
Nearby sold comps map
Loading sold comps map…
Walkable amenities ~0.75 mi
Loading nearby amenities…
Taxation est. · year 1
- Rental income
- $33,689
- − Mortgage interest
- −$16,799
- − Property taxes
- −$4,364
- − Insurance
- −$1,500
- − Repairs & maintenance
- −$2,695
- − Management
- −$2,695
- − Depreciation
- −$8,724
- Taxable loss
- −$3,089
- Est. tax savings @ 24.0%
- +$741
- After-tax cash flow
- $2,619/yr
For passive investors: Depreciation is non-cash, so a rental often shows a tax loss while cash-flowing — sheltering income. Rental losses are passive: they offset passive income freely, and up to $25,000/yr can offset ordinary (W-2) income if you actively participate and your MAGI is under $100k (phasing out to $0 by $150k); unused losses carry forward. On sale, claimed depreciation is recaptured at up to 25%, and gains may owe capital-gains tax (a 1031 exchange can defer both). Figures are a year-1 estimate at your 24.0% rate — not tax advice; consult a CPA.
Schools (NCES district)
- District
- Charles County Public Schools
- NCES district ID
- 2400270
- Math proficiency
- 13% ▼ -19.00%
- Reading proficiency
- 29% ▼ -13.00%
- Median HH income
- $90,389
- Composite
- 22.54/100
- National rank
- #8087
- State rank
- #14 of 24 in MD
Livability — Waldorf
- Score
- 72/100
- State rank
- #141
- US rank
- #6083
Category grades
Schools grade is shown separately in the Schools card above.
Census & demographics
- Census place
- Waldorf, MD
- County
- Charles County · 103,527 people
- City population
- 103,527
- Metro
- Washington-Arlington-Alexandria, DC-VA-MD-WV
- Population (ZIP)
- 26,945
- Household income
- $117,480
- Rent vs Own
- Severe rent burden
- 369.0
Population outlook (Charles County) Hauer SSP2
- Today (2025)
- 176,616 people
- By 2030
- 186,471 · +5.6%
- By 2040
- 206,472 · +16.9%
- By 2050
- 224,883 · +27.3%
- By 2075
- 272,101 · +54.1%
- By 2100
- 303,564 · +71.9%
Race, ethnicity, and origin ACS 2023
- Neighborhood character
- Diverse neighborhood (Simpson 0.62)
- Race & ethnicity
- Black 55% White 24% Hispanic / Latino 9% Two or more races 9% Asian 3%
- Hispanic origin (detail)
- Mexican 3% Puerto Rican 2%
- Common ancestry
- Lithuanian 1% Romanian 1% Italian 1%
- Foreign-born
- 10% · Canada, China
- Languages at home
- 87% English-only · Spanish 8% Tagalog/Filipino 1% French/Haitian/Cajun 1%
Political lean MEDSL · Charles
- 2024 margin
- Solid D (+40.7) · D 69.2% · R 28.5% · Other 2.2%
- 2008→2024 swing
- +15.2pp toward D · 2008: 25.5pp · 2024: 40.7pp
- All cycles
- 2024: D+40.7 2020: D+40.9 2016: D+30.2 2012: D+31.3 2008: D+25.5
Not yet ingested
- Civics
- —
Market trends
- HPI YoY
- ▼ -76.84%
- Current HPI
- 241.1912
- Rent YoY
- ▲ 3.37%
- Metro
- Washington-Arlington-Alexandria, DC-VA-MD-WV
- State GDP YoY
- ▲ 2.97%
- F500 in state
- 12
Industry mix (Fortune 500 HQ in MD)
| Industry | F500 HQs | Revenue |
|---|---|---|
| Aerospace / Defense | 1 | $71B |
|
||
| Utilities | 1 | $25B |
|
||
| Hotels | 1 | $24B |
|
||
| Consumer Goods | 1 | $7B |
|
||
| Real Estate | 1 | $6B |
|
||
| Chemicals | 1 | $2B |
|
||
Price history
+240.6% since first listed2 events — show timeline
- 2026-06-18 Listed $299,900 BRIGHT MLS
- 1986-12-30 Sold (Public Records) $88,050 Public Records
Property tax history
+4.3%/yrLatest (2025): $4,364 · +6.3% YoY. Source: county tax records.
Cash-flow waterfall
monthlySold comps — $/sqft
last 12 mo · ≤1 miLoading sold comps…