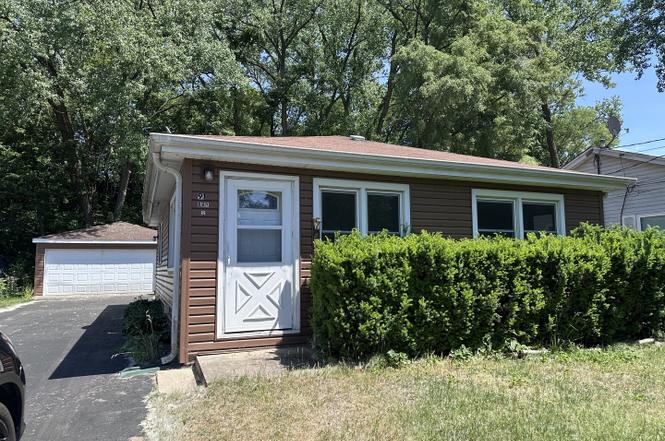
91 Bay Rd · Fox Lake, IL
Flood risk 1/10 · Minimal
- FEMA flood zone
- X (unshaded)
- Chance of flooding over 30 yrs
- 0.0%
- Est. flood insurance / yr
- $507 – $1,088
Fire risk 1/10 · Minimal
- Est. fire insurance / yr
- $804 – $1,492
Heat risk 2/10 · Minimal
- Hot days now (above 101°F)
- 7 days/yr
- Hot days in 30 yrs
- 14 days/yr
Wind risk 2/10 · Minimal
- Chance of severe wind over 30 yrs
- —
Air-quality risk 2/10 · Minimal
- Unhealthy air days now
- 1 days/yr
- Unhealthy air days in 30 yrs
- 1 days/yr
Risk factors via First Street. Map © Google.
Why this score? — see what drove the C- grade
The composite is a weighted blend of 9 inputs, each scored 0–100. Each bar is that input's sub-score; the figure is the points it added to the 100-point composite (weight × sub-score).
- Cash flow +20.4/30.0
- ARV discount +11.0/15.0
- DSCR +6.5/10.0
- 1% rule +4.4/10.0
- Livability +3.7/5.0
- Rent growth +2.5/5.0
- Condition / age +2.5/5.0
- Schools +2.3/10.0
- Appreciation +0.0/10.0
$175,000
🖨 Deal sheet 📄 Offer letter ✓ Due diligence
Listing remarks
Move-in ready 2-bedroom ranch in the heart of Fox Lake offering a practical layout and a newer detached 2-car garage in EXCELLENT condition. The home is designed with easy and comfortable living spaces, a large back deck, and a spacious yard shaded by mature trees with room for gardening, outdoor entertaining, or everyday use. Located just blocks from boat access to Pistakee Lake and the Fox Chain-O-Lakes, providing convenient gateway to boating, fishing, and year-round outdoor recreation. Close to downtown Fox Lake, the Metra station, and Route 12, this home offers a combination of recreational access and everyday convenience that is increasingly difficult to find at this price point.
Key facts
- 7,187 sq ft lot
- 2 garage spots
- Built 1948
Neighborhood map
What this means for you Summary
Snapshot
- This is a 2-bed/1.0-bath single-family listed at $175k.
Deal economics
- At list price, monthly cash flow is $227 ($3k/yr) — positive.
- The deal already cash-flows at list — no discount required.
- To meet the 1% rule (rent ≥ 1% of price), the offer needs to be $165k (5.8% below list).
- Recommended offer: $165k (5.8% below list) — sets the bar for 1% rule.
- Cap rate 7.8% vs local median 6.0% in Fox Lake — top-decile yield for the area; either an underpriced asset or a hidden risk that comps aren't pricing in. Stress-test before assuming the spread holds.
Location & tenants
- Location reads 74/100 on livability (#247 in IL, #4,462 nationally) — a middle-class / working-renter tenant base. Strengths: cost of living A+, housing A+, commute A; Watch: amenities D+, health & safety F.
- Grant Chsd 124 (suburban): math 23% / reading 27% proficiency, ranked #296 of 620 in IL (top 48%) — low school quality limits family demand, transient renter base, plan for 1-2y turnover.
- Zoned schools: Grant Community High School (math 23% / reading 27%, grade F, #247 of 693 statewide, top 36%, 1,837 students, 0% FRL).
- Market conditions: 78 active listings in the ZIP; 5 comparable units currently listed for rent nearby; rentals leasing fast (median 5d on market — plan ~1-2 weeks tenant-placement turnaround); 948 units permitted in Lake County in 2024 (424 in 5+ unit buildings).
Forward outlook
- Local home prices are declining (-3.0%/yr); year-one equity from $1k of loan paydown is wiped out by about $5k of value loss. Plan a longer hold.
- Lake County population projected to shrink 8% by 2050 — rents likely to lag national; underwrite the cash flow, not the appreciation.
Negotiation context
- Only 1 days on market — expect competitive offers; lowballing is unlikely to land.
- Current owner paid $82k; list at $175k implies a 113% gain — meaningful room to come down on a strong offer.
Risks & watch-outs
- Watch-outs: built in 1948 — expect roof / HVAC / electrical / plumbing capex.
Questions for the listing agent
- Built in 1948 — when were the roof, HVAC, electrical panel, plumbing, and water heater last replaced?
- Is there a deadline driving the sale (1031 exchange, divorce, estate, relocation)? That informs how much negotiation room exists.
- Schools are F-rated, which usually means shorter tenancies and higher turnover. Who's the typical renter profile here, and what's been the actual vacancy rate?
- What's the average days-on-market for RENTAL listings here right now (not sales)? A rising rental-DOM trend means longer vacancies and softer asking-rent achievability than the comps imply.
- What's the recent tenant-quality profile in this submarket — average credit score on applications, eviction rate, late-payment / NSF rate, and stable-employment percentage? A property-management company in the area should have these aggregated.
- How much new for-sale + rental construction is in the pipeline within 1–3 miles? Heavy new supply typically softens prices + rents 12–24 months out; constrained supply supports both.
Investment metrics
- 1% rule
- 0.94% ✗
- Cap rate
- 7.85%
- Cash-on-cash
- 5.55%
- DSCR
- 1.25
- GRM
- 8.8
CMA / ARV
- ARV (on-the-fly)
- $189,696
- Comps found
- 8
Show comp detail 8 sales within ~0.75 mi
| Address | Dist | Beds/Ba | Sqft | Sold | Price | $/sf | Match |
|---|---|---|---|---|---|---|---|
| 8 Cross St | 0.09mi | 2/1.0 | 720 (-6%) | 3mo | $182,000 | $253 | 83 |
| 42 Fairfax Rd | 0.12mi | 2/1.0 | 804 (+5%) | 17mo | $160,000 | $199 | 73 |
| 105 Manor Ave | 0.10mi | 2/1.0 | 802 (+4%) | 23mo | $158,000 | $197 | 69 |
| 17 Arlington Rd | 0.11mi | 2/1.0 | 872 (+14%) | 7mo | $110,000 | $126 | 66 |
| 143 Eagle Point Rd | 0.20mi | 2/1.0 | 866 (+13%) | 11mo | $155,000 | $179 | 61 |
| 43 Fairfax Rd | 0.12mi | 2/2.0 | 834 (+9%) | 20mo | $220,000 | $264 | 59 |
| 14 Arlington Ln | 0.40mi | 1/1.0 (-1) | 720 (-6%) | 14mo | $177,777 | $247 | 54 |
| 126 Glenview Ave | 0.72mi | 2/1.0 | 832 (+8%) | 12mo | $245,000 | $294 | 43 |
Match score weights: distance 35% · size 25% · config 20% · recency 20%. Top-matched comps best support the ARV.
Projected returns pro-forma
-3.0% appreciation · 3.0% rent growth · sell at horizon
- IRR
- -7.7%
- Equity multiple
- 0.71×
- Total profit
- $-13,980
- Equity at exit
- $26,093
- IRR
- 1.8%
- Equity multiple
- 1.13×
- Total profit
- $6,182
- Equity at exit
- $15,131
Cash invested: $49,000 (down + closing). Projections, not guarantees.
Landlord ↔ Tenant lean methodology
- Overall (STATE)
- 43 Moderately Tenant-Leaning
- State Illinois
- 43 Moderately Tenant-Leaning · D+7
- County
- — inherits STATE
- City
- — inherits STATE
ZIP-level market 60020
- Home prices YoY
- -30.7%
- Active inventory
- 78
- Price-to-rent
- 8.8×
Monthly cashflow live
- Estimated rent
- $1,649 high interval (Pro) →
- Mortgage (P&I)
- −$918
- Tax from tax record
- −$85 /mo · $1,024/yr
- Insurance
- −$73
- HOA
- −$0
- Vacancy / Maint / Mgmt
- −$346
- Net cashflow
- $227
Break-even live
UW: 25.0% down · 7.5% · 30yr · 1.5% tax · 5.0% vac · 8.0% maint · 8.0% mgmt
Financing live
Cash to close
- Down payment
- $43,750
- Closing costs
- $5,250
- Reserves months
- —
- Total cash needed
- —
Loan-product check · same deal, 3 products live
Conventional
25% down · 7.5% · 30yr
- Down + closing
- —
- Monthly P&I
- —
- Monthly cashflow
- —
- DSCR
- —
- Eligible?
- —
Personal DTI + credit; lowest rate.
DSCR
20% down · 8.5% · 30yr
- Down + closing
- —
- Monthly P&I
- —
- Monthly cashflow
- —
- DSCR
- —
- Eligible?
- —
No personal income docs; deal must DSCR.
Hard money
10% down · 12.0% · 12mo
- Down + closing
- —
- Monthly P&I
- —
- Monthly cashflow
- —
- DSCR
- —
- Eligible?
- —
Short-term bridge; refi at stabilization.
Rent comps 5 comps
| Address | Beds | Baths | Sqft | Rent | $/sqft | DOM | Units | Dist |
|---|---|---|---|---|---|---|---|---|
| 163 Eagle Point Rd Unit 1 Fox Lake, IL | 2.0 | 1.0 | 685 | $1,395 | $2.04 | 1d | 1 | 0.29mi |
| 22 W Grand Ave Fox Lake, IL | 2.0 | 1.0 | 730 | $1,700 | $2.33 | 43d | 1 | 0.50mi |
| 22 W Grand Ave Fox Lake, IL | 2.0 | 1.0 | 656 | $1,700 | $2.59 | 1d | 1 | 0.50mi |
| 87 Maude Ave Unit B Fox Lake, IL | 2.0 | 1.5 | 1092 | $1,700 | $1.56 | 15d | 1 | 1.15mi |
| 139 Cora Ave Unit 1374790P Fox Lake, IL | 1.0 | 1.0 | 699 | $2,400 | $3.43 | 5d | 1 | 1.21mi |
Listing history 7 events
-
2026-06-18statusdays on market $175,000 Active 1 DOM
-
2026-06-18remarks 694-char remark
-
2026-06-18days on market $175,000 Active (Private) 6 DOM
-
2026-06-17days on market $175,000 Active (Private) 5 DOM
-
2026-06-16days on market $175,000 Active (Private) 4 DOM
-
2026-06-15days on market $175,000 Active (Private) 3 DOM
-
2026-06-13$175,000 Active (Private) 1 DOM
ⓘ Source: listings_history table (triggers on properties + properties_extension) + one-shot
backfill from property_details.listing_events for pre-trigger history.
Tax reassessment forecast IL · Partial reset (capped growth)
- Current annual tax
- $1,024 · $85/mo
- Projected year-2 tax
- $2,498 · $208/mo
- Expected delta
- +$1,474/yr (+$123/mo · 143.9%)
ⓘ Screening estimate from a state-policy table — verify with the county assessor before closing.
Climate risk First Street
- Flood 1/10 Low FEMA zone X (unshaded) · 0% chance over 30 yrs
- Wildfire 1/10 Low
- Heat 2/10 Low 7 d/yr ≥101°F today · 14 d/yr by 30 yrs out
- Wind 2/10 Low
- Air quality 2/10 Low 1 unhealthy d/yr today · 1 by 30 yrs out
Nearby sold comps map
Loading sold comps map…
Walkable amenities ~0.75 mi
Loading nearby amenities…
Taxation est. · year 1
- Rental income
- $19,787
- − Mortgage interest
- −$9,803
- − Property taxes
- −$1,024
- − Insurance
- −$875
- − Repairs & maintenance
- −$1,583
- − Management
- −$1,583
- − Depreciation
- −$5,091
- Taxable loss
- −$172
- Est. tax savings @ 24.0%
- +$41
- After-tax cash flow
- $2,761/yr
For passive investors: Depreciation is non-cash, so a rental often shows a tax loss while cash-flowing — sheltering income. Rental losses are passive: they offset passive income freely, and up to $25,000/yr can offset ordinary (W-2) income if you actively participate and your MAGI is under $100k (phasing out to $0 by $150k); unused losses carry forward. On sale, claimed depreciation is recaptured at up to 25%, and gains may owe capital-gains tax (a 1031 exchange can defer both). Figures are a year-1 estimate at your 24.0% rate — not tax advice; consult a CPA.
Schools (NCES district)
- District
- Grant Chsd 124
- NCES district ID
- 1717340
- Math proficiency
- 23% ▼ -9.00%
- Reading proficiency
- 27% ▼ -7.00%
- Median HH income
- $59,450
- Composite
- 22.95/100
- National rank
- #7989
- State rank
- #296 of 620 in IL
Livability — Fox Lake
- Score
- 74/100
- State rank
- #247
- US rank
- #4462
Category grades
Schools grade is shown separately in the Schools card above.
Census & demographics
- Census place
- Fox Lake, IL
- City population
- 10,846
- Population (ZIP)
- 10,846
Population outlook (Lake County) Hauer SSP2
- Today (2025)
- 700,217 people
- By 2030
- 693,290 · -1.0%
- By 2040
- 673,588 · -3.8%
- By 2050
- 643,556 · -8.1%
- By 2075
- 562,792 · -19.6%
- By 2100
- 457,715 · -34.6%
Race, ethnicity, and origin ACS 2023
- Neighborhood character
- Predominantly White (80%)
- Race & ethnicity
- White 80% Hispanic / Latino 12% Two or more races 10% Black 3%
- Hispanic origin (detail)
- Mexican 10% Puerto Rican 1%
- Common ancestry
- Romanian 15% Portuguese 2% Italian 2%
- Foreign-born
- 10% · Canada, South Korea
- Languages at home
- 87% English-only · Spanish 6% Russian/Polish/Slavic 3% Other Indo-European 1%
Political lean MEDSL · Lake
- 2024 margin
- Strong D (+20.8) · D 59.7% · R 38.9% · Other 1.4%
- 2008→2024 swing
- +1.1pp toward D · 2008: 19.6pp · 2024: 20.8pp
- All cycles
- 2024: D+20.8 2020: D+24.1 2016: D+20.3 2012: D+8.1 2008: D+19.6
Not yet ingested
- Civics
- —
Market trends
- HPI YoY
- ▼ -97.19%
- Current HPI
- 219.6301
- Rent YoY
- —
- Metro
- —
- State GDP YoY
- ▲ 1.59%
- F500 in state
- 60
Industry mix (Fortune 500 HQ in IL)
| Industry | F500 HQs | Revenue |
|---|---|---|
| Insurance | 4 | $201B |
|
||
| Consumer Goods | 4 | $87B |
|
||
| Industrial Machinery | 3 | $64B |
|
||
| Healthcare | 2 | $55B |
|
||
| Retail / Pharmacy | 1 | $148B |
|
||
| Agriculture / Food | 1 | $86B |
|
||
Price history
+302.8% since first listed4 events — show timeline
- 2026-06-12 Coming Soon $175,000 MRED as Distributed by MLS Grid
- 1995-04-21 Sold (Public Records) $82,000 Public Records
- 1990-08-01 Sold (Public Records) $65,000 Public Records
- 1984-03-01 Sold (Public Records) $43,450 Public Records
Property tax history
-4.3%/yrLatest (2024): $1,024 · -6.8% YoY. Source: county tax records.
Cash-flow waterfall
monthlySold comps — $/sqft
last 12 mo · ≤1 miLoading sold comps…