322 Julian Davis Dr · Venus, TX
Flood risk 1/10 · Minimal
- FEMA flood zone
- X (unshaded)
- Chance of flooding over 30 yrs
- 0.0%
- Est. flood insurance / yr
- $507 – $1,088
Fire risk 2/10 · Minimal
- Est. fire insurance / yr
- $1,222 – $2,270
Heat risk 7/10 · Major
- Hot days now (above 110°F)
- 7 days/yr
- Hot days in 30 yrs
- 24 days/yr
Wind risk 6/10 · Moderate
- Chance of severe wind over 30 yrs
- 27.0%
Air-quality risk 2/10 · Minimal
- Unhealthy air days now
- 2 days/yr
- Unhealthy air days in 30 yrs
- 2 days/yr
Risk factors via First Street. Map © Google.
Why this score? — see what drove the D grade
The composite is a weighted blend of 9 inputs, each scored 0–100. Each bar is that input's sub-score; the figure is the points it added to the 100-point composite (weight × sub-score).
- Cash flow +9.0/30.0
- Appreciation +8.7/10.0
- ARV discount +7.5/15.0
- Livability +3.5/5.0
- Rent growth +3.1/5.0
- DSCR +2.5/10.0
- Schools +2.5/10.0
- Condition / age +2.5/5.0
- 1% rule +1.5/10.0
$389,900
🖨 Deal sheet 📄 Offer letter ✓ Due diligence
Listing remarks
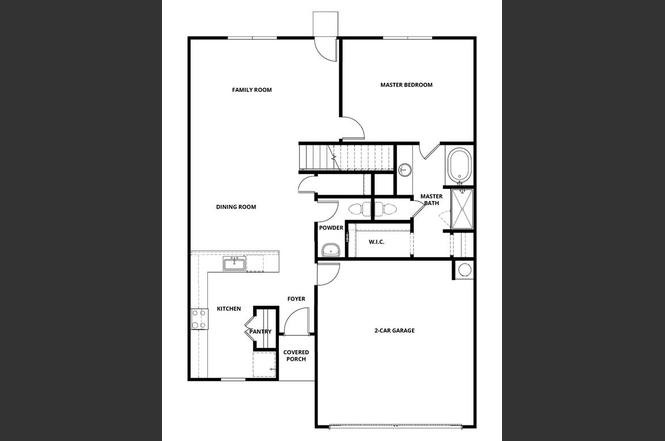
The Cottonwood floor plan is designed with growing families in mind, featuring five spacious bedrooms and two-and-a-half bathrooms spread across two thoughtfully arranged levels. At the heart of the home, an open-concept layout seamlessly blends the kitchen, dining area, and family room, creating an inviting atmosphere where everyday moments and special gatherings alike feel effortless. The secluded downstairs master suite offers a quiet retreat for homeowners, while upstairs a versatile loft provides flexible space ensuring families have plenty of room to live, grow, and enjoy life together.
Key facts
- Versatile loft
- Open-concept layout
- 5,260 sq ft lot
Tags
Neighborhood map
What this means for you Summary
Snapshot
- This is a 5-bed/2.5-bath land listed at $390k.
Deal economics
- At list price, monthly cash flow is $-310 ($-4k/yr) — negative.
- To cash-flow at today's rent, offer at most $335k (14.0% below list).
- To meet the 1% rule (rent ≥ 1% of price), the offer needs to be $255k (34.7% below list).
- Recommended offer: $255k (34.7% below list) — sets the bar for 1% rule.
- Cap rate 5.3% vs local median 3.0% in Venus — top-decile yield for the area; either an underpriced asset or a hidden risk that comps aren't pricing in. Stress-test before assuming the spread holds.
Location & tenants
- Location reads 70/100 on livability (#356 in TX) — a middle-class / working-renter tenant base. Strengths: crime A+, employment A+, cost of living A+; Watch: amenities F, commute F, health & safety F.
- Venus ISD (town): math 25% / reading 32% proficiency, ranked #646 of 826 in TX (top 78%) — low school quality limits family demand, transient renter base, plan for 1-2y turnover; 60% free/reduced lunch — lower-income household profile, screen leases tightly.
- Zoned schools: Venus El (math 27% / reading 30%, grade F, #2,706 of 4,322 statewide, top 63%, 658 students, 82% FRL) — zoned schools average 82% FRL vs 60% district-wide (22 pts higher); higher-poverty schools than district average — tighter screening recommended.
- Market conditions: Rents rising (+2.4%/yr); 426 active listings in the ZIP; 10 comparable units currently listed for rent nearby; rentals leasing fast (median 8d on market — plan ~1-2 weeks tenant-placement turnaround); solid renter incomes; 2,152 units permitted in Johnson County in 2024 (76 in 5+ unit buildings).
Forward outlook
- In year one you build about $31k of equity ($3k loan paydown + $29k appreciation (7.3% local appreciation)).
- Johnson County population projected at +24% by 2050 — long-run rental-demand tailwind backs the buy-and-hold thesis.
- By year 2, paydown + projected appreciation supports a ~$50k cash-out refi (75% LTV) — recoverable capital for the next deal without selling this one.
Negotiation context
- It's been on market 26 days — a 2% lower offer ($384k) is reasonable based on typical stale-listing flexibility.
Risks & watch-outs
- Climate carrying-cost: major wind risk, 27% chance of damaging wind over 30y; extreme-heat days projected 7→24/yr by 2055 (HVAC capex compounding) — expect insurance premiums to compound above CPI over the hold.
Questions for the listing agent
- What do current leases actually rent for vs. the listed asking? Can we see a recent rent roll and the last 12 months of T-12 income?
- What does the HOA fee cover, when was the last increase, and are there any pending special assessments or reserve-fund shortfalls?
- Is there a deadline driving the sale (1031 exchange, divorce, estate, relocation)? That informs how much negotiation room exists.
- Schools are D-rated, which usually means shorter tenancies and higher turnover. Who's the typical renter profile here, and what's been the actual vacancy rate?
- The area grade is low — what's the realistic commute time and amenity access for the typical tenant pool here? Any planned neighborhood developments (good or bad) we should know about?
- What's the average days-on-market for RENTAL listings here right now (not sales)? A rising rental-DOM trend means longer vacancies and softer asking-rent achievability than the comps imply.
- What's the recent tenant-quality profile in this submarket — average credit score on applications, eviction rate, late-payment / NSF rate, and stable-employment percentage? A property-management company in the area should have these aggregated.
- How much new for-sale + rental construction is in the pipeline within 1–3 miles? Heavy new supply typically softens prices + rents 12–24 months out; constrained supply supports both.
Investment metrics
- 1% rule
- 0.65% ✗
- Cap rate
- 5.34%
- Cash-on-cash
- -3.41%
- DSCR
- 0.85
- GRM
- 12.8
CMA / ARV
No comps found within radius.
Projected returns pro-forma
7.32% appreciation · 2.39% rent growth · sell at horizon
- IRR
- 15.6%
- Equity multiple
- 2.12×
- Total profit
- $122,390
- Equity at exit
- $278,396
- IRR
- 15.2%
- Equity multiple
- 4.36×
- Total profit
- $366,362
- Equity at exit
- $536,431
Cash invested: $109,172 (down + closing). Projections, not guarantees.
Landlord ↔ Tenant lean methodology
- Overall (STATE)
- 87 Strongly Landlord-Friendly
- State Texas
- 87 Strongly Landlord-Friendly · R+5
- County
- — inherits STATE
- City
- — inherits STATE
ZIP-level market 76084
- Home prices YoY
- 2.1%
- Rents YoY
- 2.4%
- Active inventory
- 426
- Price-to-rent
- 12.8×
Monthly cashflow live
- Estimated rent
- $2,545 high interval (Pro) →
- Mortgage (P&I)
- −$2,045
- Tax from tax record
- −$76 /mo · $915/yr
- Insurance
- −$162
- HOA
- −$37
- Vacancy / Maint / Mgmt
- −$534
- Net cashflow
- $-310
Break-even live
UW: 25.0% down · 7.5% · 30yr · 1.5% tax · 5.0% vac · 8.0% maint · 8.0% mgmt
Financing live
Cash to close
- Down payment
- $97,475
- Closing costs
- $11,697
- Reserves months
- —
- Total cash needed
- —
Loan-product check · same deal, 3 products live
Conventional
25% down · 7.5% · 30yr
- Down + closing
- —
- Monthly P&I
- —
- Monthly cashflow
- —
- DSCR
- —
- Eligible?
- —
Personal DTI + credit; lowest rate.
DSCR
20% down · 8.5% · 30yr
- Down + closing
- —
- Monthly P&I
- —
- Monthly cashflow
- —
- DSCR
- —
- Eligible?
- —
No personal income docs; deal must DSCR.
Hard money
10% down · 12.0% · 12mo
- Down + closing
- —
- Monthly P&I
- —
- Monthly cashflow
- —
- DSCR
- —
- Eligible?
- —
Short-term bridge; refi at stabilization.
Rent comps 10 comps
| Address | Beds | Baths | Sqft | Rent | $/sqft | DOM | Units | Dist |
|---|---|---|---|---|---|---|---|---|
| 214 Julian Davis Dr Venus, TX | 4.0 | 2.0 | 1784 | $2,355 | $1.32 | 44d | 1 | 0.11mi |
| 208 Julian Davis Dr Venus, TX | 4.0 | 2.0 | 1784 | $2,330 | $1.31 | 11d | 1 | 0.14mi |
| 428 Condie Russell Ave Venus, TX | 4.0 | 2.0 | 1784 | $2,150 | $1.21 | 24d | 1 | 0.18mi |
| 325 Condie Russell Ave Venus, TX | 4.0 | 2.5 | 2189 | $2,325 | $1.06 | 13d | 1 | 0.33mi |
| 720 Blackland Dr Venus, TX | 4.0 | 2.5 | 1926 | $2,200 | $1.14 | 7d | 1 | 0.44mi |
| 640-644 Wheatfield DR Venus, TX | 4.0 | 2.0 | 1926 | $2,100 | $1.09 | 1d | 1 | 0.45mi |
| 201 John Laurens Dr Venus, TX | 3.0–5.0 | 2.0–2.5 | 1975 | $2,820 | $1.43 | 1d | 1 | 0.47mi |
| 313 Patton Ln Venus, TX | 4.0 | 2.0 | 1784 | $2,355 | $1.32 | 7d | 1 | 0.74mi |
| 315 Patton Ln Venus, TX | 4.0 | 2.5 | 2173 | $2,515 | $1.16 | 3d | 1 | 0.74mi |
| 113 Franklin Ct Venus, TX | 5.0 | 2.0 | 2959 | $2,370 | $0.80 | 1d | 1 | 0.87mi |
HOA detail
- Monthly dues
- $37 · $444/yr
Listing history 2 events
-
2026-01-28status Pending
-
2026-01-02$389,900 Active
ⓘ Source: listings_history table (triggers on properties + properties_extension) + one-shot
backfill from property_details.listing_events for pre-trigger history.
Tax reassessment forecast TX · Resets to sale price
- Current annual tax
- $915 · $76/mo
- Projected year-2 tax
- $7,135 · $595/mo
- Expected delta
- +$6,221/yr (+$518/mo · 680.1%)
ⓘ Screening estimate from a state-policy table — verify with the county assessor before closing.
Climate risk First Street
- Flood 1/10 Low FEMA zone X (unshaded) · 0% chance over 30 yrs
- Wildfire 2/10 Low
- Heat 7/10 Severe 7 d/yr ≥110°F today · 24 d/yr by 30 yrs out
- Wind 6/10 Major 27% chance of damaging wind over 30 yrs
- Air quality 2/10 Low 2 unhealthy d/yr today · 2 by 30 yrs out
Nearby sold comps map
Loading sold comps map…
Walkable amenities ~0.75 mi
Loading nearby amenities…
Taxation est. · year 1
- Rental income
- $30,540
- − Mortgage interest
- −$21,840
- − Property taxes
- −$915
- − Insurance
- −$1,950
- − Repairs & maintenance
- −$2,443
- − Management
- −$2,443
- − HOA
- −$444
- − Depreciation
- −$11,343
- Taxable loss
- −$10,837
- Est. tax savings @ 24.0%
- +$2,601
- After-tax cash flow
- $-1,117/yr
For passive investors: Depreciation is non-cash, so a rental often shows a tax loss while cash-flowing — sheltering income. Rental losses are passive: they offset passive income freely, and up to $25,000/yr can offset ordinary (W-2) income if you actively participate and your MAGI is under $100k (phasing out to $0 by $150k); unused losses carry forward. On sale, claimed depreciation is recaptured at up to 25%, and gains may owe capital-gains tax (a 1031 exchange can defer both). Figures are a year-1 estimate at your 24.0% rate — not tax advice; consult a CPA.
Schools (NCES district)
- District
- Venus ISD
- NCES district ID
- 4844010
- Math proficiency
- 25% ▼ -15.00%
- Reading proficiency
- 32% ▼ -2.00%
- Median HH income
- $50,394
- Composite
- 24.97/100
- National rank
- #7563
- State rank
- #646 of 826 in TX
Livability — Venus
- Score
- 70/100
- State rank
- #356
- US rank
- #7724
Category grades
Schools grade is shown separately in the Schools card above.
Census & demographics
- Census place
- Venus, TX
- County
- Johnson County · 147,987 people
- Metro
- Dallas-Fort Worth-Arlington, TX
- Population (ZIP)
- 14,097
- Household income
- $102,115
- Rent vs Own
- Severe rent burden
- 70.0
Population outlook (Johnson County) Hauer SSP2
- Today (2025)
- 179,678 people
- By 2030
- 189,208 · +5.3%
- By 2040
- 207,261 · +15.4%
- By 2050
- 223,064 · +24.1%
- By 2075
- 259,979 · +44.7%
- By 2100
- 275,395 · +53.3%
Race, ethnicity, and origin ACS 2023
- Neighborhood character
- Diverse neighborhood (Simpson 0.63)
- Race & ethnicity
- White 52% Hispanic / Latino 30% Two or more races 24% Black 11% Asian 1%
- Hispanic origin (detail)
- Mexican 25% Puerto Rican 1%
- Common ancestry
- Romanian 2% Lithuanian 1% Slovak 1%
- Foreign-born
- 8% · Canada
- Languages at home
- 78% English-only · Spanish 18% Arabic 1% French/Haitian/Cajun 1%
Political lean MEDSL · Johnson
- 2024 margin
- Solid R (+51.4) · D 23.9% · R 75.3%
- 2008→2024 swing
- -3.9pp toward R · 2008: -47.5pp · 2024: -51.4pp
- All cycles
- 2024: R+51.4 2020: R+53.0 2016: R+58.3 2012: R+55.6 2008: R+47.5
Not yet ingested
- Civics
- —
Market trends
- HPI YoY
- ▲ 7.32%
- Current HPI
- 355.74
- Rent YoY
- ▲ 2.39%
- Metro
- Dallas-Fort Worth-Arlington, TX
- State GDP YoY
- ▲ 3.95%
- F500 in state
- 110
Industry mix (Fortune 500 HQ in TX)
| Industry | F500 HQs | Revenue |
|---|---|---|
| Energy | 16 | $1,198B |
|
||
| Technology | 5 | $198B |
|
||
| Engineering / Construction | 4 | $72B |
|
||
| Energy Services | 3 | $60B |
|
||
| Utilities | 3 | $41B |
|
||
| Healthcare | 2 | $330B |
|
||
Price history
2 events — show timeline
- 2026-01-28 Pending — NTREIS
- 2026-01-02 Listed $389,900 NTREIS
Property tax history
+7.5%/yrLatest (2025): $915 · +21.4% YoY. Source: county tax records.
Cash-flow waterfall
monthlySold comps — $/sqft
last 12 mo · ≤1 miLoading sold comps…