 Multi-family
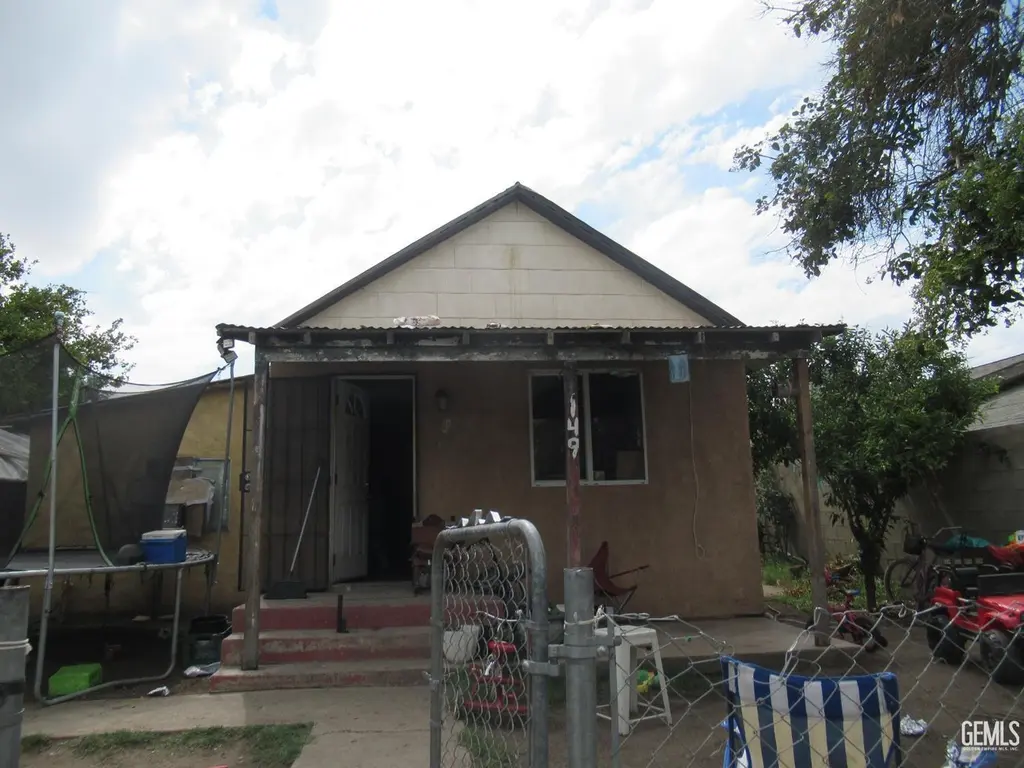
149 E 2nd St · Buttonwillow, CA
Flood risk 1/10 · Minimal
- FEMA flood zone
- X (unshaded)
- Chance of flooding over 30 yrs
- 0.0%
- Est. flood insurance / yr
- $507 – $1,088
Fire risk 4/10 · Minor
- Est. fire insurance / yr
- $659 – $1,223
Heat risk 8/10 · Major
- Hot days now (above 103°F)
- 7 days/yr
- Hot days in 30 yrs
- 18 days/yr
Wind risk 1/10 · Minimal
- Chance of severe wind over 30 yrs
- —
Air-quality risk 10/10 · Severe
- Unhealthy air days now
- 26 days/yr
- Unhealthy air days in 30 yrs
- 30 days/yr
Risk factors via First Street. Map © Google.
Why this score? — see what drove the C grade
The composite is a weighted blend of 9 inputs, each scored 0–100. Each bar is that input's sub-score; the figure is the points it added to the 100-point composite (weight × sub-score).
- Cash flow +23.4/30.0
- DSCR +7.5/10.0
- ARV discount +7.5/15.0
- 1% rule +6.1/10.0
- Appreciation +4.5/10.0
- Schools +3.4/10.0
- Rent growth +2.5/5.0
- Livability +2.3/5.0
- Condition / age +2.2/5.0
$164,900
🖨 Deal sheet (PDF) 📄 Offer letter ✓ Due diligence
Multi-family units
County records classify this as Multi-Family (2-4 Unit). Listing-text estimate: 1 unit. estimate disagrees with records
Listing remarks MLS
Investment Opportunity:Two houses on one lot with strong portfolio upside. Front house: 2 bedrooms, 1 bathroom; back house: 1 bedroom, 1 bathroom (can be converted to 2 bedrooms by adding a closet in the existing second room); separate gas and electric meters. The property is in need of TLC, presenting significant upside potential through updates and enhanced curb appeal, with the potential for increased rental income. Schedule a showing soon with your favorite Realtorthis opportunity won't last long.
Key facts
- 6,098 sq ft lot
- Built 1942
- Listed 92 days
Neighborhood map
What this means for you Summary
Snapshot
- This is a 3-bed/2.0-bath multifamily listed at $165k. Condition is rated fair.
Deal economics
- At list price, monthly cash flow is $305 ($4k/yr) — positive.
- The deal already cash-flows at list — no discount required.
- Meets the 1% rule at list price ($2k rent vs $165k).
- Recommended offer: $150k (9.0% below list) — sets the bar for market timing.
Location & tenants
- Location reads 46/100 on livability (#1,272 in CA) — a working-class tenant base; expect higher turnover. Strengths: housing A, crime B; Watch: schools F, amenities F, commute F.
- Kern High (urban): math 21% / reading 51% proficiency, ranked #860 of 1,400 in CA (top 61%) — families likely to look elsewhere, expect single-tenant / working-renter base with shorter leases.
- Market conditions: 18 active listings in the ZIP; 3,244 units permitted in Kern County in 2024 (73 in 5+ unit buildings).
Forward outlook
- Local home prices are declining (-1.0%/yr); year-one equity from $1k of loan paydown is wiped out by about $2k of value loss. Plan a longer hold.
- Kern County population projected at +17% by 2050 — long-run rental-demand tailwind backs the buy-and-hold thesis.
- At projected returns (-1.0% appreciation + 3.0% rent growth), your $46k cash investment doubles in ~9 years — after that, you're playing with house money.
Negotiation context
- It's been on market 92 days — a 9% lower offer ($150k) is reasonable based on typical stale-listing flexibility.
- 2 sale attempts with the ask held roughly flat each time — persistent listings suggest the price (not the market) is what's stuck; bring a comps-based counter.
Risks & watch-outs
- Watch-outs: built in 1942 — expect roof / HVAC / electrical / plumbing capex.
- Climate carrying-cost: extreme-heat days projected 7→18/yr by 2055 (HVAC capex compounding) — expect insurance premiums to compound above CPI over the hold.
Questions for the listing agent
- It's been on market 92 days. Have you received any prior offers? Is the seller open to a 9% concession, seller financing, or rate buy-down credit?
- Have any recent inspections been done? Can we get a copy of the seller's disclosures and any deferred-maintenance estimates?
- Built in 1942 — when were the roof, HVAC, electrical panel, plumbing, and water heater last replaced?
- Why hasn't it sold? Are there any deal-killer items the seller is aware of (foundation, flood, title, zoning, code violations)?
- Is there a deadline driving the sale (1031 exchange, divorce, estate, relocation)? That informs how much negotiation room exists.
- Schools are F-rated, which usually means shorter tenancies and higher turnover. Who's the typical renter profile here, and what's been the actual vacancy rate?
- What's the average days-on-market for RENTAL listings here right now (not sales)? A rising rental-DOM trend means longer vacancies and softer asking-rent achievability than the comps imply.
- What's the recent tenant-quality profile in this submarket — average credit score on applications, eviction rate, late-payment / NSF rate, and stable-employment percentage? A property-management company in the area should have these aggregated.
- How much new apartment / multifamily construction is in the pipeline within 1–3 miles? Heavy new supply (>2% of stock underway) typically softens rents 12–24 months out; light construction supports rent growth.
Investment metrics
- 1% rule
- 1.11% ✓
- Cap rate
- 8.51%
- Cash-on-cash
- 7.91%
- DSCR
- 1.35
- GRM
- 7.5
CMA / ARV
No comps found within radius.
Projected returns pro-forma
-0.98% appreciation · 3.0% rent growth · sell at horizon
- IRR
- 3.5%
- Equity multiple
- 1.15×
- Total profit
- $7,119
- Equity at exit
- $39,924
- IRR
- 9.9%
- Equity multiple
- 1.97×
- Total profit
- $44,833
- Equity at exit
- $42,024
Cash invested: $46,172 (down + closing). Projections, not guarantees.
Landlord ↔ Tenant lean methodology
- Overall (STATE)
- 18 Strongly Tenant-Friendly
- State California
- 18 Strongly Tenant-Friendly · D+13
- County
- — inherits STATE
- City
- — inherits STATE
ZIP-level market 93206
- Home prices YoY
- -0.2%
- Active inventory
- 18
- Price-to-rent
- 14.2×
Monthly cashflow live
- Estimated rent
- $1,828 medium interval (Pro) →
- Mortgage (P&I)
- −$865
- Tax est. 1.5%
- −$206 /mo · $2,474/yr
- Insurance
- −$69
- HOA
- −$0
- Vacancy / Maint / Mgmt
- −$384
- Net cashflow
- $305
Break-even live
Sensitivity live
| Price | -10% $418 | -5% $362 | +0% $305 | +5% $248 | +10% $191 |
|---|---|---|---|---|---|
| Rent | -10% $160 | -5% $232 | +0% $305 | +5% $377 | +10% $449 |
| Rate | -1.0pp $388 | -0.5pp $346 | base $305 | +0.5pp $262 | +1.0pp $218 |
2-unit breakdown (identical units grouped — click to expand)
| Units | Beds | Baths | Est. rent |
|---|---|---|---|
| 1× unit | 2 | 1 | $970 |
| 1× unit | 1 | 1 | $857 |
| Total (2 units) | $1,828 | ||
UW: 25.0% down · 7.5% · 30yr · 1.5% tax · 5.0% vac · 8.0% maint · 8.0% mgmt
Financing live
Cash to close
- Down payment
- $41,225
- Closing costs
- $4,947
- Reserves months
- —
- Total cash needed
- —
Loan-product check · same deal, 3 products live
Conventional
25% down · 7.5% · 30yr
- Down + closing
- —
- Monthly P&I
- —
- Monthly cashflow
- —
- DSCR
- —
- Eligible?
- —
Personal DTI + credit; lowest rate.
DSCR
20% down · 8.5% · 30yr
- Down + closing
- —
- Monthly P&I
- —
- Monthly cashflow
- —
- DSCR
- —
- Eligible?
- —
No personal income docs; deal must DSCR.
Hard money
10% down · 12.0% · 12mo
- Down + closing
- —
- Monthly P&I
- —
- Monthly cashflow
- —
- DSCR
- —
- Eligible?
- —
Short-term bridge; refi at stabilization.
Listing history 12 events
-
2026-06-13statusdays on market $164,900 Pending 92 DOM
-
2026-06-10days on market $164,900 Active 90 DOM
-
2026-06-09days on market $164,900 Active 89 DOM
-
2026-06-08days on market $164,900 Active 88 DOM
-
2026-06-07days on market $164,900 Active 87 DOM
-
2026-06-05days on market $164,900 Active 84 DOM
-
2026-06-03days on market $164,900 Active 83 DOM
-
2026-06-03days on market $164,900 Active 82 DOM
-
2026-06-01days on market $164,900 Active 81 DOM
-
2026-05-31days on market $164,900 Active 80 DOM
-
2026-03-12$164,900 Active 506-char remark
Show marketing remark (506 chars)
Investment Opportunity:Two houses on one lot with strong portfolio upside. Front house: 2 bedrooms, 1 bathroom; back house: 1 bedroom, 1 bathroom (can be converted to 2 bedrooms by adding a closet in the existing second room); separate gas and electric meters. The property is in need of TLC, presenting significant upside potential through updates and enhanced curb appeal, with the potential for increased rental income. Schedule a showing soon with your favorite Realtorthis opportunity won't last long.
-
2025-10-13$149,999 Active
ⓘ Source: listings_history table (triggers on properties + properties_extension) + one-shot
backfill from property_details.listing_events for pre-trigger history.
Climate risk First Street
- Flood 1/10 Low FEMA zone X (unshaded) · 0% chance over 30 yrs
- Wildfire 4/10 Moderate
- Heat 8/10 Severe 7 d/yr ≥103°F today · 18 d/yr by 30 yrs out
- Wind 1/10 Low
- Air quality 10/10 Extreme 26 unhealthy d/yr today · 30 by 30 yrs out
Nearby sold comps map
Loading sold comps map…
Walkable amenities ~0.75 mi
Loading nearby amenities…
Taxation est. · year 1
- Rental income
- $21,936
- − Mortgage interest
- −$9,237
- − Property taxes
- −$2,474
- − Insurance
- −$824
- − Repairs & maintenance
- −$1,755
- − Management
- −$1,755
- − Depreciation
- −$4,797
- Taxable income
- $1,094
- Est. tax owed @ 24.0%
- −$263
- After-tax cash flow
- $3,392/yr
For passive investors: Depreciation is non-cash, so a rental often shows a tax loss while cash-flowing — sheltering income. Rental losses are passive: they offset passive income freely, and up to $25,000/yr can offset ordinary (W-2) income if you actively participate and your MAGI is under $100k (phasing out to $0 by $150k); unused losses carry forward. On sale, claimed depreciation is recaptured at up to 25%, and gains may owe capital-gains tax (a 1031 exchange can defer both). Figures are a year-1 estimate at your 24.0% rate — not tax advice; consult a CPA.
Condition & rehab AI · 12 photos
This property presents significant potential for improvement with moderate rehabilitation needed, including repairs to the roof and exterior siding, as well as landscaping and HVAC upgrades to enhance both resale and rental value.
Repairs flagged
- Major roof — visible wear and tear
- Major exterior siding — weathered appearance
- Major landscaping — overgrown yard and cluttered exterior
Value-add opportunities
- Both landscaping and curb appeal improvements — enhanced curb appeal and increased property value
- Both roof and exterior siding repairs — improved property condition and increased rental value
- Both HVAC system upgrade — better air quality and energy efficiency
Renovation cost estimate screening
| Repair item | Severity | Est. cost |
|---|---|---|
| roof · visible wear and tear | Major | $15,000–50,000 |
| exterior siding · weathered appearance | Major | $15,000–50,000 |
| landscaping · overgrown yard and cluttered exterior | Major | $15,000–50,000 |
| Total estimated repair cost · 3 items | $45,000–150,000 |
Value-add ROI direction
- Both landscaping and curb appeal improvements — enhanced curb appeal and increased property value ↑
- Both roof and exterior siding repairs — improved property condition and increased rental value ↑
- Both HVAC system upgrade — better air quality and energy efficiency ↑
ⓘ Cost ranges are severity-bucket heuristics (US national rule-of-thumb). Get contractor quotes + a written scope before underwriting a rehab budget.
Schools (NCES district)
- District
- Kern High
- NCES district ID
- 0619540
- Math proficiency
- 21% ▬ 0.00%
- Reading proficiency
- 51% ▲ 2.00%
- Median HH income
- $49,686
- Composite
- 33.68/100
- National rank
- #10443
- State rank
- #860 of 1400 in CA
Livability — Buttonwillow
- Score
- 46/100
- State rank
- #1272
- US rank
- #26440
Category grades
Schools grade is shown separately in the Schools card above.
Census & demographics
- Census place
- Buttonwillow, CA
- Population (ZIP)
- 1,953
Population outlook (Kern County) Hauer SSP2
- Today (2025)
- 947,286 people
- By 2030
- 978,984 · +3.3%
- By 2040
- 1,045,018 · +10.3%
- By 2050
- 1,105,232 · +16.7%
- By 2075
- 1,229,538 · +29.8%
- By 2100
- 1,238,059 · +30.7%
Race, ethnicity, and origin ACS 2023
- Neighborhood character
- Predominantly Hispanic (81%)
- Race & ethnicity
- Hispanic / Latino 81% Two or more races 30% White 14%
- Hispanic origin (detail)
- Mexican 78%
- Common ancestry
- Lithuanian 1%
- Foreign-born
- 30% · Canada
- Languages at home
- 30% English-only · Spanish 70%
Political lean MEDSL · Kern
- 2024 margin
- Strong R (+21.1) · D 38.2% · R 59.3% · Other 2.5%
- 2008→2024 swing
- -3.3pp toward R · 2008: -17.8pp · 2024: -21.1pp
- All cycles
- 2024: R+21.1 2020: R+10.2 2016: R+15.0 2012: R+20.9 2008: R+17.8
Not yet ingested
- Civics
- —
Market trends
- HPI YoY
- ▼ -0.98%
- Current HPI
- 399.7606
- Rent YoY
- —
- Metro
- —
- State GDP YoY
- ▲ 3.21%
- F500 in state
- 116
Industry mix (Fortune 500 HQ in CA)
| Industry | F500 HQs | Revenue |
|---|---|---|
| Technology | 27 | $1,492B |
|
||
| Financial Services | 3 | $174B |
|
||
| Retail | 3 | $44B |
|
||
| Insurance | 3 | $26B |
|
||
| Media / Entertainment | 2 | $115B |
|
||
| Pharmaceuticals / Biotech | 2 | $62B |
|
||
Price history
+9.9% since first listed2 events — show timeline
- 2026-03-12 Listed $164,900 GEMLS
- 2025-10-13 Listed $149,999 GEMLS
Cash-flow waterfall
monthlySold comps — $/sqft
last 12 mo · ≤1 miLoading sold comps…