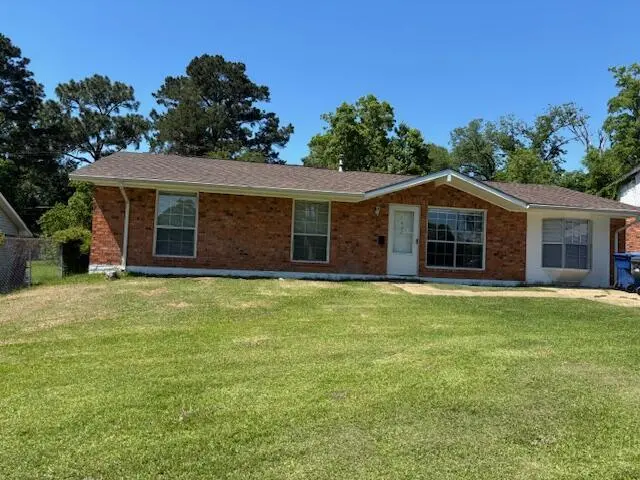
1038 Longleaf · Leesville, LA
Flood risk 1/10 · Minimal
- FEMA flood zone
- X (unshaded)
- Chance of flooding over 30 yrs
- 0.0%
- Est. flood insurance / yr
- $507 – $1,088
Fire risk 4/10 · Minor
- Est. fire insurance / yr
- $1,269 – $2,357
Heat risk 8/10 · Major
- Hot days now (above 110°F)
- 7 days/yr
- Hot days in 30 yrs
- 20 days/yr
Wind risk 8/10 · Major
- Chance of severe wind over 30 yrs
- 99.0%
Air-quality risk 1/10 · Minimal
- Unhealthy air days now
- 0 days/yr
- Unhealthy air days in 30 yrs
- 0 days/yr
Risk factors via First Street. Map © Google.
Why this score? — see what drove the C- grade
The composite is a weighted blend of 9 inputs, each scored 0–100. Each bar is that input's sub-score; the figure is the points it added to the 100-point composite (weight × sub-score).
- Cash flow +19.5/30.0
- ARV discount +7.5/15.0
- DSCR +6.2/10.0
- Rent growth +4.9/5.0
- 1% rule +4.2/10.0
- Livability +3.7/5.0
- Schools +3.6/10.0
- Condition / age +2.5/5.0
- Appreciation +0.0/10.0
$165,000
🖨 Deal sheet 📄 Offer letter ✓ Due diligence
Listing remarks MLS
This 3 BedRoom Brick Ranch offers a LivRm and Den, Fenced Yard and equipped with a tenant if you're an investor. Call today for your showing.
Key facts
- 0.25 acre lot
- Built 1977
- Listed 28 days
Property features AI
Exterior
- Utilities: Public water; Public sewer
- Home design: Single-family residence; One story
- Construction: Brick construction; Slab foundation
- Exterior features: Composition roof; Residential zoning; Subdivision: Pinecrest Addition
Interior
- Bathrooms: 1 full bathroom; 1 half bathroom
- Heating & cooling: Central heating; Central air conditioning
- Interior features: Refrigerator
Neighborhood map
What this means for you Summary
Snapshot
- This is a 3-bed/1.5-bath single-family listed at $165k.
Deal economics
- At list price, monthly cash flow is $188 ($2k/yr) — positive.
- The deal already cash-flows at list — no discount required.
- To meet the 1% rule (rent ≥ 1% of price), the offer needs to be $152k (7.6% below list).
- Recommended offer: $152k (7.6% below list) — sets the bar for 1% rule.
Location & tenants
- Location reads 73/100 on livability (#30 in LA) — a middle-class / working-renter tenant base. Strengths: cost of living A+, health & safety A+, housing A; Watch: crime F, amenities F, commute F.
- Vernon Parish (rural): math 35% / reading 51% proficiency, ranked #18 of 98 in LA (top 18%) — families likely to look elsewhere, expect single-tenant / working-renter base with shorter leases.
- Market conditions: Rents rising fast (+9.6%/yr); 210 active listings in the ZIP; 2 comparable units currently listed for rent nearby; 26 units permitted in Vernon Parish in 2024 (0 in 5+ unit buildings).
- This rent runs 33% of the median local income ($56k/yr) — at the standard rent-burdened threshold; future hikes will face affordability resistance.
Forward outlook
- Local home prices are declining (-3.0%/yr); year-one equity from $1k of loan paydown is wiped out by about $5k of value loss. Plan a longer hold.
- Vernon County population projected at -25% by 2050 — secular population decline; favor cash flow + early exit over multi-decade hold.
- At projected returns (-3.0% appreciation + 8.0% rent growth), your $46k cash investment doubles in ~10 years — after that, you're playing with house money.
Negotiation context
- It's been on market 29 days — a 2% lower offer ($163k) is reasonable based on typical stale-listing flexibility.
- 4 sale attempts since 4y ago with the ask held roughly flat each time — persistent listings suggest the price (not the market) is what's stuck; bring a comps-based counter.
- Current owner paid $90k; list at $165k implies a 83% gain — meaningful room to come down on a strong offer.
Risks & watch-outs
- Climate carrying-cost: severe wind risk, 99% chance of damaging wind over 30y; extreme-heat days projected 7→20/yr by 2055 (HVAC capex compounding) — expect insurance premiums to compound above CPI over the hold.
Questions for the listing agent
- Built in 1977 — when were the roof, HVAC, electrical panel, plumbing, and water heater last replaced?
- Is there a deadline driving the sale (1031 exchange, divorce, estate, relocation)? That informs how much negotiation room exists.
- Schools are B-rated — typically a magnet for longer-tenancy family renters. What's the average tenant stay here, and is there a school-zone premium baked into asking?
- Crime grade is F in this area — have there been break-ins, vandalism, or insurance claims at this property in the last 3 years? What carrier currently insures it and at what premium?
- What's the average days-on-market for RENTAL listings here right now (not sales)? A rising rental-DOM trend means longer vacancies and softer asking-rent achievability than the comps imply.
- What's the recent tenant-quality profile in this submarket — average credit score on applications, eviction rate, late-payment / NSF rate, and stable-employment percentage? A property-management company in the area should have these aggregated.
- How much new for-sale + rental construction is in the pipeline within 1–3 miles? Heavy new supply typically softens prices + rents 12–24 months out; constrained supply supports both.
Investment metrics
- 1% rule
- 0.92% ✗
- Cap rate
- 7.66%
- Cash-on-cash
- 4.87%
- DSCR
- 1.22
- GRM
- 9.0
CMA / ARV
- ARV (on-the-fly)
- $101,563
- Comps found
- 9
Show comp detail 9 sales within ~0.75 mi
| Address | Dist | Beds/Ba | Sqft | Sold | Price | $/sf | Match |
|---|---|---|---|---|---|---|---|
| 1006 Anderson Dr | 0.13mi | 3/1.0 | 1,247 (-6%) | 8mo | $33,500 | $27 | 76 |
| 805 Dennis Ave | 0.30mi | 3/1.0 | 1,231 (-7%) | 4mo | $91,000 | $74 | 70 |
| 907 Dennis Ave | 0.27mi | 3/1.0 | 1,449 (+10%) | 6mo | $70,000 | $48 | 64 |
| 512 Whittington St | 0.38mi | 3/1.5 | 1,208 (-8%) | 9mo | $60,000 | $50 | 61 |
| 804 Marvin Ave | 0.23mi | 3/1.0 | 1,244 (-6%) | 21mo | $106,374 | $86 | 60 |
| 1001 Pinckney Ave | 0.35mi | 3/1.0 | 1,274 (-3%) | 21mo | $115,000 | $90 | 59 |
| 1201 John Paul Jones Ave | 0.51mi | 3/1.0 | 1,221 (-7%) | 6mo | $143,000 | $117 | 56 |
| 507 Whittington St | 0.41mi | 3/1.0 | 1,235 (-6%) | 20mo | $95,000 | $77 | 51 |
| 105 Nelda St | 0.41mi | 3/1.5 | 1,135 (-14%) | 10mo | $135,500 | $119 | 50 |
Match score weights: distance 35% · size 25% · config 20% · recency 20%. Top-matched comps best support the ARV.
Projected returns pro-forma
-3.0% appreciation · 8.0% rent growth · sell at horizon
- IRR
- -3.7%
- Equity multiple
- 0.85×
- Total profit
- $-6,793
- Equity at exit
- $24,602
- IRR
- 10.6%
- Equity multiple
- 1.99×
- Total profit
- $45,903
- Equity at exit
- $14,266
Cash invested: $46,200 (down + closing). Projections, not guarantees.
Landlord ↔ Tenant lean methodology
- Overall (STATE)
- 90 Strongly Landlord-Friendly
- State Louisiana
- 90 Strongly Landlord-Friendly · R+12
- County
- — inherits STATE
- City
- — inherits STATE
ZIP-level market 71446
- Home prices YoY
- -32.1%
- Rents YoY
- 9.6%
- Active inventory
- 210
- Price-to-rent
- 9.0×
Monthly cashflow live
- Estimated rent
- $1,524 medium interval (Pro) →
- Mortgage (P&I)
- −$865
- Tax from tax record
- −$82 /mo · $988/yr
- Insurance
- −$69
- HOA
- −$0
- Vacancy / Maint / Mgmt
- −$320
- Net cashflow
- $188
Break-even live
UW: 25.0% down · 7.5% · 30yr · 1.5% tax · 5.0% vac · 8.0% maint · 8.0% mgmt
Financing live
Cash to close
- Down payment
- $41,250
- Closing costs
- $4,950
- Reserves months
- —
- Total cash needed
- —
Loan-product check · same deal, 3 products live
Conventional
25% down · 7.5% · 30yr
- Down + closing
- —
- Monthly P&I
- —
- Monthly cashflow
- —
- DSCR
- —
- Eligible?
- —
Personal DTI + credit; lowest rate.
DSCR
20% down · 8.5% · 30yr
- Down + closing
- —
- Monthly P&I
- —
- Monthly cashflow
- —
- DSCR
- —
- Eligible?
- —
No personal income docs; deal must DSCR.
Hard money
10% down · 12.0% · 12mo
- Down + closing
- —
- Monthly P&I
- —
- Monthly cashflow
- —
- DSCR
- —
- Eligible?
- —
Short-term bridge; refi at stabilization.
Rent comps 2 comps
| Address | Beds | Baths | Sqft | Rent | $/sqft | DOM | Units | Dist |
|---|---|---|---|---|---|---|---|---|
| 1403 Aaron St Leesville, LA | 3.0 | 1.0 | 926 | $1,050 | $1.13 | 44d | 1 | 0.55mi |
| 1219 Port Arthur Ter Leesville, LA | 3.0 | 2.0 | 1800 | $1,400 | $0.78 | 44d | 1 | 0.92mi |
Listing history 25 events
-
2026-06-19days on market $165,000 Active 29 DOM
-
2026-06-18days on market $165,000 Active 28 DOM
-
2026-06-17days on market $165,000 Active 27 DOM
-
2026-06-16days on market $165,000 Active 26 DOM
-
2026-06-15days on market $165,000 Active 25 DOM
-
2026-06-14days on market $165,000 Active 23 DOM
-
2026-06-12days on market $165,000 Active 22 DOM
-
2026-06-09days on market $165,000 Active 19 DOM
-
2026-06-08days on market $165,000 Active 18 DOM
-
2026-06-07days on market $165,000 Active 17 DOM
-
2026-06-07days on market $165,000 Active 16 DOM
-
2026-06-04days on market $165,000 Active 13 DOM
-
2026-06-02days on market $165,000 Active 12 DOM
-
2026-06-01days on market $165,000 Active 11 DOM
-
2026-05-31days on market $165,000 Active 10 DOM
-
2026-05-31days on market $165,000 Active 9 DOM
-
2026-05-21$165,000 Active
-
2022-11-02status Active
-
2022-10-22status Pending
-
2022-10-03$134,000 Active
-
2022-08-09soldstatus Closed 141-char remark
Show marketing remark (141 chars)
This 3 BedRoom Brick Ranch offers a LivRm and Den, Fenced Yard and equipped with a tenant if you're an investor. Call today for your showing.
-
2022-05-25soldstatus $90,000
-
2022-05-12status Pending 141-char remark
Show marketing remark (141 chars)
This 3 BedRoom Brick Ranch offers a LivRm and Den, Fenced Yard and equipped with a tenant if you're an investor. Call today for your showing.
-
2022-03-11$105,000 Active 141-char remark
Show marketing remark (141 chars)
This 3 BedRoom Brick Ranch offers a LivRm and Den, Fenced Yard and equipped with a tenant if you're an investor. Call today for your showing.
-
2005-03-03soldstatus
ⓘ Source: listings_history table (triggers on properties + properties_extension) + one-shot
backfill from property_details.listing_events for pre-trigger history.
Tax reassessment forecast LA · Resets to sale price
- Current annual tax
- $988 · $82/mo
- Projected year-2 tax
- $988 · $82/mo
- Expected delta
- $0/yr ($0/mo · 0.0%)
ⓘ Screening estimate from a state-policy table — verify with the county assessor before closing.
Climate risk First Street
- Flood 1/10 Low FEMA zone X (unshaded) · 0% chance over 30 yrs
- Wildfire 4/10 Moderate
- Heat 8/10 Severe 7 d/yr ≥110°F today · 20 d/yr by 30 yrs out
- Wind 8/10 Severe 99% chance of damaging wind over 30 yrs
- Air quality 1/10 Low 0 unhealthy d/yr today · 0 by 30 yrs out
Nearby sold comps map
Loading sold comps map…
Walkable amenities ~0.75 mi
Loading nearby amenities…
Taxation est. · year 1
- Rental income
- $18,287
- − Mortgage interest
- −$9,243
- − Property taxes
- −$988
- − Insurance
- −$825
- − Repairs & maintenance
- −$1,463
- − Management
- −$1,463
- − Depreciation
- −$4,800
- Taxable loss
- −$495
- Est. tax savings @ 24.0%
- +$119
- After-tax cash flow
- $2,369/yr
For passive investors: Depreciation is non-cash, so a rental often shows a tax loss while cash-flowing — sheltering income. Rental losses are passive: they offset passive income freely, and up to $25,000/yr can offset ordinary (W-2) income if you actively participate and your MAGI is under $100k (phasing out to $0 by $150k); unused losses carry forward. On sale, claimed depreciation is recaptured at up to 25%, and gains may owe capital-gains tax (a 1031 exchange can defer both). Figures are a year-1 estimate at your 24.0% rate — not tax advice; consult a CPA.
Schools (NCES district)
- District
- Vernon Parish
- NCES district ID
- 2201830
- Math proficiency
- 35% ▼ -42.00%
- Reading proficiency
- 51% ▼ -32.00%
- Median HH income
- $44,822
- Composite
- 36.42/100
- National rank
- #4674
- State rank
- #18 of 98 in LA
Livability — Leesville
- Score
- 73/100
- State rank
- #30
- US rank
- #5046
Category grades
Schools grade is shown separately in the Schools card above.
Census & demographics
- Census place
- Leesville, LA
- County
- Vernon Parish · 21,275 people
- City population
- 21,275
- Metro
- Fort Polk South, LA
- Population (ZIP)
- 21,275
- Household income
- $55,925
- Rent vs Own
- Severe rent burden
- 659.0
Population outlook (Vernon County) Hauer SSP2
- Today (2025)
- 45,401 people
- By 2030
- 43,015 · -5.3%
- By 2040
- 38,171 · -15.9%
- By 2050
- 34,087 · -24.9%
- By 2075
- 28,267 · -37.7%
- By 2100
- 25,486 · -43.9%
Race, ethnicity, and origin ACS 2023
- Neighborhood character
- Predominantly White (72%)
- Race & ethnicity
- White 72% Black 16% Hispanic / Latino 6% Two or more races 5% Asian 2% Native American 1%
- Hispanic origin (detail)
- Mexican 3% Puerto Rican 1%
- Common ancestry
- Lithuanian 3% Slovak 1% Romanian 1%
- Foreign-born
- 3% · Canada, South Korea, Vietnam
- Languages at home
- 94% English-only · Spanish 3% French/Haitian/Cajun 1%
Political lean MEDSL · Vernon
- 2024 margin
- Solid R (+67.9) · D 15.6% · R 83.4% · Other 1.0%
- 2008→2024 swing
- -14.5pp toward R · 2008: -53.4pp · 2024: -67.9pp
- All cycles
- 2024: R+67.9 2020: R+64.9 2016: R+65.0 2012: R+57.5 2008: R+53.4
Not yet ingested
- Civics
- —
Market trends
- HPI YoY
- ▼ -61.06%
- Current HPI
- 128.8849
- Rent YoY
- ▲ 9.60%
- Metro
- Fort Polk South, LA
- State GDP YoY
- ▲ 3.29%
- F500 in state
- 10
Industry mix (Fortune 500 HQ in LA)
| Industry | F500 HQs | Revenue |
|---|---|---|
| Telecommunications | 2 | $23B |
|
||
| Utilities | 1 | $12B |
|
||
| Wholesale / Distribution | 1 | $5B |
|
||
| Advertising | 1 | $2B |
|
||
Price history
+57.1% since first listed9 events — show timeline
- 2026-05-21 Listed $165,000 GFPAR
- 2022-11-02 Relisted — GFPAR
- 2022-10-22 Pending — GFPAR
- 2022-10-03 Listed $134,000 GFPAR
- 2022-08-09 Sold (MLS) — GFPAR
- 2022-05-25 Sold (Public Records) $90,000 Public Records
- 2022-05-12 Pending — GFPAR
- 2022-03-11 Listed $105,000 GFPAR
- 2005-03-03 Sold (MLS) — GFPAR
Property tax history
+6.3%/yrLatest (2025): $988 · -0.8% YoY. Source: county tax records.
Cash-flow waterfall
monthlySold comps — $/sqft
last 12 mo · ≤1 miLoading sold comps…