 🏗️ New Construction
6405 N 169 St · Omaha, NE
Flood risk 1/10 · Minimal
- FEMA flood zone
- X (unshaded)
- Chance of flooding over 30 yrs
- 0.0%
- Est. flood insurance / yr
- $507 – $1,088
Fire risk 1/10 · Minimal
- Est. fire insurance / yr
- $1,161 – $2,155
Heat risk 3/10 · Minor
- Hot days now (above 104°F)
- 7 days/yr
- Hot days in 30 yrs
- 16 days/yr
Wind risk 2/10 · Minimal
- Chance of severe wind over 30 yrs
- —
Air-quality risk 1/10 · Minimal
- Unhealthy air days now
- 0 days/yr
- Unhealthy air days in 30 yrs
- 0 days/yr
Risk factors via First Street. Map © Google.
Why this score? — see what drove the D- grade
The composite is a weighted blend of 9 inputs, each scored 0–100. Each bar is that input's sub-score; the figure is the points it added to the 100-point composite (weight × sub-score).
- Cash flow +10.3/30.0
- ARV discount +7.5/15.0
- Schools +6.1/10.0
- Livability +4.2/5.0
- Rent growth +3.1/5.0
- DSCR +3.0/10.0
- Condition / age +2.5/5.0
- 1% rule +1.7/10.0
- Appreciation +0.0/10.0
$413,700
🖨 Deal sheet (PDF) 📄 Offer letter ✓ Due diligence
Listing remarks
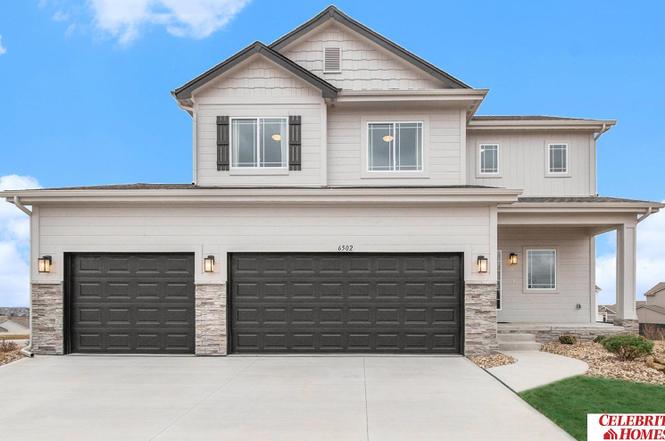
Welcome to The Grayson EXP by Celebrity Homes. This Open Design begins with a large Gathering Room shared with a spacious Eat-In Island Kitchen and Dining Area. The raised ceilings of the main level give the feeling of even more space. As you enter the Grayson a Home Study is near the foyer. The placement is intended to allow for privacy and quiet. Another added benefit… The Upper-Level Laundry Room. The Owner’s Suite is appointed with a walk-in closet, ¾ Privacy Bath Design with a Dual Vanity. Features of this 4 Bedroom, 3 Bath Home Include: 3 Car Garage with a Garage Door Openers, Refrigerator, Washer/Dryer Package, Quartz
Key facts
- 0.25 acre lot
- 3 garage spots
- Built 2026
Neighborhood map
What this means for you Summary
Snapshot
- This is a 4-bed/2.5-bath other listed at $414k.
Deal economics
- At list price, monthly cash flow is $-227 ($-3k/yr) — negative.
- To cash-flow at today's rent, offer at most $374k (9.7% below list).
- To meet the 1% rule (rent ≥ 1% of price), the offer needs to be $279k (32.6% below list).
- Recommended offer: $279k (32.6% below list) — sets the bar for 1% rule.
- Cap rate 5.6% vs local median 3.6% in Omaha — top-decile yield for the area; either an underpriced asset or a hidden risk that comps aren't pricing in. Stress-test before assuming the spread holds.
Location & tenants
- Location reads 84/100 on livability (#7 in NE, #663 nationally) — a professional / high-income tenant draw. Strengths: amenities A+, commute A+, cost of living A+; Watch: crime F.
- Bennington Public Schools (rural): math 67% / reading 67% proficiency, ranked #3 of 111 in NE (top 3%) — acceptable for families but not a draw, mixed tenant base, ~2y average lease; only 6% free/reduced lunch — higher-income household profile.
- Zoned schools: Anchor Pointe Elementary (math 65% / reading 71%, grade B+, #63 of 502 statewide, top 12%, 475 students, 8% FRL); Bennington Middle School (math 64% / reading 63%, grade B+, #13 of 128 statewide, top 10%, 410 students, 19% FRL); Bennington High School (math 66% / reading 70%, grade B, #21 of 261 statewide, top 8%, 1,002 students, 14% FRL).
- Market conditions: Rents rising (+2.5%/yr); 173 active listings in the ZIP; 9 comparable units currently listed for rent nearby; rentals leasing fast (median 3d on market — plan ~1-2 weeks tenant-placement turnaround); high-income renter base; 4,539 units permitted in Douglas County in 2024 (2,583 in 5+ unit buildings).
Forward outlook
- Local home prices are declining (-3.0%/yr); year-one equity from $3k of loan paydown is wiped out by about $12k of value loss. Plan a longer hold.
- Douglas County population projected at +28% by 2050 — long-run rental-demand tailwind backs the buy-and-hold thesis.
Negotiation context
- Only 0 days on market — expect competitive offers; lowballing is unlikely to land.
Questions for the listing agent
- What do current leases actually rent for vs. the listed asking? Can we see a recent rent roll and the last 12 months of T-12 income?
- What does the HOA fee cover, when was the last increase, and are there any pending special assessments or reserve-fund shortfalls?
- Is there a deadline driving the sale (1031 exchange, divorce, estate, relocation)? That informs how much negotiation room exists.
- Crime grade is F in this area — have there been break-ins, vandalism, or insurance claims at this property in the last 3 years? What carrier currently insures it and at what premium?
- The area grade is low — what's the realistic commute time and amenity access for the typical tenant pool here? Any planned neighborhood developments (good or bad) we should know about?
- What's the average days-on-market for RENTAL listings here right now (not sales)? A rising rental-DOM trend means longer vacancies and softer asking-rent achievability than the comps imply.
- What's the recent tenant-quality profile in this submarket — average credit score on applications, eviction rate, late-payment / NSF rate, and stable-employment percentage? A property-management company in the area should have these aggregated.
- How much new for-sale + rental construction is in the pipeline within 1–3 miles? Heavy new supply typically softens prices + rents 12–24 months out; constrained supply supports both.
Investment metrics
- 1% rule
- 0.67% ✗
- Cap rate
- 5.63%
- Cash-on-cash
- -2.35%
- DSCR
- 0.90
- GRM
- 12.4
CMA / ARV
No comps found within radius.
Projected returns pro-forma
-3.0% appreciation · 2.54% rent growth · sell at horizon
- IRR
- -20.7%
- Equity multiple
- 0.28×
- Total profit
- $-82,994
- Equity at exit
- $61,684
- IRR
- -15.0%
- Equity multiple
- 0.16×
- Total profit
- $-97,000
- Equity at exit
- $35,769
Cash invested: $115,836 (down + closing). Projections, not guarantees.
Landlord ↔ Tenant lean methodology
- Overall (STATE)
- 83 Strongly Landlord-Friendly
- State Nebraska
- 83 Strongly Landlord-Friendly · R+13
- County
- — inherits STATE
- City
- — inherits STATE
ZIP-level market 68116
- Home prices YoY
- -15.4%
- Rents YoY
- 2.5%
- Active inventory
- 173
- Price-to-rent
- 12.4×
Monthly cashflow live
- Estimated rent
- $2,788 high interval (Pro) →
- Mortgage (P&I)
- −$2,169
- Tax from tax record
- −$78 /mo · $934/yr
- Insurance
- −$172
- HOA
- −$10
- Vacancy / Maint / Mgmt
- −$586
- Net cashflow
- $-227
Break-even live
Sensitivity live
| Price | -10% $7 | -5% $-110 | +0% $-227 | +5% $-344 | +10% $-461 |
|---|---|---|---|---|---|
| Rent | -10% $-447 | -5% $-337 | +0% $-227 | +5% $-117 | +10% $-7 |
| Rate | -1.0pp $-19 | -0.5pp $-122 | base $-227 | +0.5pp $-334 | +1.0pp $-443 |
UW: 25.0% down · 7.5% · 30yr · 1.5% tax · 5.0% vac · 8.0% maint · 8.0% mgmt
Financing live
Cash to close
- Down payment
- $103,425
- Closing costs
- $12,411
- Reserves months
- —
- Total cash needed
- —
Loan-product check · same deal, 3 products live
Conventional
25% down · 7.5% · 30yr
- Down + closing
- —
- Monthly P&I
- —
- Monthly cashflow
- —
- DSCR
- —
- Eligible?
- —
Personal DTI + credit; lowest rate.
DSCR
20% down · 8.5% · 30yr
- Down + closing
- —
- Monthly P&I
- —
- Monthly cashflow
- —
- DSCR
- —
- Eligible?
- —
No personal income docs; deal must DSCR.
Hard money
10% down · 12.0% · 12mo
- Down + closing
- —
- Monthly P&I
- —
- Monthly cashflow
- —
- DSCR
- —
- Eligible?
- —
Short-term bridge; refi at stabilization.
Rent comps 9 comps
| Address | Beds | Baths | Sqft | Rent | $/sqft | DOM | Units | Dist |
|---|---|---|---|---|---|---|---|---|
| 7308 N 167th Ave Bennington, NE | 4.0 | 3.0 | 2213 | $3,000 | $1.36 | 3d | 1 | 0.57mi |
| 6220 N 160th Ave Omaha, NE | 1.0–3.0 | 1.0–2.5 | 1137 | $2,690 | $2.36 | 3d | 13 | 0.76mi |
| 16333 Potter St Bennington, NE | 3.0 | 2.0 | 1618 | $3,200 | $1.98 | 3d | 1 | 0.88mi |
| 17214 Meredith Ave Unit LO Omaha, NE | 4.0 | 3.0 | 2605 | $3,100 | $1.19 | 3d | 1 | 1.20mi |
| 5903 N 183rd St Elkhorn, NE | 4.0 | 3.0 | 2741 | $2,800 | $1.02 | 25d | 1 | 1.22mi |
| 4309 N 175th Ave Omaha, NE | 4.0 | 3.0 | 2970 | $2,995 | $1.01 | 25d | 1 | 1.39mi |
| 4113 N 170th St Omaha, NE | 3.0 | 2.0 | 1469 | $2,150 | $1.46 | 45d | 1 | 1.41mi |
| 17451 Tucker St Bennington, NE | 3.0 | 3.5 | 2442 | $3,100 | $1.27 | 25d | 1 | 1.44mi |
| 15702 Fowler Plz Omaha, NE | 3.0 | 1.0–2.0 | 981 | $2,505 | $2.55 | 3d | 25 | 1.46mi |
HOA detail
- Monthly dues
- $10 · $120/yr
Listing history 2 events
-
2025-10-07$413,700
-
2025-10-07historical
ⓘ Source: listings_history table (triggers on properties + properties_extension) + one-shot
backfill from property_details.listing_events for pre-trigger history.
Tax reassessment forecast NE · Resets to sale price
- Current annual tax
- $934 · $78/mo
- Projected year-2 tax
- $7,157 · $596/mo
- Expected delta
- +$6,223/yr (+$519/mo · 666.2%)
ⓘ Screening estimate from a state-policy table — verify with the county assessor before closing.
Climate risk First Street
- Flood 1/10 Low FEMA zone X (unshaded) · 0% chance over 30 yrs
- Wildfire 1/10 Low
- Heat 3/10 Moderate 7 d/yr ≥104°F today · 16 d/yr by 30 yrs out
- Wind 2/10 Low
- Air quality 1/10 Low 0 unhealthy d/yr today · 0 by 30 yrs out
Nearby sold comps map
Loading sold comps map…
Walkable amenities ~0.75 mi
Loading nearby amenities…
Taxation est. · year 1
- Rental income
- $33,461
- − Mortgage interest
- −$23,174
- − Property taxes
- −$934
- − Insurance
- −$2,068
- − Repairs & maintenance
- −$2,677
- − Management
- −$2,677
- − HOA
- −$120
- − Depreciation
- −$12,035
- Taxable loss
- −$10,224
- Est. tax savings @ 24.0%
- +$2,454
- After-tax cash flow
- $-269/yr
For passive investors: Depreciation is non-cash, so a rental often shows a tax loss while cash-flowing — sheltering income. Rental losses are passive: they offset passive income freely, and up to $25,000/yr can offset ordinary (W-2) income if you actively participate and your MAGI is under $100k (phasing out to $0 by $150k); unused losses carry forward. On sale, claimed depreciation is recaptured at up to 25%, and gains may owe capital-gains tax (a 1031 exchange can defer both). Figures are a year-1 estimate at your 24.0% rate — not tax advice; consult a CPA.
Schools (NCES district)
- District
- Bennington Public Schools
- NCES district ID
- 3103990
- Math proficiency
- 67% ▼ -6.00%
- Reading proficiency
- 67% ▼ -7.00%
- Median HH income
- $87,771
- Composite
- 60.5/100
- National rank
- #843
- State rank
- #3 of 111 in NE
Livability — Omaha
- Score
- 84/100
- State rank
- #7
- US rank
- #663
Category grades
Schools grade is shown separately in the Schools card above.
Census & demographics
- County
- Douglas County · 538,646 people
- City population
- 552,986
- Metro
- Omaha-Council Bluffs, NE-IA
- Population (ZIP)
- 34,501
- Household income
- $121,165
- Rent vs Own
- Severe rent burden
- 550.0
Population outlook (Douglas County) Hauer SSP2
- Today (2025)
- 625,245 people
- By 2030
- 661,613 · +5.8%
- By 2040
- 732,395 · +17.1%
- By 2050
- 801,988 · +28.3%
- By 2075
- 968,637 · +54.9%
- By 2100
- 1,101,871 · +76.2%
Race, ethnicity, and origin ACS 2023
- Neighborhood character
- Predominantly White (77%)
- Race & ethnicity
- White 77% Two or more races 8% Black 6% Hispanic / Latino 6% Asian 6%
- Hispanic origin (detail)
- Mexican 3%
- Common ancestry
- Romanian 4% Italian 3% Portuguese 3%
- Foreign-born
- 8% · Canada, Vietnam, China
- Languages at home
- 89% English-only · Other Indo-European 3% Spanish 3% Other Asian/Pacific 1%
Political lean MEDSL · Douglas
- 2024 margin
- D (+10.2) · D 54.4% · R 44.2% · Other 1.4%
- 2008→2024 swing
- +5.5pp toward D · 2008: 4.6pp · 2024: 10.2pp
- All cycles
- 2024: D+10.2 2020: D+11.3 2016: D+1.4 2012: R+4.3 2008: D+4.6
Not yet ingested
- Civics
- —
Market trends
- HPI YoY
- ▼ -40.81%
- Current HPI
- 223.573
- Rent YoY
- ▲ 2.54%
- Metro
- Omaha-Council Bluffs, NE-IA
- State GDP YoY
- ▲ 0.68%
- F500 in state
- 2
Industry mix (Fortune 500 HQ in NE)
| Industry | F500 HQs | Revenue |
|---|---|---|
| Conglomerate | 1 | $371B |
|
||
Price history
2 events — show timeline
- 2025-10-07 Listing Removed — GPRMLS
- 2025-10-07 Listed $413,700 GPRMLS
Property tax history
+0.3%/yrLatest (2025): $934 · +11.8% YoY. Source: county tax records.
Cash-flow waterfall
monthlySold comps — $/sqft
last 12 mo · ≤1 miLoading sold comps…