3263 Savalli St Unit D · Winchester, NV
Flood risk 1/10 · Minimal
- FEMA flood zone
- X (unshaded)
- Chance of flooding over 30 yrs
- 0.0%
- Est. flood insurance / yr
- $507 – $1,088
Fire risk 1/10 · Minimal
- Est. fire insurance / yr
- $490 – $910
Heat risk 8/10 · Major
- Hot days now (above 106°F)
- 7 days/yr
- Hot days in 30 yrs
- 18 days/yr
Wind risk 1/10 · Minimal
- Chance of severe wind over 30 yrs
- —
Air-quality risk 3/10 · Minor
- Unhealthy air days now
- 2 days/yr
- Unhealthy air days in 30 yrs
- 3 days/yr
Risk factors via First Street. Map © Google.
Why this score? — see what drove the D- grade
The composite is a weighted blend of 9 inputs, each scored 0–100. Each bar is that input's sub-score; the figure is the points it added to the 100-point composite (weight × sub-score).
- Cash flow +12.5/30.0
- ARV discount +7.5/15.0
- 1% rule +4.8/10.0
- Livability +4.0/5.0
- DSCR +3.7/10.0
- Schools +2.6/10.0
- Condition / age +2.5/5.0
- Rent growth +2.0/5.0
- Appreciation +0.0/10.0
$149,990
🖨 Deal sheet 📄 Offer letter ✓ Due diligence
Listing remarks MLS
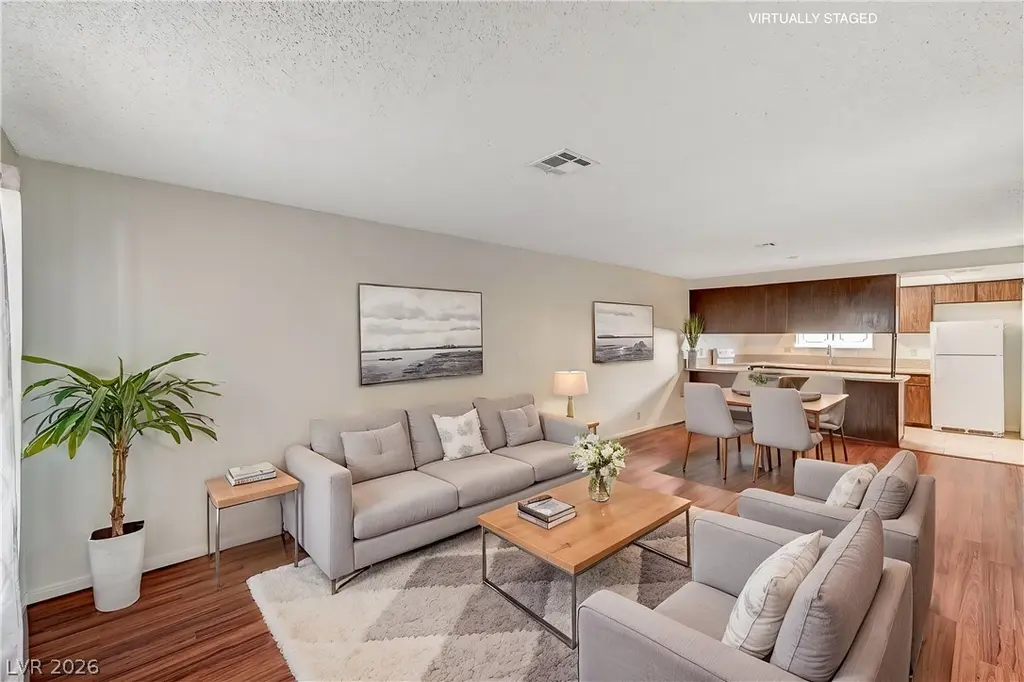
Not a short sale, flip or forelosure. New Stove, refrigerator and Diswhwasher to be installed for closing. Two Bedroom Two bath second level condo near The Strip.
Key facts
- $283 HOA
- Parking
- Built 1980
Property features AI
Finance
- HOA & community: Part of Savalli Estates HOA; HOA fee $283 monthly (includes security)
Exterior
- Parking: Assigned parking (one space)
- Security: HOA-provided security
- Utilities: Public water; Public sewer; Underground utilities; No photovoltaics
- Home design: Multi-family property; 2 stories; Property faces north; Has attached property
- Construction: Tile roof; Resale property
- Exterior features: Balcony
Interior
- Kitchen: Gas range; Microwave; Disposal; Laminate countertops; Refrigerator
- Bedrooms: 2 possible bedrooms; Bedroom 2 with closet (12 x 9)
- Flooring: Laminate
- Bathrooms: 2 full bathrooms; Tub/shower combo
- Heating & cooling: Central heating (gas); Central air (electric)
- Interior features: Unfurnished; Window treatments
- Laundry & utility: Washer; Dryer; Gas dryer hookup; Laundry closet
Neighborhood map
What this means for you Summary
Snapshot
- This is a 2-bed/2.0-bath condo listed at $150k.
Deal economics
- At list price, monthly cash flow is $-21 ($-248/yr) — negative.
- To cash-flow at today's rent, offer at most $146k (2.4% below list).
- To meet the 1% rule (rent ≥ 1% of price), the offer needs to be $148k (1.6% below list).
- Recommended offer: $146k (2.4% below list) — sets the bar for cash-flow.
Location & tenants
- Location reads 79/100 on livability (#3 in NV, #2,272 nationally) — a middle-class / working-renter tenant base. Strengths: commute A+, cost of living A+, housing A+; Watch: crime F, employment D-.
- Clark County School District (urban): math 21% / reading 39% proficiency, ranked #11 of 17 in NV (top 65%) — families likely to look elsewhere, expect single-tenant / working-renter base with shorter leases.
- Market conditions: Rents soft (-2.1%/yr); 140 active listings in the ZIP; 40 comparable units currently listed for rent nearby; rentals lingering (median 44d on market — plan ~5-8 weeks vacancy on turnover, expect pricing pressure); 85% of comp listings sitting > 30 days — soft ceiling on asking rent; 14,754 units permitted in Clark County in 2024 (2,301 in 5+ unit buildings).
- This rent runs 36% of the median local income ($50k/yr) — at the standard rent-burdened threshold; future hikes will face affordability resistance.
Forward outlook
- Local home prices are declining (-3.0%/yr); year-one equity from $1k of loan paydown is wiped out by about $4k of value loss. Plan a longer hold.
- Clark County population projected at +36% by 2050 — long-run rental-demand tailwind backs the buy-and-hold thesis.
Negotiation context
- Only 11 days on market — expect competitive offers; lowballing is unlikely to land.
- 2 sale attempts since 13y ago with the ask held roughly flat each time — persistent listings suggest the price (not the market) is what's stuck; bring a comps-based counter.
Risks & watch-outs
- Climate carrying-cost: extreme-heat days projected 7→18/yr by 2055 (HVAC capex compounding) — expect insurance premiums to compound above CPI over the hold.
Questions for the listing agent
- What do current leases actually rent for vs. the listed asking? Can we see a recent rent roll and the last 12 months of T-12 income?
- What does the HOA fee cover, when was the last increase, and are there any pending special assessments or reserve-fund shortfalls?
- Any open or pending special assessments — roof, HVAC, plumbing, elevator, façade? What's the per-unit balance and payoff schedule, and is the seller paying it off at close or rolling it to the buyer?
- Is there a deadline driving the sale (1031 exchange, divorce, estate, relocation)? That informs how much negotiation room exists.
- Crime grade is F in this area — have there been break-ins, vandalism, or insurance claims at this property in the last 3 years? What carrier currently insures it and at what premium?
- The area grade is low — what's the realistic commute time and amenity access for the typical tenant pool here? Any planned neighborhood developments (good or bad) we should know about?
- What's the average days-on-market for RENTAL listings here right now (not sales)? A rising rental-DOM trend means longer vacancies and softer asking-rent achievability than the comps imply.
- What's the recent tenant-quality profile in this submarket — average credit score on applications, eviction rate, late-payment / NSF rate, and stable-employment percentage? A property-management company in the area should have these aggregated.
- How much new apartment / multifamily construction is in the pipeline within 1–3 miles? Heavy new supply (>2% of stock underway) typically softens rents 12–24 months out; light construction supports rent growth.
Investment metrics
- 1% rule
- 0.98% ✗
- Cap rate
- 6.13%
- Cash-on-cash
- -0.59%
- DSCR
- 0.97
- GRM
- 8.5
CMA / ARV
No comps found within radius.
Projected returns pro-forma
-3.0% appreciation · 0.0% rent growth · sell at horizon
- IRR
- -21.1%
- Equity multiple
- 0.29×
- Total profit
- $-29,834
- Equity at exit
- $22,364
- IRR
- -25.5%
- Equity multiple
- -0.05×
- Total profit
- $-43,926
- Equity at exit
- $12,968
Cash invested: $41,997 (down + closing). Projections, not guarantees.
Landlord ↔ Tenant lean methodology
- Overall (STATE)
- 71 Landlord-Friendly
- State Nevada
- 71 Landlord-Friendly · R+1
- County
- — inherits STATE
- City
- — inherits STATE
ZIP-level market 89102
- Rents YoY
- -2.1%
- Active inventory
- 140
- Price-to-rent
- 8.5×
Monthly cashflow live
- Estimated rent
- $1,476 high interval (Pro) →
- Mortgage (P&I)
- −$787
- Tax from tax record
- −$54 /mo · $654/yr
- Insurance
- −$62
- HOA
- −$283
- Vacancy / Maint / Mgmt
- −$310
- Net cashflow
- $-21
Break-even live
UW: 25.0% down · 7.5% · 30yr · 1.5% tax · 5.0% vac · 8.0% maint · 8.0% mgmt
Financing live
Cash to close
- Down payment
- $37,498
- Closing costs
- $4,500
- Reserves months
- —
- Total cash needed
- —
Loan-product check · same deal, 3 products live
Conventional
25% down · 7.5% · 30yr
- Down + closing
- —
- Monthly P&I
- —
- Monthly cashflow
- —
- DSCR
- —
- Eligible?
- —
Personal DTI + credit; lowest rate.
DSCR
20% down · 8.5% · 30yr
- Down + closing
- —
- Monthly P&I
- —
- Monthly cashflow
- —
- DSCR
- —
- Eligible?
- —
No personal income docs; deal must DSCR.
Hard money
10% down · 12.0% · 12mo
- Down + closing
- —
- Monthly P&I
- —
- Monthly cashflow
- —
- DSCR
- —
- Eligible?
- —
Short-term bridge; refi at stabilization.
Rent comps 40 comps
| Address | Beds | Baths | Sqft | Rent | $/sqft | DOM | Units | Dist |
|---|---|---|---|---|---|---|---|---|
| 3240 Cameron St Unit A Las Vegas, NV | 2.0 | 2.0 | 922 | $1,300 | $1.41 | 43d | 1 | 0.08mi |
| 3221 Jericho St Unit C Las Vegas, NV | 2.0 | 2.0 | 922 | $1,175 | $1.27 | 43d | 1 | 0.09mi |
| 3221 Jericho St Unit D Las Vegas, NV | 2.0 | 2.0 | 922 | $1,700 | $1.84 | 43d | 1 | 0.09mi |
| 3355 Arville St Las Vegas, NV | 1.0–2.0 | 1.0 | 700 | $1,642 | $2.35 | 43d | 11 | 0.14mi |
| 3481 Myrtle Ave Las Vegas, NV | 2.0 | 1.0 | 864 | $1,700 | $1.97 | 43d | 1 | 0.26mi |
| 4545 Pennwood Ave Las Vegas, NV | 1.0–2.0 | 1.0–2.0 | 725 | $1,225 | $1.69 | 43d | 6 | 0.44mi |
| 4747 Pennwood Ave Las Vegas, NV | 1.0–2.0 | 1.0–2.0 | 839 | $1,577 | $1.88 | 43d | 25 | 0.45mi |
| 3649 Van Dyke Ave Las Vegas, NV | 2.0 | 2.0 | 922 | $1,200 | $1.30 | 43d | 1 | 0.47mi |
| 3639 Kolendo Ct Unit A Las Vegas, NV | 2.0 | 2.0 | 912 | $999 | $1.10 | 43d | 1 | 0.49mi |
| 5061 Pioneer Ave #202 Las Vegas, NV | 2.0 | 2.0 | 1105 | $1,590 | $1.44 | 43d | 1 | 0.50mi |
| 2950 S Decatur Blvd Las Vegas, NV | 2.0 | 1.0–2.0 | 690 | $1,608 | $2.33 | 43d | 22 | 0.52mi |
| 3625 S Decatur Blvd Las Vegas, NV | 1.0–3.0 | 1.0–2.0 | 957 | $1,699 | $1.77 | 1d | 28 | 0.55mi |
| 3335 Hauck St Las Vegas, NV | 1.0–2.0 | 1.0–2.0 | 867 | $1,450 | $1.67 | 43d | 10 | 0.58mi |
| 4080 W Twain Ave Las Vegas, NV | 1.0–3.0 | 1.0–2.0 | 858 | $1,750 | $2.04 | 43d | 8 | 0.65mi |
| 3800 S Decatur Blvd Las Vegas, NV | 3.0 | 2.0 | 960 | $1,900 | $1.98 | 43d | 1 | 0.68mi |
| 2851 S Decatur Blvd Las Vegas, NV | 1.0–2.0 | 1.0–2.0 | 866 | $1,704 | $1.97 | 43d | 15 | 0.73mi |
| 5353 W Desert Inn Rd Las Vegas, NV | 1.0–3.0 | 1.0–2.0 | 995 | $1,748 | $1.76 | 43d | 18 | 0.77mi |
| 3463 Procyon St Las Vegas, NV | 3.0 | 1.0–2.0 | 1043 | $2,281 | $2.19 | 2d | 29 | 0.80mi |
| 2666 S Decatur Blvd Las Vegas, NV | 1.0–3.0 | 1.0–2.0 | 938 | $1,719 | $1.83 | 43d | 15 | 0.81mi |
| 3475 W Desert Inn Rd Las Vegas, NV | 1.0–3.0 | 1.0–2.0 | 1105 | $2,550 | $2.31 | 4d | 100 | 0.89mi |
| 2683 S Decatur Blvd Las Vegas, NV | 1.0–2.0 | 1.0–2.0 | 785 | $1,450 | $1.85 | 43d | 16 | 0.95mi |
| 4521 Via Torino Las Vegas, NV | 3.0 | 2.0 | 1036 | $2,150 | $2.08 | 43d | 1 | 0.97mi |
| 4381 W Flamingo Rd Las Vegas, NV | 4.0 | 1.0–4.5 | 3300 | $21,200 | $6.42 | 4d | 8 | 1.09mi |
| 4550 W Sahara Ave Las Vegas, NV | 1.0–2.0 | 1.0–2.0 | 867 | $1,475 | $1.70 | 43d | 15 | 1.16mi |
| 3150 W Twain Ave Las Vegas, NV | 1.0–3.0 | 1.0–2.0 | 1039 | $2,088 | $2.01 | 1d | 12 | 1.24mi |
| 3850 W Nevso Dr Las Vegas, NV | 2.0 | 1.0–2.0 | 1042 | $2,772 | $2.66 | 1d | 19 | 1.25mi |
| 4201 S Decatur Blvd Las Vegas, NV | 1.0–2.0 | 1.0–2.0 | 800 | $1,502 | $1.88 | 43d | 26 | 1.30mi |
| 4320 Sandy River Dr #96 Las Vegas, NV | 2.0 | 1.0 | 816 | $1,250 | $1.53 | 43d | 1 | 1.35mi |
| 5100 Obannon Dr Las Vegas, NV | 2.0 | 1.0–2.0 | 845 | $1,338 | $1.58 | 43d | 5 | 1.36mi |
| 4990 River Glen Dr #168 Las Vegas, NV | 2.0 | 1.0 | 816 | $1,300 | $1.59 | 43d | 1 | 1.37mi |
| 5026 River Glen Dr #159 Las Vegas, NV | 2.0 | 1.0 | 816 | $1,275 | $1.56 | 43d | 1 | 1.38mi |
| 2301 S Valley View Blvd Las Vegas, NV | 1.0 | 1.0 | 624 | $1,504 | $2.41 | 43d | 6 | 1.38mi |
| 5062 River Glen Dr #151 Las Vegas, NV | 2.0 | 1.0 | 816 | $1,200 | $1.47 | 43d | 1 | 1.38mi |
| 5101 Obannon Dr Las Vegas, NV | 2.0 | 2.0 | 935 | $1,470 | $1.57 | 43d | 6 | 1.39mi |
| 4721 River Glen Dr Unit 17 Las Vegas, NV | 2.0 | 1.0 | 816 | $1,500 | $1.84 | 43d | 1 | 1.40mi |
| 5044 River Glen Dr #148 Las Vegas, NV | 2.0 | 1.0 | 816 | $1,750 | $2.14 | 43d | 1 | 1.40mi |
| 4961 River Glen Dr #28 Las Vegas, NV | 2.0 | 1.0 | 816 | $1,499 | $1.84 | 43d | 1 | 1.41mi |
| 5525 W Flamingo Rd #2016 Las Vegas, NV | 1.0 | 1.0 | 870 | $1,050 | $1.21 | 43d | 1 | 1.43mi |
| 5041 River Glen Dr #91 Las Vegas, NV | 2.0 | 1.0 | 816 | $1,350 | $1.65 | 43d | 1 | 1.44mi |
| 4200 S Valley View Blvd Las Vegas, NV | 2.0–3.0 | 2.0 | 1079 | $1,725 | $1.60 | 43d | 2 | 1.44mi |
HOA detail condo
- Monthly dues
- $283 · $3,396/yr
- Assessments
- None detected in remarks — confirm with the listing agent.
Listing history 7 events
-
2026-05-08status Pending 375-char remark
-
2026-04-27$149,990 Active 375-char remark
-
2013-06-19soldstatus $60,000 Sold 162-char remark
Show marketing remark (162 chars)
Not a short sale, flip or forelosure. New Stove, refrigerator and Diswhwasher to be installed for closing. Two Bedroom Two bath second level condo near The Strip.
-
2013-06-11soldstatus $60,000
-
2013-05-16historical Contingent Offer 162-char remark
Show marketing remark (162 chars)
Not a short sale, flip or forelosure. New Stove, refrigerator and Diswhwasher to be installed for closing. Two Bedroom Two bath second level condo near The Strip.
-
2013-02-25$65,000 Exclusive Right 162-char remark
Show marketing remark (162 chars)
Not a short sale, flip or forelosure. New Stove, refrigerator and Diswhwasher to be installed for closing. Two Bedroom Two bath second level condo near The Strip.
-
1981-10-08soldstatus $48,650
ⓘ Source: listings_history table (triggers on properties + properties_extension) + one-shot
backfill from property_details.listing_events for pre-trigger history.
Tax reassessment forecast NV · Resets to sale price
- Current annual tax
- $654 · $54/mo
- Projected year-2 tax
- $885 · $74/mo
- Expected delta
- +$231/yr (+$19/mo · 35.4%)
ⓘ Screening estimate from a state-policy table — verify with the county assessor before closing.
Climate risk First Street
- Flood 1/10 Low FEMA zone X (unshaded) · 0% chance over 30 yrs
- Wildfire 1/10 Low
- Heat 8/10 Severe 7 d/yr ≥106°F today · 18 d/yr by 30 yrs out
- Wind 1/10 Low
- Air quality 3/10 Moderate 2 unhealthy d/yr today · 3 by 30 yrs out
Nearby sold comps map
Loading sold comps map…
Walkable amenities ~0.75 mi
Loading nearby amenities…
Taxation est. · year 1
- Rental income
- $17,709
- − Mortgage interest
- −$8,402
- − Property taxes
- −$654
- − Insurance
- −$750
- − Repairs & maintenance
- −$1,417
- − Management
- −$1,417
- − HOA
- −$3,396
- − Depreciation
- −$4,363
- Taxable loss
- −$2,689
- Est. tax savings @ 24.0%
- +$645
- After-tax cash flow
- $397/yr
For passive investors: Depreciation is non-cash, so a rental often shows a tax loss while cash-flowing — sheltering income. Rental losses are passive: they offset passive income freely, and up to $25,000/yr can offset ordinary (W-2) income if you actively participate and your MAGI is under $100k (phasing out to $0 by $150k); unused losses carry forward. On sale, claimed depreciation is recaptured at up to 25%, and gains may owe capital-gains tax (a 1031 exchange can defer both). Figures are a year-1 estimate at your 24.0% rate — not tax advice; consult a CPA.
Schools (NCES district)
- District
- Clark County School District
- NCES district ID
- 3200060
- Math proficiency
- 21% ▼ -13.00%
- Reading proficiency
- 39% ▼ -8.00%
- Median HH income
- $53,611
- Composite
- 26.48/100
- National rank
- #7211
- State rank
- #11 of 17 in NV
Livability — Winchester
- Score
- 79/100
- State rank
- #3
- US rank
- #2272
Category grades
Schools grade is shown separately in the Schools card above.
Census & demographics
- Census place
- Winchester, NV
- County
- Clark County · 2,306,105 people
- City population
- 39,883
- Metro
- Las Vegas-Henderson-Paradise, NV
- Population (ZIP)
- 36,825
- Household income
- $49,843
- Rent vs Own
- Severe rent burden
- 3577.0
Population outlook (Clark County) Hauer SSP2
- Today (2025)
- 2,504,101 people
- By 2030
- 2,693,770 · +7.6%
- By 2040
- 3,061,208 · +22.2%
- By 2050
- 3,400,072 · +35.8%
- By 2075
- 4,139,522 · +65.3%
- By 2100
- 4,596,916 · +83.6%
Race, ethnicity, and origin ACS 2023
- Neighborhood character
- Diverse neighborhood (Simpson 0.69)
- Race & ethnicity
- Hispanic / Latino 48% White 24% Two or more races 21% Black 11% Asian 9% Native American 3%
- Hispanic origin (detail)
- Mexican 34% Cuban 3%
- Common ancestry
- Romanian 2% Scotch-Irish 1% Lithuanian 1%
- Foreign-born
- 31% · Canada, China, Vietnam
- Languages at home
- 53% English-only · Spanish 36% Tagalog/Filipino 3% Chinese 2%
Political lean MEDSL · Clark
- 2024 margin
- Toss-up / Even · D 50.4% · R 47.8% · Other 1.7%
- 2008→2024 swing
- -16.5pp toward R · 2008: 19.1pp · 2024: 2.6pp
- All cycles
- 2024: D+2.6 2020: D+9.3 2016: D+10.7 2012: D+14.5 2008: D+19.1
Not yet ingested
- Civics
- —
Market trends
- HPI YoY
- ▼ -244.81%
- Current HPI
- 260.2725
- Rent YoY
- ▼ -2.10%
- Metro
- Las Vegas-Henderson-Paradise, NV
- State GDP YoY
- ▲ 3.08%
- F500 in state
- 6
Industry mix (Fortune 500 HQ in NV)
| Industry | F500 HQs | Revenue |
|---|---|---|
| Hotels / Casinos | 3 | $36B |
|
||
Price history
+228.9% since first listed8 events — show timeline
- 2026-06-16 Sold (MLS) $160,000 GLVAR
- 2026-05-08 Pending — GLVAR
- 2026-04-27 Listed $149,990 GLVAR
- 2013-06-19 Sold (MLS) $60,000 GLVAR
- 2013-06-11 Sold (Public Records) $60,000 Public Records
- 2013-05-16 Contingent — GLVAR
- 2013-02-25 Listed $65,000 GLVAR
- 1981-10-08 Sold (Public Records) $48,650 Public Records
Property tax history
+0.1%/yrLatest (2025): $654 · +7.5% YoY. Source: county tax records.
Cash-flow waterfall
monthlySold comps — $/sqft
last 12 mo · ≤1 miLoading sold comps…