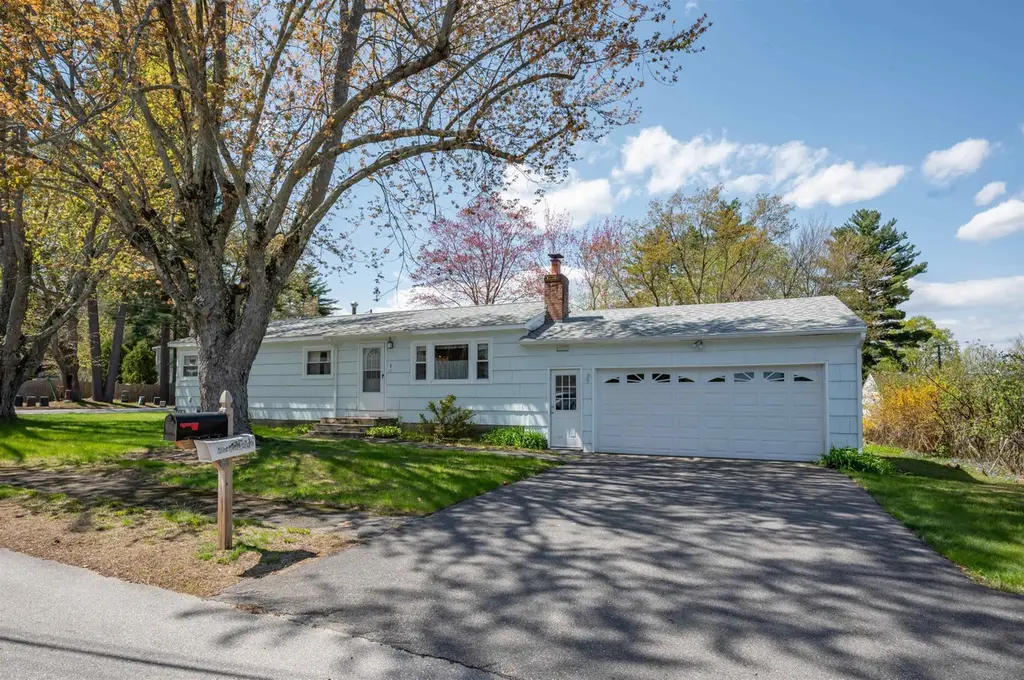
3 Derby Cir · Nashua, NH
Flood risk 1/10 · Minimal
- FEMA flood zone
- X (unshaded)
- Chance of flooding over 30 yrs
- 0.0%
- Est. flood insurance / yr
- $507 – $1,088
Fire risk 1/10 · Minimal
- Est. fire insurance / yr
- $507 – $941
Heat risk 4/10 · Minor
- Hot days now (above 97°F)
- 7 days/yr
- Hot days in 30 yrs
- 15 days/yr
Wind risk 5/10 · Moderate
- Chance of severe wind over 30 yrs
- 26.0%
Air-quality risk 2/10 · Minimal
- Unhealthy air days now
- 0 days/yr
- Unhealthy air days in 30 yrs
- 2 days/yr
Risk factors via First Street. Map © Google.
Why this score? — see what drove the F grade
The composite is a weighted blend of 9 inputs, each scored 0–100. Each bar is that input's sub-score; the figure is the points it added to the 100-point composite (weight × sub-score).
- ARV discount +15.0/15.0
- Livability +4.2/5.0
- Cash flow +4.1/30.0
- Rent growth +3.1/5.0
- Schools +3.1/10.0
- Condition / age +2.5/5.0
- 1% rule +0.7/10.0
- DSCR +0.0/10.0
- Appreciation +0.0/10.0
$419,000
🖨 Deal sheet 📄 Offer letter ✓ Due diligence
Listing remarks
Great starter home in a well established neighborhood. This three bedroom one bath ranch sits on a corner lot and has so much potential! Hardwood floors adorn the bedrooms, living room and hallway. The roof is only 4 years old. Attached two car garage and great porch off the back is perfect for outdoor dining or just relaxing. Partially finished basement is a fun 'throwback' and offers more space for gatherings. Sellers have never lived at the property and it is being sold "as-is". Easy to show and quick closing possible.
Key facts
- 0.27 acre lot
- 2 garage spots
- Built 1960
Property features AI
Exterior
- Parking: 2-car garage
- Utilities: Public water; Public sewer; 100 Amp service with circuit breakers; Cable available; Internet availability unknown
- Home design: Ranch-style home; Existing construction
- Construction: Built in 1960; Wood frame construction; Asphalt shingle roof
- Exterior features: Corner lot; Paved driveway; White exterior
Interior
- Kitchen: Kitchen/Dining area on the main level (approx. 9.4x19.1); Electric cooktop; Wall oven; Refrigerator
- Bedrooms: Three bedrooms on the main level (sizes approx. 9.6x10.4; 9.2x11.6; 11.7x13.8)
- Flooring: Hardwood flooring; Vinyl flooring
- Bathrooms: One full bathroom on the main level (approx. 6.1x6.9)
- Heating & cooling: Hot water heating
- Interior features: Partially finished basement with an interior entrance; 6 total rooms; Recreation room in the basement
- Laundry & utility: Washer and dryer included
Neighborhood map
What this means for you Summary
Snapshot
- This is a 3-bed/1.0-bath single-family listed at $419k.
Deal economics
- At list price, monthly cash flow is $-1k ($-14k/yr) — negative.
- To cash-flow at today's rent, offer at most $214k (48.9% below list).
- To meet the 1% rule (rent ≥ 1% of price), the offer needs to be $237k (43.4% below list).
- Recommended offer: $214k (48.9% below list) — sets the bar for cash-flow.
Location & tenants
- Location reads 83/100 on livability (#11 in NH, #983 nationally) — a professional / high-income tenant draw. Strengths: commute A+, housing A+, health & safety A+; Watch: amenities D+.
- Nashua School District (urban): math 27% / reading 40% proficiency, ranked #77 of 98 in NH (top 79%) — families likely to look elsewhere, expect single-tenant / working-renter base with shorter leases.
- Market conditions: Rents rising (+2.5%/yr); 101 active listings in the ZIP; 3 comparable units currently listed for rent nearby; rentals leasing fast (median 14d on market — plan ~1-2 weeks tenant-placement turnaround); solid renter incomes; 981 units permitted in Hillsborough County in 2024 (381 in 5+ unit buildings).
Forward outlook
- Local home prices are declining (-3.0%/yr); year-one equity from $3k of loan paydown is wiped out by about $13k of value loss. Plan a longer hold.
- Hillsborough County population projected to shrink 8% by 2050 — rents likely to lag national; underwrite the cash flow, not the appreciation.
Negotiation context
- Only 1 days on market — expect competitive offers; lowballing is unlikely to land.
Risks & watch-outs
- Climate carrying-cost: moderate wind risk, 26% chance of damaging wind over 30y — expect insurance premiums to compound above CPI over the hold.
Questions for the listing agent
- What do current leases actually rent for vs. the listed asking? Can we see a recent rent roll and the last 12 months of T-12 income?
- Built in 1960 — when were the roof, HVAC, electrical panel, plumbing, and water heater last replaced?
- Is there a deadline driving the sale (1031 exchange, divorce, estate, relocation)? That informs how much negotiation room exists.
- Schools are B-rated — typically a magnet for longer-tenancy family renters. What's the average tenant stay here, and is there a school-zone premium baked into asking?
- The area grade is low — what's the realistic commute time and amenity access for the typical tenant pool here? Any planned neighborhood developments (good or bad) we should know about?
- What's the average days-on-market for RENTAL listings here right now (not sales)? A rising rental-DOM trend means longer vacancies and softer asking-rent achievability than the comps imply.
- What's the recent tenant-quality profile in this submarket — average credit score on applications, eviction rate, late-payment / NSF rate, and stable-employment percentage? A property-management company in the area should have these aggregated.
- How much new for-sale + rental construction is in the pipeline within 1–3 miles? Heavy new supply typically softens prices + rents 12–24 months out; constrained supply supports both.
Investment metrics
- 1% rule
- 0.57% ✗
- Cap rate
- 2.97%
- Cash-on-cash
- -11.86%
- DSCR
- 0.47
- GRM
- 14.7
CMA / ARV
- ARV (median comp)
- $533,065
- List price
- $419,000
- Delta
- -21.40%
- Verdict
- UNDERPRICED
- Comps
- 20 within 1.0 mi
Show comp detail 3 sales within ~0.75 mi
| Address | Dist | Beds/Ba | Sqft | Sold | Price | $/sf | Match |
|---|---|---|---|---|---|---|---|
| 46 Northeastern Blvd | 0.31mi | 3/1.0 | 960 (-1%) | 14mo | $468,000 | $488 | 73 |
| 28 Timberline Dr | 0.63mi | 3/1.0 | 936 (-3%) | 8mo | $420,000 | $449 | 58 |
| 35 Victor Ave | 0.57mi | 3/1.0 | 1,008 (+4%) | 16mo | $450,000 | $446 | 53 |
Match score weights: distance 35% · size 25% · config 20% · recency 20%. Top-matched comps best support the ARV.
Projected returns pro-forma
-3.0% appreciation · 2.53% rent growth · sell at horizon
- IRR
- -38.6%
- Equity multiple
- -0.22×
- Total profit
- $-142,729
- Equity at exit
- $62,474
- IRR
- -62.1%
- Equity multiple
- -0.90×
- Total profit
- $-223,412
- Equity at exit
- $36,227
Cash invested: $117,320 (down + closing). Projections, not guarantees.
Landlord ↔ Tenant lean methodology
- Overall (STATE)
- 56 Moderately Landlord-Leaning
- State New Hampshire
- 56 Moderately Landlord-Leaning · D+1
- County
- — inherits STATE
- City
- — inherits STATE
ZIP-level market 03062
- Rents YoY
- 2.5%
- Active inventory
- 101
- Price-to-rent
- 14.7×
Monthly cashflow live
- Estimated rent
- $2,371 medium interval (Pro) →
- Mortgage (P&I)
- −$2,197
- Tax from tax record
- −$661 /mo · $7,930/yr
- Insurance
- −$175
- HOA
- −$0
- Vacancy / Maint / Mgmt
- −$498
- Net cashflow
- $-1,159
Break-even live
UW: 25.0% down · 7.5% · 30yr · 1.5% tax · 5.0% vac · 8.0% maint · 8.0% mgmt
Financing live
Cash to close
- Down payment
- $104,750
- Closing costs
- $12,570
- Reserves months
- —
- Total cash needed
- —
Loan-product check · same deal, 3 products live
Conventional
25% down · 7.5% · 30yr
- Down + closing
- —
- Monthly P&I
- —
- Monthly cashflow
- —
- DSCR
- —
- Eligible?
- —
Personal DTI + credit; lowest rate.
DSCR
20% down · 8.5% · 30yr
- Down + closing
- —
- Monthly P&I
- —
- Monthly cashflow
- —
- DSCR
- —
- Eligible?
- —
No personal income docs; deal must DSCR.
Hard money
10% down · 12.0% · 12mo
- Down + closing
- —
- Monthly P&I
- —
- Monthly cashflow
- —
- DSCR
- —
- Eligible?
- —
Short-term bridge; refi at stabilization.
Rent comps 3 comps
| Address | Beds | Baths | Sqft | Rent | $/sqft | DOM | Units | Dist |
|---|---|---|---|---|---|---|---|---|
| 53 Congress St Nashua, NH | 2.0 | 1.0 | 743 | $2,430 | $3.27 | 12d | 1 | 0.99mi |
| 16 Linwood St Apt A Nashua, NH | 2.0 | 1.0 | 588 | $1,795 | $3.05 | 21d | 1 | 1.28mi |
| 5 Avery LN Unit 201 Nashua, NH | 2.0 | 1.0 | 838 | $1,993 | $2.38 | 13d | 1 | 1.48mi |
Listing history 2 events
-
2026-05-09status Pending 537-char remark
-
2026-05-07$419,000 Active 537-char remark
ⓘ Source: listings_history table (triggers on properties + properties_extension) + one-shot
backfill from property_details.listing_events for pre-trigger history.
Tax reassessment forecast NH · Partial reset (capped growth)
- Current annual tax
- $7,930 · $661/mo
- Projected year-2 tax
- $8,532 · $711/mo
- Expected delta
- +$602/yr (+$50/mo · 7.6%)
ⓘ Screening estimate from a state-policy table — verify with the county assessor before closing.
Climate risk First Street
- Flood 1/10 Low FEMA zone X (unshaded) · 0% chance over 30 yrs
- Wildfire 1/10 Low
- Heat 4/10 Moderate 7 d/yr ≥97°F today · 15 d/yr by 30 yrs out
- Wind 5/10 Major 26% chance of damaging wind over 30 yrs
- Air quality 2/10 Low 0 unhealthy d/yr today · 2 by 30 yrs out
Nearby sold comps map
Loading sold comps map…
Walkable amenities ~0.75 mi
Loading nearby amenities…
Taxation est. · year 1
- Rental income
- $28,457
- − Mortgage interest
- −$23,471
- − Property taxes
- −$7,930
- − Insurance
- −$2,095
- − Repairs & maintenance
- −$2,277
- − Management
- −$2,277
- − Depreciation
- −$12,189
- Taxable loss
- −$21,781
- Est. tax savings @ 24.0%
- +$5,227
- After-tax cash flow
- $-8,684/yr
For passive investors: Depreciation is non-cash, so a rental often shows a tax loss while cash-flowing — sheltering income. Rental losses are passive: they offset passive income freely, and up to $25,000/yr can offset ordinary (W-2) income if you actively participate and your MAGI is under $100k (phasing out to $0 by $150k); unused losses carry forward. On sale, claimed depreciation is recaptured at up to 25%, and gains may owe capital-gains tax (a 1031 exchange can defer both). Figures are a year-1 estimate at your 24.0% rate — not tax advice; consult a CPA.
Schools (NCES district)
- District
- Nashua School District
- NCES district ID
- 3304980
- Math proficiency
- 27% ▼ -12.00%
- Reading proficiency
- 40% ▼ -6.00%
- Median HH income
- $66,393
- Composite
- 30.62/100
- National rank
- #6189
- State rank
- #77 of 98 in NH
Livability — Nashua
- Score
- 83/100
- State rank
- #11
- US rank
- #983
Category grades
Schools grade is shown separately in the Schools card above.
Census & demographics
- Census place
- Nashua, NH
- County
- Hillsborough County · 309,362 people
- City population
- 91,294
- Metro
- Manchester-Nashua, NH
- Population (ZIP)
- 29,441
- Household income
- $107,540
- Rent vs Own
- Severe rent burden
- 658.0
Population outlook (Hillsborough County) Hauer SSP2
- Today (2025)
- 412,771 people
- By 2030
- 410,974 · -0.4%
- By 2040
- 399,959 · -3.1%
- By 2050
- 381,542 · -7.6%
- By 2075
- 339,855 · -17.7%
- By 2100
- 289,270 · -29.9%
Race, ethnicity, and origin ACS 2023
- Neighborhood character
- Predominantly White (74%)
- Race & ethnicity
- White 74% Asian 15% Two or more races 5% Hispanic / Latino 5% Black 2%
- Hispanic origin (detail)
- Puerto Rican 2% Dominican 2%
- Common ancestry
- Lithuanian 9% Slovak 4% Romanian 3%
- Foreign-born
- 19% · Canada, China, Vietnam
- Languages at home
- 79% English-only · Other Asian/Pacific 6% Other Indo-European 5% Spanish 3%
Political lean MEDSL · Hillsborough
- 2024 margin
- Toss-up / Even · D 50.9% · R 48.0% · Other 1.0%
- 2008→2024 swing
- -0.9pp no change · 2008: 3.8pp · 2024: 2.9pp
- All cycles
- 2024: D+2.9 2020: D+7.7 2016: R+0.2 2012: D+1.7 2008: D+3.8
Not yet ingested
- Civics
- —
Market trends
- HPI YoY
- ▼ -432.67%
- Current HPI
- 309.5007
- Rent YoY
- ▲ 2.53%
- Metro
- Manchester-Nashua, NH
- State GDP YoY
- —
- F500 in state
- 0
Price history
+6.4% since first listed3 events — show timeline
- 2026-06-05 Sold (MLS) $446,000 PrimeMLS
- 2026-05-09 Pending — PrimeMLS
- 2026-05-07 Listed $419,000 PrimeMLS
Property tax history
+4.7%/yrLatest (2025): $7,930 · +5.8% YoY. Source: county tax records.
Cash-flow waterfall
monthlySold comps — $/sqft
last 12 mo · ≤1 miLoading sold comps…