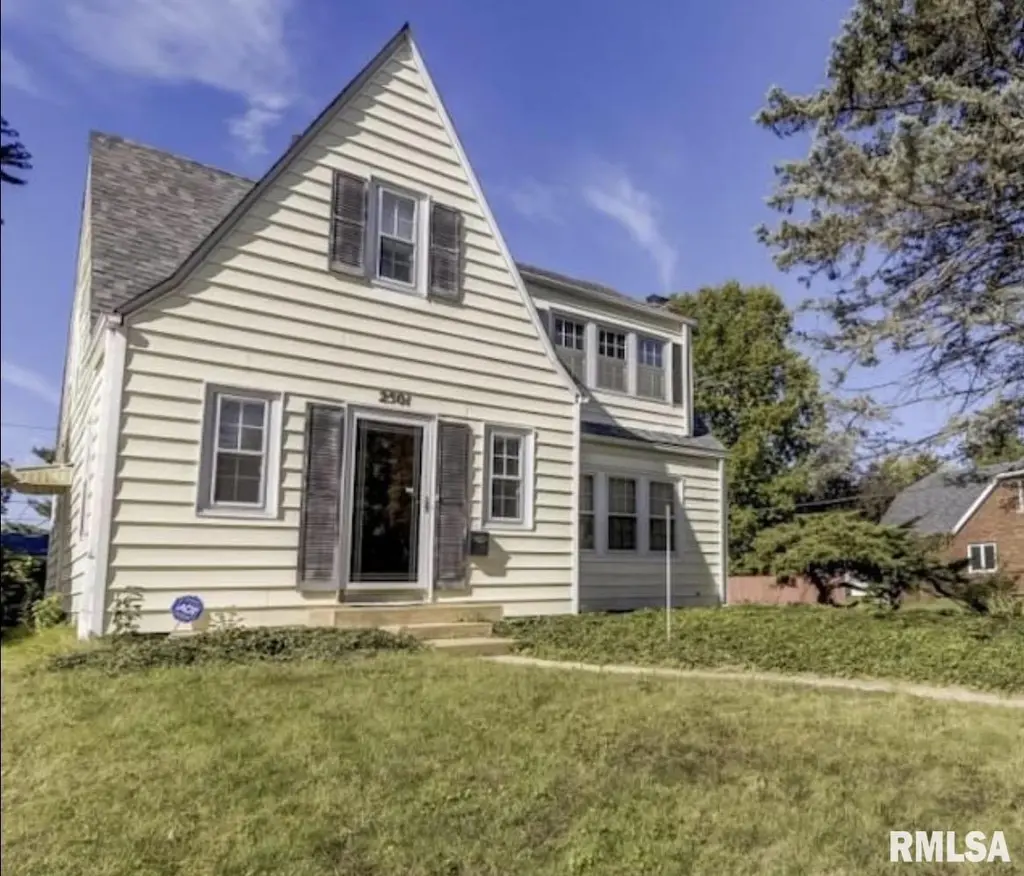
2501 S 7th St · Springfield, IL
Flood risk 1/10 · Minimal
- FEMA flood zone
- X (unshaded)
- Chance of flooding over 30 yrs
- 0.0%
- Est. flood insurance / yr
- $473 – $860
Fire risk 1/10 · Minimal
- Est. fire insurance / yr
- $804 – $1,492
Heat risk 4/10 · Minor
- Hot days now (above 105°F)
- 7 days/yr
- Hot days in 30 yrs
- 20 days/yr
Wind risk 2/10 · Minimal
- Chance of severe wind over 30 yrs
- 1.0%
Air-quality risk 2/10 · Minimal
- Unhealthy air days now
- 1 days/yr
- Unhealthy air days in 30 yrs
- 1 days/yr
Risk factors via First Street. Map © Google.
Why this score? — see what drove the C- grade
The composite is a weighted blend of 9 inputs, each scored 0–100. Each bar is that input's sub-score; the figure is the points it added to the 100-point composite (weight × sub-score).
- Cash flow +19.5/30.0
- DSCR +6.2/10.0
- ARV discount +6.1/15.0
- 1% rule +5.4/10.0
- Rent growth +5.0/5.0
- Livability +4.0/5.0
- Condition / age +2.5/5.0
- Schools +1.7/10.0
- Appreciation +0.0/10.0
$129,900
🖨 Deal sheet 📄 Offer letter ✓ Due diligence
Listing remarks MLS
WOW! This 2 story charmer lives large. You will love an expansive living area with natural light and newer carpet accented by a warm foyer entry. A classic Sears Honor Bilt home offers picturesque curb appeal & a dynamic floor plan. You'll love the large kitchen w/an abundance of cabinetry, large formal dining & the brick fireplace in the living room. This gorgeous home has beautiful wood work throughout that maintains it's timeless character, hardwood in upstairs bedrooms & just enough updating to keep it practical. Outside enjoy a large backyard and detached garage as well! Must See!
Key facts
- 5,400 sq ft lot
- 2 garage spots
- Built 1930
Neighborhood map
What this means for you Summary
Snapshot
- This is a 3-bed/1.5-bath single-family listed at $130k.
Deal economics
- At list price, monthly cash flow is $147 ($2k/yr) — positive.
- The deal already cash-flows at list — no discount required.
- Meets the 1% rule at list price ($1k rent vs $130k).
- Cap rate 7.6% vs local median 4.9% in Springfield — top-decile yield for the area; either an underpriced asset or a hidden risk that comps aren't pricing in. Stress-test before assuming the spread holds.
Location & tenants
- Location reads 79/100 on livability (#122 in IL, #2,138 nationally) — a middle-class / working-renter tenant base. Strengths: amenities A+, commute A+, cost of living A+; Watch: schools D+, crime F.
- Springfield SD 186 (urban): math 17% / reading 22% proficiency, ranked #438 of 620 in IL (top 71%) — low school quality limits family demand, transient renter base, plan for 1-2y turnover; 64% free/reduced lunch — lower-income household profile, screen leases tightly.
- Market conditions: Rents rising fast (+12.2%/yr); 107 active listings in the ZIP; 12 comparable units currently listed for rent nearby; rentals lingering (median 44d on market — plan ~5-8 weeks vacancy on turnover, expect pricing pressure); 67% of comp listings sitting > 30 days — soft ceiling on asking rent; 225 units permitted in Sangamon County in 2024 (48 in 5+ unit buildings).
- This rent runs 36% of the median local income ($45k/yr) — at the standard rent-burdened threshold; future hikes will face affordability resistance.
Forward outlook
- Local home prices are declining (-3.0%/yr); year-one equity from $898 of loan paydown is wiped out by about $4k of value loss. Plan a longer hold.
- Sangamon County population projected to shrink 9% by 2050 — rents likely to lag national; underwrite the cash flow, not the appreciation.
- At projected returns (-3.0% appreciation + 8.0% rent growth), your $36k cash investment doubles in ~9 years — after that, you're playing with house money.
Negotiation context
- Only 2 days on market — expect competitive offers; lowballing is unlikely to land.
- 2 sale attempts since 8y ago with the ask held roughly flat each time — persistent listings suggest the price (not the market) is what's stuck; bring a comps-based counter.
- Current owner paid $82k; list at $130k implies a 57% gain — meaningful room to come down on a strong offer.
Risks & watch-outs
- Watch-outs: built in 1930 — expect roof / HVAC / electrical / plumbing capex.
Questions for the listing agent
- Built in 1930 — when were the roof, HVAC, electrical panel, plumbing, and water heater last replaced?
- Is there a deadline driving the sale (1031 exchange, divorce, estate, relocation)? That informs how much negotiation room exists.
- Schools are D-rated, which usually means shorter tenancies and higher turnover. Who's the typical renter profile here, and what's been the actual vacancy rate?
- Crime grade is F in this area — have there been break-ins, vandalism, or insurance claims at this property in the last 3 years? What carrier currently insures it and at what premium?
- What's the average days-on-market for RENTAL listings here right now (not sales)? A rising rental-DOM trend means longer vacancies and softer asking-rent achievability than the comps imply.
- What's the recent tenant-quality profile in this submarket — average credit score on applications, eviction rate, late-payment / NSF rate, and stable-employment percentage? A property-management company in the area should have these aggregated.
- How much new for-sale + rental construction is in the pipeline within 1–3 miles? Heavy new supply typically softens prices + rents 12–24 months out; constrained supply supports both.
Investment metrics
- 1% rule
- 1.04% ✓
- Cap rate
- 7.65%
- Cash-on-cash
- 4.84%
- DSCR
- 1.22
- GRM
- 8.0
CMA / ARV
- ARV (on-the-fly)
- $126,116
- Comps found
- 12
Show comp detail 12 sales within ~0.75 mi
| Address | Dist | Beds/Ba | Sqft | Sold | Price | $/sf | Match |
|---|---|---|---|---|---|---|---|
| 2513 S 7th St | 0.02mi | 2/1.5 (-1) | 1,696 (+10%) | 1mo | $117,200 | $69 | 76 |
| 2501 S 10th St | 0.20mi | 3/2.0 | 1,644 (+7%) | 1mo | $49,000 | $30 | 76 |
| 512 Broad Pl | 0.31mi | 2/1.0 (-1) | 1,450 (-6%) | 1mo | $119,900 | $83 | 69 |
| 2501 S College St | 0.53mi | 3/2.0 | 1,473 (-4%) | 2mo | $159,900 | $109 | 65 |
| 709 Bryn Mawr Blvd | 0.13mi | 4/1.0 (+1) | 1,736 (+13%) | 3mo | $150,000 | $86 | 63 |
| 1933 S 1st St | 0.70mi | 3/1.5 | 1,599 (+4%) | 3mo | $90,000 | $56 | 58 |
| 29 Belle Pl | 0.39mi | 3/2.0 | 1,392 (-10%) | 7mo | $130,000 | $93 | 58 |
| 2008 S 5th St | 0.55mi | 2/1.0 (-1) | 1,480 (-4%) | 7mo | $107,000 | $72 | 55 |
| 2832 S 3rd St | 0.55mi | 2/1.0 (-1) | 1,404 (-9%) | 6mo | $115,000 | $82 | 48 |
| 2945 S 3rd St | 0.69mi | 2/1.5 (-1) | 1,374 (-11%) | 4mo | $145,000 | $106 | 42 |
| 1117 E Ash St | 0.71mi | 3/1.0 | 1,348 (-12%) | 6mo | $37,000 | $27 | 40 |
| 2937 S 3rd St | 0.68mi | 2/1.0 (-1) | 1,342 (-13%) | 6mo | $94,000 | $70 | 35 |
Match score weights: distance 35% · size 25% · config 20% · recency 20%. Top-matched comps best support the ARV.
Projected returns pro-forma
-3.0% appreciation · 8.0% rent growth · sell at horizon
- IRR
- -3.1%
- Equity multiple
- 0.88×
- Total profit
- $-4,505
- Equity at exit
- $19,369
- IRR
- 11.6%
- Equity multiple
- 2.12×
- Total profit
- $40,892
- Equity at exit
- $11,231
Cash invested: $36,372 (down + closing). Projections, not guarantees.
Landlord ↔ Tenant lean methodology
- Overall (STATE)
- 43 Moderately Tenant-Leaning
- State Illinois
- 43 Moderately Tenant-Leaning · D+7
- County
- — inherits STATE
- City
- — inherits STATE
ZIP-level market 62703
- Home prices YoY
- -28.9%
- Rents YoY
- 12.2%
- Active inventory
- 107
- Price-to-rent
- 8.0×
Monthly cashflow live
- Estimated rent
- $1,357 high interval (Pro) →
- Mortgage (P&I)
- −$681
- Tax from tax record
- −$190 /mo · $2,283/yr
- Insurance
- −$54
- HOA
- −$0
- Vacancy / Maint / Mgmt
- −$285
- Net cashflow
- $147
Break-even live
UW: 25.0% down · 7.5% · 30yr · 1.5% tax · 5.0% vac · 8.0% maint · 8.0% mgmt
Financing live
Cash to close
- Down payment
- $32,475
- Closing costs
- $3,897
- Reserves months
- —
- Total cash needed
- —
Loan-product check · same deal, 3 products live
Conventional
25% down · 7.5% · 30yr
- Down + closing
- —
- Monthly P&I
- —
- Monthly cashflow
- —
- DSCR
- —
- Eligible?
- —
Personal DTI + credit; lowest rate.
DSCR
20% down · 8.5% · 30yr
- Down + closing
- —
- Monthly P&I
- —
- Monthly cashflow
- —
- DSCR
- —
- Eligible?
- —
No personal income docs; deal must DSCR.
Hard money
10% down · 12.0% · 12mo
- Down + closing
- —
- Monthly P&I
- —
- Monthly cashflow
- —
- DSCR
- —
- Eligible?
- —
Short-term bridge; refi at stabilization.
Rent comps 12 comps
| Address | Beds | Baths | Sqft | Rent | $/sqft | DOM | Units | Dist |
|---|---|---|---|---|---|---|---|---|
| 2328 S 10th St Springfield, IL | 3.0 | 1.0 | 1100 | $1,200 | $1.09 | 44d | 1 | 0.32mi |
| 2257 S 10th St Springfield, IL | 2.0 | 1.0 | 1100 | $1,150 | $1.05 | 44d | 1 | 0.36mi |
| 1933 S 2nd St Springfield, IL | 4.0 | 2.0 | 1433 | $1,400 | $0.98 | 44d | 1 | 0.64mi |
| 1213 E Ash St Springfield, IL | 3.0 | 2.0 | 1861 | $2,030 | $1.09 | 21d | 1 | 0.76mi |
| 1726 S 6th St Springfield, IL | 3.0 | 1.5 | 1408 | $1,500 | $1.07 | 44d | 1 | 0.85mi |
| 1600 S 6th St Unit 1 Springfield, IL | 3.0 | 2.0 | 1100 | $1,250 | $1.14 | 21d | 1 | 0.95mi |
| 525 E Pine St Springfield, IL | 2.0 | 2.0 | 1250 | $1,200 | $0.96 | 44d | 1 | 1.05mi |
| 525 E Pine St Unit 4 Springfield, IL | 2.0 | 2.0 | 1250 | $1,200 | $0.96 | 21d | 1 | 1.05mi |
| 1214 S 7th St Unit C Springfield, IL | 3.0 | 1.0 | 1200 | $1,350 | $1.12 | 44d | 1 | 1.23mi |
| 1104 S 11th St Unit A Springfield, IL | 3.0 | 1.0 | 1200 | $1,000 | $0.83 | 44d | 1 | 1.37mi |
| 229 W Allen St Springfield, IL | 3.0 | 1.5 | 1050 | $1,305 | $1.24 | 21d | 1 | 1.38mi |
| 1929 E Spruce St Springfield, IL | 3.0 | 1.0 | 1500 | $1,300 | $0.87 | 44d | 1 | 1.39mi |
Listing history 8 events
-
2026-06-05statusdays on market $129,900 Pending 2 DOM
-
2026-06-03remarks 518-char remark
-
2026-06-03statusdays on market $129,900 Active 1 DOM
-
2026-05-14historical
-
2026-05-13$129,000
-
2018-11-29soldstatus $82,500
-
2018-11-28soldstatus $82,500 604-char remark
Show marketing remark (604 chars)
WOW! This 2 story charmer lives large. You will love an expansive living area with natural light and newer carpet accented by a warm foyer entry. A classic Sears Honor Bilt home offers picturesque curb appeal & a dynamic floor plan. You'll love the large kitchen w/an abundance of cabinetry, large formal dining & the brick fireplace in the living room. This gorgeous home has beautiful wood work throughout that maintains it's timeless character, hardwood in upstairs bedrooms & just enough updating to keep it practical. Outside enjoy a large backyard and detached garage as well! Must See!
-
2018-10-23$85,900 604-char remark
Show marketing remark (604 chars)
WOW! This 2 story charmer lives large. You will love an expansive living area with natural light and newer carpet accented by a warm foyer entry. A classic Sears Honor Bilt home offers picturesque curb appeal & a dynamic floor plan. You'll love the large kitchen w/an abundance of cabinetry, large formal dining & the brick fireplace in the living room. This gorgeous home has beautiful wood work throughout that maintains it's timeless character, hardwood in upstairs bedrooms & just enough updating to keep it practical. Outside enjoy a large backyard and detached garage as well! Must See!
ⓘ Source: listings_history table (triggers on properties + properties_extension) + one-shot
backfill from property_details.listing_events for pre-trigger history.
Tax reassessment forecast IL · Partial reset (capped growth)
- Current annual tax
- $2,283 · $190/mo
- Projected year-2 tax
- $2,616 · $218/mo
- Expected delta
- +$333/yr (+$28/mo · 14.6%)
ⓘ Screening estimate from a state-policy table — verify with the county assessor before closing.
Climate risk First Street
- Flood 1/10 Low FEMA zone X (unshaded) · 0% chance over 30 yrs
- Wildfire 1/10 Low
- Heat 4/10 Moderate 7 d/yr ≥105°F today · 20 d/yr by 30 yrs out
- Wind 2/10 Low 100% chance of damaging wind over 30 yrs
- Air quality 2/10 Low 1 unhealthy d/yr today · 1 by 30 yrs out
Nearby sold comps map
Loading sold comps map…
Walkable amenities ~0.75 mi
Loading nearby amenities…
Taxation est. · year 1
- Rental income
- $16,285
- − Mortgage interest
- −$7,276
- − Property taxes
- −$2,283
- − Insurance
- −$650
- − Repairs & maintenance
- −$1,303
- − Management
- −$1,303
- − Depreciation
- −$3,779
- Taxable loss
- −$308
- Est. tax savings @ 24.0%
- +$74
- After-tax cash flow
- $1,833/yr
For passive investors: Depreciation is non-cash, so a rental often shows a tax loss while cash-flowing — sheltering income. Rental losses are passive: they offset passive income freely, and up to $25,000/yr can offset ordinary (W-2) income if you actively participate and your MAGI is under $100k (phasing out to $0 by $150k); unused losses carry forward. On sale, claimed depreciation is recaptured at up to 25%, and gains may owe capital-gains tax (a 1031 exchange can defer both). Figures are a year-1 estimate at your 24.0% rate — not tax advice; consult a CPA.
Schools (NCES district)
- District
- Springfield SD 186
- NCES district ID
- 1737080
- Math proficiency
- 17% ▼ -7.00%
- Reading proficiency
- 22% ▼ -5.00%
- Median HH income
- $43,744
- Composite
- 16.89/100
- National rank
- #9142
- State rank
- #438 of 620 in IL
Livability — Springfield
- Score
- 79/100
- State rank
- #122
- US rank
- #2138
Category grades
Schools grade is shown separately in the Schools card above.
Census & demographics
- Census place
- Springfield, IL
- County
- Sangamon County · 115,414 people
- City population
- 59,955
- Metro
- Springfield, IL
- Population (ZIP)
- 28,922
- Household income
- $45,009
- Rent vs Own
- Severe rent burden
- 1626.0
Population outlook (Sangamon County) Hauer SSP2
- Today (2025)
- 198,317 people
- By 2030
- 196,127 · -1.1%
- By 2040
- 188,664 · -4.9%
- By 2050
- 179,624 · -9.4%
- By 2075
- 155,027 · -21.8%
- By 2100
- 122,588 · -38.2%
Race, ethnicity, and origin ACS 2023
- Neighborhood character
- Diverse neighborhood (Simpson 0.59)
- Race & ethnicity
- White 53% Black 35% Two or more races 7% Hispanic / Latino 5%
- Common ancestry
- Lithuanian 2% Romanian 2% Italian 1%
- Foreign-born
- 3% · Canada
- Languages at home
- 95% English-only · Spanish 3% Arabic 1%
Political lean MEDSL · Sangamon
- 2024 margin
- Toss-up / Even · D 46.6% · R 51.6% · Other 1.8%
- 2008→2024 swing
- -9.3pp toward R · 2008: 4.4pp · 2024: -5.0pp
- All cycles
- 2024: R+5.0 2020: R+4.4 2016: R+9.4 2012: R+8.7 2008: D+4.4
Not yet ingested
- Civics
- —
Market trends
- HPI YoY
- ▼ -59.69%
- Current HPI
- 147.0877
- Rent YoY
- ▲ 12.19%
- Metro
- Springfield, IL
- State GDP YoY
- ▲ 1.59%
- F500 in state
- 60
Industry mix (Fortune 500 HQ in IL)
| Industry | F500 HQs | Revenue |
|---|---|---|
| Insurance | 4 | $201B |
|
||
| Consumer Goods | 4 | $87B |
|
||
| Industrial Machinery | 3 | $64B |
|
||
| Healthcare | 2 | $55B |
|
||
| Retail / Pharmacy | 1 | $148B |
|
||
| Agriculture / Food | 1 | $86B |
|
||
Price history
+50.2% since first listed5 events — show timeline
- 2026-05-14 Listing Removed — RMLSA as Distributed by MLS Grid
- 2026-05-13 Listed $129,000 RMLSA as Distributed by MLS Grid
- 2018-11-29 Sold (Public Records) $82,500 Public Records
- 2018-11-28 Sold (MLS) $82,500 RMLSA as Distributed by MLS Grid
- 2018-10-23 Listed $85,900 RMLSA as Distributed by MLS Grid
Property tax history
+3.4%/yrLatest (2024): $2,283 · +6.2% YoY. Source: county tax records.
Cash-flow waterfall
monthlySold comps — $/sqft
last 12 mo · ≤1 miLoading sold comps…