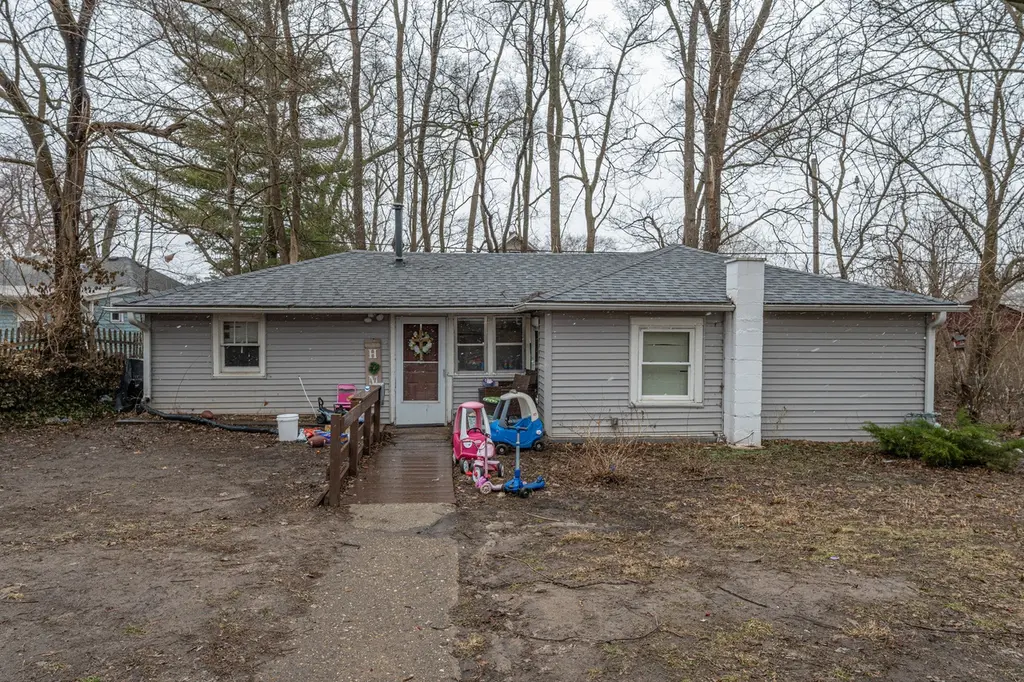
2935 Potter St · Rockford, IL
Flood risk 1/10 · Minimal
- FEMA flood zone
- X (unshaded)
- Chance of flooding over 30 yrs
- 0.0%
- Est. flood insurance / yr
- $507 – $1,088
Fire risk 1/10 · Minimal
- Est. fire insurance / yr
- $804 – $1,492
Heat risk 2/10 · Minimal
- Hot days now (above 101°F)
- 7 days/yr
- Hot days in 30 yrs
- 15 days/yr
Wind risk 2/10 · Minimal
- Chance of severe wind over 30 yrs
- —
Air-quality risk 2/10 · Minimal
- Unhealthy air days now
- 1 days/yr
- Unhealthy air days in 30 yrs
- 2 days/yr
Risk factors via First Street. Map © Google.
Why this score? — see what drove the C grade
The composite is a weighted blend of 9 inputs, each scored 0–100. Each bar is that input's sub-score; the figure is the points it added to the 100-point composite (weight × sub-score).
- Cash flow +29.0/30.0
- DSCR +10.0/10.0
- 1% rule +8.0/10.0
- Livability +3.1/5.0
- Rent growth +2.5/5.0
- Condition / age +2.5/5.0
- ARV discount +1.7/15.0
- Schools +1.2/10.0
- Appreciation +0.0/10.0
$99,900
🖨 Deal sheet (PDF) 📄 Offer letter ✓ Due diligence
Listing remarks MLS
Investment opportunity: 3-bedroom, 1-bath home, currently leased until December 2026. The property has been recently remodeled and is well maintained. A large yard adds outdoor space and strong rental appeal. Great option for investors looking for stable, long-term income.
Key facts
- Recently remodeled
- Large yard
- Well maintained
Tags
Neighborhood map
What this means for you Summary
Snapshot
- This is a 3-bed/1.0-bath single-family listed at $100k.
Deal economics
- At list price, monthly cash flow is $340 ($4k/yr) — positive.
- The deal already cash-flows at list — no discount required.
- Meets the 1% rule at list price ($1k rent vs $100k).
- Recommended offer: $91k (9.0% below list) — sets the bar for market timing.
- Cap rate 10.4% vs local median 6.1% in Rockford — top-decile yield for the area; either an underpriced asset or a hidden risk that comps aren't pricing in. Stress-test before assuming the spread holds.
Location & tenants
- Location reads 62/100 on livability (#876 in IL) — a middle-class / working-renter tenant base. Strengths: cost of living A+, housing A+, health & safety A+; Watch: schools F, crime F, amenities F.
- Rockford SD 205 (urban): math 12% / reading 16% proficiency, ranked #533 of 620 in IL (top 86%) — low school quality limits family demand, transient renter base, plan for 1-2y turnover; 73% free/reduced lunch — lower-income household profile, screen leases tightly.
- Market conditions: 84 active listings in the ZIP; 5 comparable units currently listed for rent nearby; rentals lingering (median 44d on market — plan ~5-8 weeks vacancy on turnover, expect pricing pressure); 100% of comp listings sitting > 30 days — soft ceiling on asking rent; 285 units permitted in Winnebago County in 2024 (0 in 5+ unit buildings).
Forward outlook
- Local home prices are declining (-3.0%/yr); year-one equity from $691 of loan paydown is wiped out by about $3k of value loss. Plan a longer hold.
- Winnebago County population projected at -20% by 2050 — secular population decline; favor cash flow + early exit over multi-decade hold.
- At projected returns (-3.0% appreciation + 3.0% rent growth), your $28k cash investment doubles in ~9 years — after that, you're playing with house money.
Negotiation context
- It's been on market 98 days — a 9% lower offer ($91k) is reasonable based on typical stale-listing flexibility.
- 7 sale attempts since 6y ago; this cycle's ask has dropped $8k (7%) from the opening price — seller is motivated, your offer sets the floor, not the list.
- Current owner paid $80k; 25% above their basis — modest negotiation headroom, anchor on the comps not their cost.
Risks & watch-outs
- Watch-outs: built in 1940 — expect roof / HVAC / electrical / plumbing capex.
Questions for the listing agent
- It's been on market 98 days. Have you received any prior offers? Is the seller open to a 9% concession, seller financing, or rate buy-down credit?
- Built in 1940 — when were the roof, HVAC, electrical panel, plumbing, and water heater last replaced?
- Why hasn't it sold? Are there any deal-killer items the seller is aware of (foundation, flood, title, zoning, code violations)?
- Is there a deadline driving the sale (1031 exchange, divorce, estate, relocation)? That informs how much negotiation room exists.
- Schools are F-rated, which usually means shorter tenancies and higher turnover. Who's the typical renter profile here, and what's been the actual vacancy rate?
- Crime grade is F in this area — have there been break-ins, vandalism, or insurance claims at this property in the last 3 years? What carrier currently insures it and at what premium?
- What's the average days-on-market for RENTAL listings here right now (not sales)? A rising rental-DOM trend means longer vacancies and softer asking-rent achievability than the comps imply.
- What's the recent tenant-quality profile in this submarket — average credit score on applications, eviction rate, late-payment / NSF rate, and stable-employment percentage? A property-management company in the area should have these aggregated.
- How much new for-sale + rental construction is in the pipeline within 1–3 miles? Heavy new supply typically softens prices + rents 12–24 months out; constrained supply supports both.
Investment metrics
- 1% rule
- 1.30% ✓
- Cap rate
- 10.38%
- Cash-on-cash
- 14.60%
- DSCR
- 1.65
- GRM
- 6.4
CMA / ARV
- ARV (median comp)
- $88,438
- List price
- $99,900
- Delta
- 12.96%
- Verdict
- OVERPRICED
- Comps
- 20 within 1.0 mi
Show comp detail 12 sales within ~0.75 mi
| Address | Dist | Beds/Ba | Sqft | Sold | Price | $/sf | Match |
|---|---|---|---|---|---|---|---|
| 2914 Sewell St | 0.10mi | 3/1.0 | 994 (+6%) | 1mo | $98,000 | $99 | 85 |
| 3110 Horton St | 0.23mi | 3/1.0 | 914 (-3%) | 12mo | $117,000 | $128 | 76 |
| 2834 Hanson St | 0.19mi | 3/1.0 | 1,015 (+8%) | 8mo | $90,000 | $89 | 71 |
| 2930 11th St | 0.23mi | 2/1.0 (-1) | 832 (-11%) | 1mo | $120,000 | $144 | 65 |
| 2710 Hanson St | 0.35mi | 2/1.0 (-1) | 982 (+5%) | 8mo | $85,000 | $87 | 64 |
| 2817 9th St | 0.54mi | 3/2.0 | 874 (-7%) | 1mo | $149,900 | $172 | 58 |
| 1729 Johnson Ave | 0.44mi | 2/1.0 (-1) | 887 (-5%) | 9mo | $118,000 | $133 | 58 |
| 3113 16th St | 0.30mi | 2/1.0 (-1) | 1,056 (+13%) | 9mo | $125,000 | $118 | 53 |
| 3126 8th St | 0.64mi | 3/1.0 | 1,000 (+7%) | 10mo | $95,000 | $95 | 50 |
| 2837 10th St | 0.40mi | 2/1.0 (-1) | 816 (-13%) | 5mo | $30,000 | $37 | 50 |
| 3016 7th St | 0.68mi | 3/1.0 | 836 (-11%) | 4mo | $128,000 | $153 | 47 |
| 3322 Nashold Dr | 0.57mi | 4/2.0 (+1) | 1,066 (+14%) | 4mo | $212,000 | $199 | 39 |
Match score weights: distance 35% · size 25% · config 20% · recency 20%. Top-matched comps best support the ARV.
Projected returns pro-forma
-3.0% appreciation · 3.0% rent growth · sell at horizon
- IRR
- 5.1%
- Equity multiple
- 1.20×
- Total profit
- $5,509
- Equity at exit
- $14,895
- IRR
- 14.5%
- Equity multiple
- 2.17×
- Total profit
- $32,787
- Equity at exit
- $8,638
Cash invested: $27,972 (down + closing). Projections, not guarantees.
Landlord ↔ Tenant lean methodology
- Overall (STATE)
- 43 Moderately Tenant-Leaning
- State Illinois
- 43 Moderately Tenant-Leaning · D+7
- County
- — inherits STATE
- City
- — inherits STATE
ZIP-level market 61109
- Home prices YoY
- -19.7%
- Active inventory
- 84
- Price-to-rent
- 6.4×
Monthly cashflow live
- Estimated rent
- $1,302 high interval (Pro) →
- Mortgage (P&I)
- −$524
- Tax from tax record
- −$123 /mo · $1,477/yr
- Insurance
- −$42
- HOA
- −$0
- Vacancy / Maint / Mgmt
- −$274
- Net cashflow
- $340
Break-even live
Sensitivity live
| Price | -10% $397 | -5% $369 | +0% $340 | +5% $312 | +10% $284 |
|---|---|---|---|---|---|
| Rent | -10% $237 | -5% $289 | +0% $340 | +5% $392 | +10% $443 |
| Rate | -1.0pp $391 | -0.5pp $366 | base $340 | +0.5pp $314 | +1.0pp $288 |
UW: 25.0% down · 7.5% · 30yr · 1.5% tax · 5.0% vac · 8.0% maint · 8.0% mgmt
Financing live
Cash to close
- Down payment
- $24,975
- Closing costs
- $2,997
- Reserves months
- —
- Total cash needed
- —
Loan-product check · same deal, 3 products live
Conventional
25% down · 7.5% · 30yr
- Down + closing
- —
- Monthly P&I
- —
- Monthly cashflow
- —
- DSCR
- —
- Eligible?
- —
Personal DTI + credit; lowest rate.
DSCR
20% down · 8.5% · 30yr
- Down + closing
- —
- Monthly P&I
- —
- Monthly cashflow
- —
- DSCR
- —
- Eligible?
- —
No personal income docs; deal must DSCR.
Hard money
10% down · 12.0% · 12mo
- Down + closing
- —
- Monthly P&I
- —
- Monthly cashflow
- —
- DSCR
- —
- Eligible?
- —
Short-term bridge; refi at stabilization.
Rent comps 5 comps
| Address | Beds | Baths | Sqft | Rent | $/sqft | DOM | Units | Dist |
|---|---|---|---|---|---|---|---|---|
| 1418 22nd Ave Rockford, IL | 2.0 | 1.0 | 950 | $1,200 | $1.26 | 44d | 1 | 0.88mi |
| 1420 22nd Ave Rockford, IL | 2.0 | 1.0 | 950 | $1,200 | $1.26 | 44d | 1 | 0.88mi |
| 1211 21st Pl Rockford, IL | 2.0 | 1.0 | 1040 | $1,350 | $1.30 | 44d | 1 | 1.00mi |
| 1209 21st Pl Rockford, IL | 2.0 | 1.0 | 1040 | $1,350 | $1.30 | 44d | 1 | 1.00mi |
| 914 18th Ave Rockford, IL | 2.0 | 1.0 | 1123 | $900 | $0.80 | 44d | 1 | 1.40mi |
Listing history 35 events
-
2026-06-19remarks 274-char remark
-
2026-06-19statusdays on market $99,900 Pending 98 DOM
-
2026-06-18days on market $99,900 Active 62 DOM
-
2026-06-17days on market $99,900 Active 61 DOM
-
2026-06-16days on market $99,900 Active 60 DOM
-
2026-06-15days on market $99,900 Active 59 DOM
-
2026-06-14days on market $99,900 Active 57 DOM
-
2026-06-13days on market $99,900 Active 56 DOM
-
2026-06-10days on market $99,900 Active 54 DOM
-
2026-06-09days on market $99,900 Active 53 DOM
-
2026-06-08days on market $99,900 Active 52 DOM
-
2026-06-07days on market $99,900 Active 51 DOM
-
2026-06-03days on market $99,900 Active 47 DOM
-
2026-06-02days on market $99,900 Active 46 DOM
-
2026-06-01days on market $99,900 Active 45 DOM
-
2026-05-31days on market $99,900 Active 44 DOM
-
2026-05-30days on market $99,900 Active 43 DOM
-
2026-05-01price $99,900
-
2026-04-19price $99,900 274-char remark
Show marketing remark (274 chars)
Investment opportunity: 3-bedroom, 1-bath home, currently leased until December 2026. The property has been recently remodeled and is well maintained. A large yard adds outdoor space and strong rental appeal. Great option for investors looking for stable, long-term income.
-
2026-04-17$107,500 Active
-
2026-03-12$107,500 Active 274-char remark
Show marketing remark (274 chars)
Investment opportunity: 3-bedroom, 1-bath home, currently leased until December 2026. The property has been recently remodeled and is well maintained. A large yard adds outdoor space and strong rental appeal. Great option for investors looking for stable, long-term income.
-
2025-10-26historical $1,150
-
2025-10-09price $1,150
-
2025-10-05$1,250
-
2024-12-26soldstatus $80,000
-
2024-09-09historical $1,100
-
2024-08-18$1,100
-
2021-06-22soldstatus $35,000 Closed Sale
-
2021-06-22soldstatus $35,000
-
2021-06-14status Pending
-
2021-06-01$50,000
-
2021-05-11price $50,000
-
2021-05-10status Reactivated
-
2021-02-18status Pending
-
2020-11-24$45,000 New
ⓘ Source: listings_history table (triggers on properties + properties_extension) + one-shot
backfill from property_details.listing_events for pre-trigger history.
Tax reassessment forecast IL · Partial reset (capped growth)
- Current annual tax
- $1,477 · $123/mo
- Projected year-2 tax
- $1,872 · $156/mo
- Expected delta
- +$396/yr (+$33/mo · 26.8%)
ⓘ Screening estimate from a state-policy table — verify with the county assessor before closing.
Climate risk First Street
- Flood 1/10 Low FEMA zone X (unshaded) · 0% chance over 30 yrs
- Wildfire 1/10 Low
- Heat 2/10 Low 7 d/yr ≥101°F today · 15 d/yr by 30 yrs out
- Wind 2/10 Low
- Air quality 2/10 Low 1 unhealthy d/yr today · 2 by 30 yrs out
Nearby sold comps map
Loading sold comps map…
Walkable amenities ~0.75 mi
Loading nearby amenities…
Taxation est. · year 1
- Rental income
- $15,630
- − Mortgage interest
- −$5,596
- − Property taxes
- −$1,477
- − Insurance
- −$500
- − Repairs & maintenance
- −$1,250
- − Management
- −$1,250
- − Depreciation
- −$2,906
- Taxable income
- $2,650
- Est. tax owed @ 24.0%
- −$636
- After-tax cash flow
- $3,448/yr
For passive investors: Depreciation is non-cash, so a rental often shows a tax loss while cash-flowing — sheltering income. Rental losses are passive: they offset passive income freely, and up to $25,000/yr can offset ordinary (W-2) income if you actively participate and your MAGI is under $100k (phasing out to $0 by $150k); unused losses carry forward. On sale, claimed depreciation is recaptured at up to 25%, and gains may owe capital-gains tax (a 1031 exchange can defer both). Figures are a year-1 estimate at your 24.0% rate — not tax advice; consult a CPA.
Schools (NCES district)
- District
- Rockford SD 205
- NCES district ID
- 1734510
- Math proficiency
- 12% ▼ -2.00%
- Reading proficiency
- 16% ▼ -3.00%
- Median HH income
- $42,533
- Composite
- 12.21/100
- National rank
- #9649
- State rank
- #533 of 620 in IL
Livability — Rockford
- Score
- 62/100
- State rank
- #876
- US rank
- #17035
Category grades
Schools grade is shown separately in the Schools card above.
Census & demographics
- Census place
- Rockford, IL
- County
- Winnebago County · 147,297 people
- City population
- 147,297
- Metro
- Rockford, IL
- Population (ZIP)
- 26,768
- Household income
- $62,973
- Rent vs Own
- Severe rent burden
- 941.0
Population outlook (Winnebago County) Hauer SSP2
- Today (2025)
- 271,080 people
- By 2030
- 260,684 · -3.8%
- By 2040
- 238,405 · -12.1%
- By 2050
- 216,129 · -20.3%
- By 2075
- 172,882 · -36.2%
- By 2100
- 135,336 · -50.1%
Race, ethnicity, and origin ACS 2023
- Neighborhood character
- Diverse neighborhood (Simpson 0.62)
- Race & ethnicity
- White 57% Hispanic / Latino 21% Black 13% Two or more races 11% Asian 5%
- Hispanic origin (detail)
- Mexican 17% Puerto Rican 1%
- Common ancestry
- Romanian 3% Slovak 2% Portuguese 2%
- Foreign-born
- 13% · Canada, Philippines, China
- Languages at home
- 79% English-only · Spanish 16% Other Asian/Pacific 2% Russian/Polish/Slavic 1%
Political lean MEDSL · Winnebago
- 2024 margin
- Toss-up / Even · D 49.5% · R 49.0% · Other 1.5%
- 2008→2024 swing
- -12.2pp toward R · 2008: 12.8pp · 2024: 0.6pp
- All cycles
- 2024: D+0.6 2020: D+2.5 2016: R+1.2 2012: D+5.7 2008: D+12.8
Not yet ingested
- Civics
- —
Market trends
- HPI YoY
- ▼ -72.42%
- Current HPI
- 296.0019
- Rent YoY
- —
- Metro
- Rockford, IL
- State GDP YoY
- ▲ 1.59%
- F500 in state
- 60
Industry mix (Fortune 500 HQ in IL)
| Industry | F500 HQs | Revenue |
|---|---|---|
| Insurance | 4 | $201B |
|
||
| Consumer Goods | 4 | $87B |
|
||
| Industrial Machinery | 3 | $64B |
|
||
| Healthcare | 2 | $55B |
|
||
| Retail / Pharmacy | 1 | $148B |
|
||
| Agriculture / Food | 1 | $86B |
|
||
Price history
+122.0% since first listed18 events — show timeline
- 2026-05-01 Price Changed $99,900 MRED as Distributed by MLS Grid
- 2026-04-19 Price Changed $99,900 NWIAR
- 2026-04-17 Listed $107,500 MRED as Distributed by MLS Grid
- 2026-03-12 Listed $107,500 NWIAR
- 2025-10-26 Rental Removed $1,150 RENTLY
- 2025-10-09 Price Changed $1,150 RENTLY
- 2025-10-05 Listed for Rent $1,250 RENTLY
- 2024-12-26 Sold (Public Records) $80,000 Public Records
- 2024-09-09 Rental Removed $1,100 APPFOLIO
- 2024-08-18 Listed for Rent $1,100 APPFOLIO
- 2021-06-22 Sold (MLS) $35,000 MRED as Distributed by MLS Grid
- 2021-06-22 Sold (MLS) $35,000 NWIAR
- 2021-06-14 Pending — MRED as Distributed by MLS Grid
- 2021-06-01 Listed $50,000 NWIAR
- 2021-05-11 Price Changed $50,000 MRED as Distributed by MLS Grid
- 2021-05-10 Relisted — MRED as Distributed by MLS Grid
- 2021-02-18 Pending — MRED as Distributed by MLS Grid
- 2020-11-24 Listed $45,000 MRED as Distributed by MLS Grid
Property tax history
+0.1%/yrLatest (2024): $1,477 · +3.5% YoY. Source: county tax records.
Cash-flow waterfall
monthlySold comps — $/sqft
last 12 mo · ≤1 miLoading sold comps…