 Fourplex
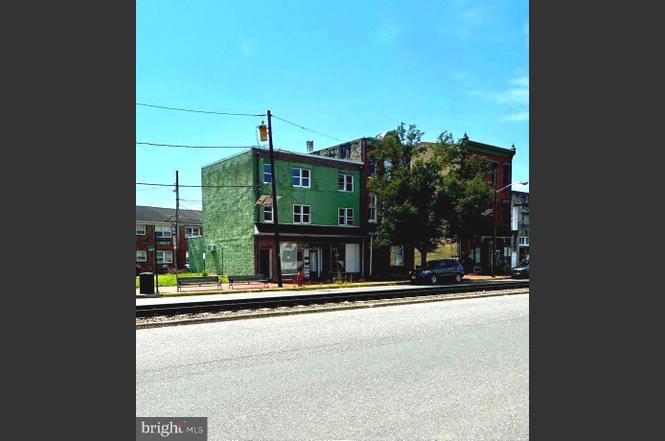
20-22 E Broad St · Burlington, NJ
Flood risk No data
- FEMA flood zone
- —
- Chance of flooding over 30 yrs
- —
- Est. flood insurance / yr
- —
Fire risk No data
- Est. fire insurance / yr
- —
Heat risk No data
- Hot days now (above threshold)
- —
- Hot days in 30 yrs
- —
Wind risk No data
- Chance of severe wind over 30 yrs
- —
Air-quality risk No data
- Unhealthy air days now
- —
- Unhealthy air days in 30 yrs
- —
Risk factors via First Street. Map © Google.
Why this score? — see what drove the B- grade
The composite is a weighted blend of 9 inputs, each scored 0–100. Each bar is that input's sub-score; the figure is the points it added to the 100-point composite (weight × sub-score).
- Cash flow +30.0/30.0
- 1% rule +10.0/10.0
- DSCR +10.0/10.0
- ARV discount +7.5/15.0
- Livability +3.9/5.0
- Rent growth +2.5/5.0
- Condition / age +2.5/5.0
- Schools +1.6/10.0
- Appreciation +0.0/10.0
$325,000
🖨 Deal sheet 📄 Offer letter ✓ Due diligence
Multi-family units
County records classify this as Multi-Family (2-4 Unit). Listing-text estimate: 4 units. confirmed
Listing remarks
Great Opportunity for a 4 unit Investment. Main floor offers 2 store fronts with their own bathroom. Upstairs offers, 2 bedroom, 1 bathroom apartment with living room, and kitchen. Property has been completely gutted for a clean slat. Located next to bus and train station, for easier transportation to where ever you need to go. Property selling completely as is. Buyer responsible for all repairs and approvals. Cash only offers.
Key facts
- 1,224 sq ft lot
- Built 1870
- Listed 152 days
Property features AI
Finance
- Financial info: 4 total units; Estimated year built; Finished area above grade approximately 3,115
Exterior
- Parking: On-street parking
- Utilities: Electric hot water; Public sewer; Public water
- Home design: Over storefront structure; 2 stories; Fee simple ownership
- Construction: Block and brick construction; Above-grade and below-grade structures
- Exterior features: Lot roughly 35 x 35; No tidal water
Interior
- Bedrooms: Two single-room units; Two two-bedroom units
- Interior features: Estimated living area
Neighborhood map
What this means for you Summary
Snapshot
- This is a 4 × 2-bed/1.0-bath units multifamily listed at $325k.
Deal economics
- At list price, monthly cash flow is $4k ($45k/yr) — positive. Per door: $946/mo.
- The deal already cash-flows at list — no discount required.
- Meets the 1% rule at list price ($8k rent vs $325k).
- Recommended offer: $286k (12.0% below list) — sets the bar for market timing.
- Cap rate 20.3% vs local median 4.6% in Burlington — top-decile yield for the area; either an underpriced asset or a hidden risk that comps aren't pricing in. Stress-test before assuming the spread holds.
Location & tenants
- Location reads 78/100 on livability (#89 in NJ, #2,359 nationally) — a middle-class / working-renter tenant base. Strengths: housing A+, health & safety A+, cost of living A-; Watch: schools C-, amenities F.
- Burlington City Public School District (suburban): math 7% / reading 29% proficiency, ranked #439 of 472 in NJ (top 93%) — low school quality limits family demand, transient renter base, plan for 1-2y turnover.
- Market conditions: 179 active listings in the ZIP; solid renter incomes; 2,161 units permitted in Burlington County in 2024 (988 in 5+ unit buildings).
- At $7,634/mo this rent would consume 93% of the median local household income ($98k/yr) (locally 1045% of renters already pay >50% of income on rent) — very limited rent-growth headroom before tenants either downsize or default.
Forward outlook
- Local home prices are declining (-3.0%/yr); year-one equity from $2k of loan paydown is wiped out by about $10k of value loss. Plan a longer hold.
- Burlington County population projected to shrink 5% by 2050 — rents likely to lag national; underwrite the cash flow, not the appreciation.
- At projected returns (-3.0% appreciation + 3.0% rent growth), your $91k cash investment doubles in ~3 years — after that, you're playing with house money.
Negotiation context
- It's been on market 153 days — a 12% lower offer ($286k) is reasonable based on typical stale-listing flexibility.
- 6 sale attempts since 4y ago with the ask held roughly flat each time — persistent listings suggest the price (not the market) is what's stuck; bring a comps-based counter.
- Current owner paid $180k; list at $325k implies a 81% gain — meaningful room to come down on a strong offer.
Risks & watch-outs
- Watch-outs: built in 1870 — expect roof / HVAC / electrical / plumbing capex.
Questions for the listing agent
- It's been on market 153 days. Have you received any prior offers? Is the seller open to a 12% concession, seller financing, or rate buy-down credit?
- Can we see the unit-by-unit rent roll, current vacancy, and any below-market leases? What's the average tenancy length?
- What capital expenditures (roof, boiler, parking lot, exteriors) have been made in the last 5 years, and what's planned in the next 2?
- Built in 1870 — when were the roof, HVAC, electrical panel, plumbing, and water heater last replaced?
- Why hasn't it sold? Are there any deal-killer items the seller is aware of (foundation, flood, title, zoning, code violations)?
- Is there a deadline driving the sale (1031 exchange, divorce, estate, relocation)? That informs how much negotiation room exists.
- What's the average days-on-market for RENTAL listings here right now (not sales)? A rising rental-DOM trend means longer vacancies and softer asking-rent achievability than the comps imply.
- What's the recent tenant-quality profile in this submarket — average credit score on applications, eviction rate, late-payment / NSF rate, and stable-employment percentage? A property-management company in the area should have these aggregated.
- How much new apartment / multifamily construction is in the pipeline within 1–3 miles? Heavy new supply (>2% of stock underway) typically softens rents 12–24 months out; light construction supports rent growth.
Investment metrics
- 1% rule
- 2.35% ✓
- Cap rate
- 20.27%
- Cash-on-cash
- 49.91%
- DSCR
- 3.22
- GRM
- 3.5
CMA / ARV
No comps found within radius.
Projected returns pro-forma
-3.0% appreciation · 3.0% rent growth · sell at horizon
- IRR
- 47.6%
- Equity multiple
- 3.07×
- Total profit
- $188,511
- Equity at exit
- $48,459
- IRR
- 53.3%
- Equity multiple
- 6.22×
- Total profit
- $475,023
- Equity at exit
- $28,100
Cash invested: $91,000 (down + closing). Projections, not guarantees.
Landlord ↔ Tenant lean methodology
- Overall (STATE)
- 21 Tenant-Leaning
- State New Jersey
- 21 Tenant-Leaning · D+6
- County
- — inherits STATE
- City
- — inherits STATE
ZIP-level market 08016
- Home prices YoY
- -21.8%
- Active inventory
- 179
- Price-to-rent
- 14.2×
Monthly cashflow live
- Estimated rent
- $7,634 high interval (Pro) →
- Mortgage (P&I)
- −$1,704
- Tax est. 1.5%
- −$406 /mo · $4,875/yr
- Insurance
- −$135
- HOA
- −$0
- Vacancy / Maint / Mgmt
- −$1,603
- Net cashflow
- $3,785
Break-even live
4-unit breakdown (identical units grouped — click to expand)
| Units | Beds | Baths | Est. rent |
|---|---|---|---|
| 4× units | 2 | 1 | $7,636 |
| #1 | 2 | 1 | $1,909 |
| #2 | 2 | 1 | $1,909 |
| #3 | 2 | 1 | $1,909 |
| #4 | 2 | 1 | $1,909 |
| Total (4 units) | $7,634 | ||
UW: 25.0% down · 7.5% · 30yr · 1.5% tax · 5.0% vac · 8.0% maint · 8.0% mgmt
Financing live
Cash to close
- Down payment
- $81,250
- Closing costs
- $9,750
- Reserves months
- —
- Total cash needed
- —
Loan-product check · same deal, 3 products live
Conventional
25% down · 7.5% · 30yr
- Down + closing
- —
- Monthly P&I
- —
- Monthly cashflow
- —
- DSCR
- —
- Eligible?
- —
Personal DTI + credit; lowest rate.
DSCR
20% down · 8.5% · 30yr
- Down + closing
- —
- Monthly P&I
- —
- Monthly cashflow
- —
- DSCR
- —
- Eligible?
- —
No personal income docs; deal must DSCR.
Hard money
10% down · 12.0% · 12mo
- Down + closing
- —
- Monthly P&I
- —
- Monthly cashflow
- —
- DSCR
- —
- Eligible?
- —
Short-term bridge; refi at stabilization.
Listing history 30 events
-
2026-06-18days on market $325,000 Active 153 DOM
-
2026-06-17days on market $325,000 Active 152 DOM
-
2026-06-16days on market $325,000 Active 151 DOM
-
2026-06-15days on market $325,000 Active 150 DOM
-
2026-06-13days on market $325,000 Active 148 DOM
-
2026-06-13days on market $325,000 Active 147 DOM
-
2026-06-09days on market $325,000 Active 144 DOM
-
2026-06-08days on market $325,000 Active 143 DOM
-
2026-06-07days on market $325,000 Active 142 DOM
-
2026-06-04days on market $325,000 Active 139 DOM
-
2026-06-03days on market $325,000 Active 138 DOM
-
2026-06-02days on market $325,000 Active 137 DOM
-
2026-06-01days on market $325,000 Active 136 DOM
-
2026-05-31days on market $325,000 Active 135 DOM
-
2026-01-16$325,000 Active
-
2025-04-23status Pending
-
2025-04-22historical
-
2025-04-04historical Active Under Contract
-
2025-02-03status Active
-
2025-01-31historical
-
2024-09-02$309,000 Active
-
2024-04-16status Pending
-
2024-04-16historical
-
2023-11-16status Active
-
2023-11-15historical
-
2023-05-17$289,900 Active
-
2022-06-29soldstatus $180,000 Closed
-
2022-06-03status Pending
-
2022-03-07price $179,000
-
2022-03-06$189,000 Active
ⓘ Source: listings_history table (triggers on properties + properties_extension) + one-shot
backfill from property_details.listing_events for pre-trigger history.
Nearby sold comps map
Loading sold comps map…
Walkable amenities ~0.75 mi
Loading nearby amenities…
Taxation est. · year 1
- Rental income
- $91,608
- − Mortgage interest
- −$18,205
- − Property taxes
- −$4,875
- − Insurance
- −$1,625
- − Repairs & maintenance
- −$7,329
- − Management
- −$7,329
- − Depreciation
- −$9,455
- Taxable income
- $42,791
- Est. tax owed @ 24.0%
- −$10,270
- After-tax cash flow
- $35,148/yr
For passive investors: Depreciation is non-cash, so a rental often shows a tax loss while cash-flowing — sheltering income. Rental losses are passive: they offset passive income freely, and up to $25,000/yr can offset ordinary (W-2) income if you actively participate and your MAGI is under $100k (phasing out to $0 by $150k); unused losses carry forward. On sale, claimed depreciation is recaptured at up to 25%, and gains may owe capital-gains tax (a 1031 exchange can defer both). Figures are a year-1 estimate at your 24.0% rate — not tax advice; consult a CPA.
Schools (NCES district)
- District
- Burlington City Public School District
- NCES district ID
- 3402430
- Math proficiency
- 7% ▼ -16.00%
- Reading proficiency
- 29% ▼ -8.00%
- Median HH income
- $51,122
- Composite
- 16.27/100
- National rank
- #9218
- State rank
- #439 of 472 in NJ
Livability — Burlington
- Score
- 78/100
- State rank
- #89
- US rank
- #2359
Category grades
Schools grade is shown separately in the Schools card above.
Census & demographics
- Census place
- Burlington, NJ
- County
- Burlington County · 323,710 people
- Metro
- Philadelphia-Camden-Wilmington, PA-NJ-DE-MD
- Population (ZIP)
- 34,920
- Household income
- $98,463
- Rent vs Own
- Severe rent burden
- 1045.0
Population outlook (Burlington County) Hauer SSP2
- Today (2025)
- 453,425 people
- By 2030
- 452,359 · -0.2%
- By 2040
- 445,033 · -1.9%
- By 2050
- 431,760 · -4.8%
- By 2075
- 406,277 · -10.4%
- By 2100
- 364,732 · -19.6%
Race, ethnicity, and origin ACS 2023
- Neighborhood character
- Diverse neighborhood (Simpson 0.68)
- Race & ethnicity
- White 44% Black 33% Two or more races 10% Hispanic / Latino 9% Asian 7%
- Hispanic origin (detail)
- Puerto Rican 4% Dominican 1%
- Common ancestry
- Romanian 4% Hispanic 2% Lithuanian 1%
- Foreign-born
- 15% · Canada
- Languages at home
- 84% English-only · Spanish 4% Other Indo-European 4% French/Haitian/Cajun 2%
Political lean MEDSL · Burlington
- 2024 margin
- D (+16.6) · D 57.6% · R 41.0% · Other 1.3%
- 2008→2024 swing
- -2.0pp toward R · 2008: 18.6pp · 2024: 16.6pp
- All cycles
- 2024: D+16.6 2020: D+19.5 2016: D+14.8 2012: D+18.7 2008: D+18.6
Not yet ingested
- Civics
- —
Market trends
- HPI YoY
- ▼ -83.42%
- Current HPI
- 298.7935
- Rent YoY
- —
- Metro
- Philadelphia-Camden-Wilmington, PA-NJ-DE-MD
- State GDP YoY
- ▲ 2.05%
- F500 in state
- 34
Industry mix (Fortune 500 HQ in NJ)
| Industry | F500 HQs | Revenue |
|---|---|---|
| Consumer Goods | 3 | $31B |
|
||
| Pharmaceuticals | 2 | $153B |
|
||
| Technology | 2 | $21B |
|
||
| Insurance | 2 | $20B |
|
||
| Healthcare | 2 | $19B |
|
||
| Financial Services | 1 | $70B |
|
||
Price history
+72.0% since first listed16 events — show timeline
- 2026-01-16 Listed $325,000 BRIGHT MLS
- 2025-04-23 Pending — BRIGHT MLS
- 2025-04-22 Listing Removed — BRIGHT MLS
- 2025-04-04 Contingent — BRIGHT MLS
- 2025-02-03 Relisted — BRIGHT MLS
- 2025-01-31 Listing Removed — BRIGHT MLS
- 2024-09-02 Listed $309,000 BRIGHT MLS
- 2024-04-16 Pending — BRIGHT MLS
- 2024-04-16 Listing Removed — BRIGHT MLS
- 2023-11-16 Relisted — BRIGHT MLS
- 2023-11-15 Listing Removed — BRIGHT MLS
- 2023-05-17 Listed $289,900 BRIGHT MLS
- 2022-06-29 Sold (MLS) $180,000 BRIGHT MLS
- 2022-06-03 Pending — BRIGHT MLS
- 2022-03-07 Price Changed $179,000 BRIGHT MLS
- 2022-03-06 Listed $189,000 BRIGHT MLS
Cash-flow waterfall
monthlySold comps — $/sqft
last 12 mo · ≤1 miLoading sold comps…