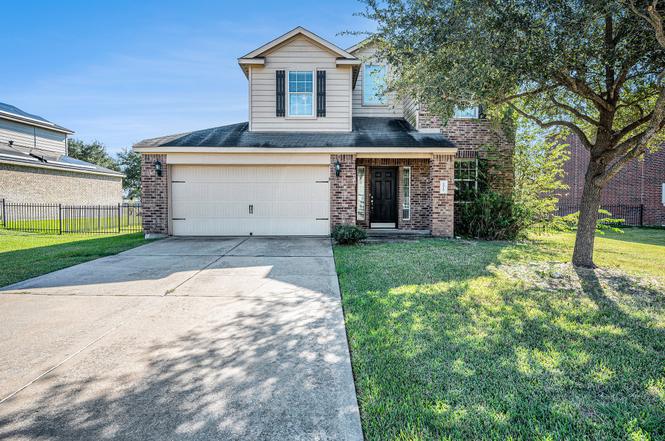
6919 Rambling Brook Ln · Rosenberg, TX
Flood risk 4/10 · Minor
- FEMA flood zone
- X (unshaded)
- Chance of flooding over 30 yrs
- 0.22%
- Est. flood insurance / yr
- $507 – $1,088
Fire risk 2/10 · Minimal
- Est. fire insurance / yr
- $1,222 – $2,270
Heat risk 9/10 · Severe
- Hot days now (above 110°F)
- 7 days/yr
- Hot days in 30 yrs
- 23 days/yr
Wind risk 9/10 · Severe
- Chance of severe wind over 30 yrs
- 99.0%
Air-quality risk 2/10 · Minimal
- Unhealthy air days now
- 1 days/yr
- Unhealthy air days in 30 yrs
- 1 days/yr
Risk factors via First Street. Map © Google.
Why this score? — see what drove the C grade
The composite is a weighted blend of 9 inputs, each scored 0–100. Each bar is that input's sub-score; the figure is the points it added to the 100-point composite (weight × sub-score).
- Cash flow +15.9/30.0
- ARV discount +15.0/15.0
- 1% rule +7.2/10.0
- DSCR +4.9/10.0
- Schools +4.6/10.0
- Livability +3.1/5.0
- Condition / age +2.5/5.0
- Rent growth +2.0/5.0
- Appreciation +0.0/10.0
$209,900
🖨 Deal sheet 📄 Offer letter ✓ Due diligence
Listing remarks MLS
New from LGI Homes: This beautiful new 2574 sq ft two story home features 4 bedrooms and 2.5 baths. The kitchen features beautiful wood cabinets, large island, gas range and black kitchen appliances. Additional features include raised six panel doors, brushed nickel hardware, large utility room. Master bedroom is located downstairs with a 5 piece master bath and large walkin closet.
Key facts
- 8,402 sq ft lot
- 2 garage spots
- Built 2011
Neighborhood map
What this means for you Summary
Snapshot
- This is a 4-bed/3.0-bath single-family listed at $210k.
Deal economics
- At list price, monthly cash flow is $98 ($1k/yr) — positive.
- The deal already cash-flows at list — no discount required.
- Meets the 1% rule at list price ($3k rent vs $210k).
- Recommended offer: $185k (12.0% below list) — sets the bar for market timing.
- Cap rate 6.9% vs local median 3.4% in Rosenberg — top-decile yield for the area; either an underpriced asset or a hidden risk that comps aren't pricing in. Stress-test before assuming the spread holds.
Location & tenants
- Location reads 62/100 on livability (#922 in TX) — a middle-class / working-renter tenant base. Strengths: cost of living A+, housing A+, crime B; Watch: schools D-, amenities F, commute F.
- Lamar CISD (suburban): math 50% / reading 53% proficiency, ranked #116 of 826 in TX (top 14%) — acceptable for families but not a draw, mixed tenant base, ~2y average lease.
- Market conditions: Rents soft (-1.8%/yr); 1332 active listings in the ZIP; 4 comparable units currently listed for rent nearby; rentals lingering (median 44d on market — plan ~5-8 weeks vacancy on turnover, expect pricing pressure); 75% of comp listings sitting > 30 days — soft ceiling on asking rent; solid renter incomes; 12,093 units permitted in Fort Bend County in 2024 (815 in 5+ unit buildings).
- This rent runs 30% of the median local income ($102k/yr) — at the standard rent-burdened threshold; future hikes will face affordability resistance.
Forward outlook
- Local home prices are declining (-3.0%/yr); year-one equity from $1k of loan paydown is wiped out by about $6k of value loss. Plan a longer hold.
- Fort Bend County population projected at +75% by 2050 — long-run rental-demand tailwind backs the buy-and-hold thesis.
Negotiation context
- It's been on market 138 days — a 12% lower offer ($185k) is reasonable based on typical stale-listing flexibility.
- 6 sale attempts since 15y ago; this cycle's ask has dropped $50k (19%) from the opening price — seller is motivated, your offer sets the floor, not the list.
Risks & watch-outs
- Watch-outs: property tax is 4.1% of price.
- Climate carrying-cost: severe wind risk, 99% chance of damaging wind over 30y; extreme-heat days projected 7→23/yr by 2055 (HVAC capex compounding) — expect insurance premiums to compound above CPI over the hold.
Questions for the listing agent
- It's been on market 138 days. Have you received any prior offers? Is the seller open to a 12% concession, seller financing, or rate buy-down credit?
- Property tax is high relative to price — has the assessment been appealed recently, and will the sale trigger a re-assessment?
- What does the HOA fee cover, when was the last increase, and are there any pending special assessments or reserve-fund shortfalls?
- Why hasn't it sold? Are there any deal-killer items the seller is aware of (foundation, flood, title, zoning, code violations)?
- Is there a deadline driving the sale (1031 exchange, divorce, estate, relocation)? That informs how much negotiation room exists.
- Schools are D-rated, which usually means shorter tenancies and higher turnover. Who's the typical renter profile here, and what's been the actual vacancy rate?
- What's the average days-on-market for RENTAL listings here right now (not sales)? A rising rental-DOM trend means longer vacancies and softer asking-rent achievability than the comps imply.
- What's the recent tenant-quality profile in this submarket — average credit score on applications, eviction rate, late-payment / NSF rate, and stable-employment percentage? A property-management company in the area should have these aggregated.
- How much new for-sale + rental construction is in the pipeline within 1–3 miles? Heavy new supply typically softens prices + rents 12–24 months out; constrained supply supports both.
Investment metrics
- 1% rule
- 1.22% ✓
- Cap rate
- 6.85%
- Cash-on-cash
- 2.00%
- DSCR
- 1.09
- GRM
- 6.8
CMA / ARV
- ARV (on-the-fly)
- $391,650
- Comps found
- 12
Show comp detail 12 sales within ~0.75 mi
| Address | Dist | Beds/Ba | Sqft | Sold | Price | $/sf | Match |
|---|---|---|---|---|---|---|---|
| 6919 Rambling Brook Ln | 0.00mi | 4/2.5 | 2,611 (0%) | 1mo | $209,900 | $80 | 98 |
| 4003 Prairie Grove Dr | 0.29mi | 5/3.0 (+1) | 2,632 (+1%) | 8mo | $375,000 | $142 | 73 |
| 4327 Waving Willow Way | 0.67mi | 4/2.5 | 2,452 (-6%) | 8mo | $364,990 | $149 | 50 |
| 4411 Waving Willow Way | 0.68mi | 4/2.5 | 2,452 (-6%) | 9mo | $364,990 | $149 | 49 |
| 4211 Waving Willow Way | 0.65mi | 5/3.0 (+1) | 2,439 (-7%) | 8mo | $379,990 | $156 | 47 |
| 4527 Waving Willow Way | 0.75mi | 4/2.5 | 2,452 (-6%) | 8mo | $379,990 | $155 | 47 |
| 4511 Waving Willow Way | 0.71mi | 5/3.0 (+1) | 2,439 (-7%) | 8mo | $384,990 | $158 | 44 |
| 6115 Juniper Cove Ct | 0.69mi | 5/3.0 (+1) | 2,439 (-7%) | 9mo | $365,990 | $150 | 44 |
| 4420 Rustling Aspen Dr | 0.72mi | 5/3.0 (+1) | 2,439 (-7%) | 8mo | $355,990 | $146 | 44 |
| 4503 Waving Willow Way | 0.70mi | 4/3.0 | 2,941 (+13%) | 8mo | $409,990 | $139 | 40 |
| 4327 Rustling Aspen Dr | 0.74mi | 4/3.0 | 2,297 (-12%) | 8mo | $359,990 | $157 | 39 |
| 6215 Wildflower Fields Ct | 0.74mi | 4/2.5 | 2,246 (-14%) | 3mo | $354,990 | $158 | 38 |
Match score weights: distance 35% · size 25% · config 20% · recency 20%. Top-matched comps best support the ARV.
Projected returns pro-forma
-3.0% appreciation · 0.0% rent growth · sell at horizon
- IRR
- -17.5%
- Equity multiple
- 0.41×
- Total profit
- $-34,949
- Equity at exit
- $31,297
- IRR
- -19.5%
- Equity multiple
- 0.15×
- Total profit
- $-50,082
- Equity at exit
- $18,148
Cash invested: $58,772 (down + closing). Projections, not guarantees.
Landlord ↔ Tenant lean methodology
- Overall (STATE)
- 87 Strongly Landlord-Friendly
- State Texas
- 87 Strongly Landlord-Friendly · R+5
- County
- — inherits STATE
- City
- — inherits STATE
ZIP-level market 77469
- Home prices YoY
- -25.1%
- Rents YoY
- -1.8%
- Active inventory
- 1332
- Price-to-rent
- 6.8×
Monthly cashflow live
- Estimated rent
- $2,564 medium interval (Pro) →
- Mortgage (P&I)
- −$1,101
- Tax from tax record
- −$720 /mo · $8,645/yr
- Insurance
- −$87
- HOA
- −$19
- Vacancy / Maint / Mgmt
- −$538
- Net cashflow
- $98
Break-even live
UW: 25.0% down · 7.5% · 30yr · 1.5% tax · 5.0% vac · 8.0% maint · 8.0% mgmt
Financing live
Cash to close
- Down payment
- $52,475
- Closing costs
- $6,297
- Reserves months
- —
- Total cash needed
- —
Loan-product check · same deal, 3 products live
Conventional
25% down · 7.5% · 30yr
- Down + closing
- —
- Monthly P&I
- —
- Monthly cashflow
- —
- DSCR
- —
- Eligible?
- —
Personal DTI + credit; lowest rate.
DSCR
20% down · 8.5% · 30yr
- Down + closing
- —
- Monthly P&I
- —
- Monthly cashflow
- —
- DSCR
- —
- Eligible?
- —
No personal income docs; deal must DSCR.
Hard money
10% down · 12.0% · 12mo
- Down + closing
- —
- Monthly P&I
- —
- Monthly cashflow
- —
- DSCR
- —
- Eligible?
- —
Short-term bridge; refi at stabilization.
Rent comps 4 comps
| Address | Beds | Baths | Sqft | Rent | $/sqft | DOM | Units | Dist |
|---|---|---|---|---|---|---|---|---|
| 6926 Atwood Preserve Ct Richmond, TX | 4.0 | 2.0 | 2139 | $2,000 | $0.94 | 43d | 1 | 0.55mi |
| 4212 Russet Elm Ln Richmond, TX | 4.0 | 2.5 | 2452 | $2,295 | $0.94 | 43d | 1 | 0.85mi |
| 7807 Eagle Creek Ln Richmond, TX | 4.0 | 3.0 | 2397 | $2,400 | $1.00 | 1d | 1 | 1.01mi |
| 5624 Forest Cove Dr Richmond, TX | 5.0 | 5.0 | 3126 | $3,200 | $1.02 | 43d | 1 | 1.13mi |
HOA detail
- Monthly dues
- $19 · $228/yr
- Likely covers
- gas
Listing history 17 events
-
2026-04-21status Pending
-
2026-04-16historical Active Under Contract
-
2026-04-11status Active
-
2026-04-06historical Active Under Contract
-
2026-03-27status Active
-
2026-03-12historical Active Under Contract
-
2026-03-05price $209,900
-
2026-02-26price $224,900
-
2026-02-19price $239,900
-
2026-02-11status Active
-
2025-12-19status Pending
-
2025-11-14status Active
-
2025-11-12status Pending
-
2025-10-09$259,900 Active
-
2012-06-29soldstatus 385-char remark
Show marketing remark (385 chars)
New from LGI Homes: This beautiful new 2574 sq ft two story home features 4 bedrooms and 2.5 baths. The kitchen features beautiful wood cabinets, large island, gas range and black kitchen appliances. Additional features include raised six panel doors, brushed nickel hardware, large utility room. Master bedroom is located downstairs with a 5 piece master bath and large walkin closet.
-
2012-05-14historical 385-char remark
Show marketing remark (385 chars)
New from LGI Homes: This beautiful new 2574 sq ft two story home features 4 bedrooms and 2.5 baths. The kitchen features beautiful wood cabinets, large island, gas range and black kitchen appliances. Additional features include raised six panel doors, brushed nickel hardware, large utility room. Master bedroom is located downstairs with a 5 piece master bath and large walkin closet.
-
2011-12-01$170,900 385-char remark
Show marketing remark (385 chars)
New from LGI Homes: This beautiful new 2574 sq ft two story home features 4 bedrooms and 2.5 baths. The kitchen features beautiful wood cabinets, large island, gas range and black kitchen appliances. Additional features include raised six panel doors, brushed nickel hardware, large utility room. Master bedroom is located downstairs with a 5 piece master bath and large walkin closet.
ⓘ Source: listings_history table (triggers on properties + properties_extension) + one-shot
backfill from property_details.listing_events for pre-trigger history.
Tax reassessment forecast TX · Resets to sale price
- Current annual tax
- $8,645 · $720/mo
- Projected year-2 tax
- $8,645 · $720/mo
- Expected delta
- $0/yr ($0/mo · 0.0%)
ⓘ Screening estimate from a state-policy table — verify with the county assessor before closing.
Climate risk First Street
- Flood 4/10 Moderate FEMA zone X (unshaded) · 22% chance over 30 yrs
- Wildfire 2/10 Low
- Heat 9/10 Extreme 7 d/yr ≥110°F today · 23 d/yr by 30 yrs out
- Wind 9/10 Extreme 99% chance of damaging wind over 30 yrs
- Air quality 2/10 Low 1 unhealthy d/yr today · 1 by 30 yrs out
Nearby sold comps map
Loading sold comps map…
Walkable amenities ~0.75 mi
Loading nearby amenities…
Taxation est. · year 1
- Rental income
- $30,769
- − Mortgage interest
- −$11,758
- − Property taxes
- −$8,645
- − Insurance
- −$1,050
- − Repairs & maintenance
- −$2,462
- − Management
- −$2,462
- − HOA
- −$228
- − Depreciation
- −$6,106
- Taxable loss
- −$1,940
- Est. tax savings @ 24.0%
- +$466
- After-tax cash flow
- $1,642/yr
For passive investors: Depreciation is non-cash, so a rental often shows a tax loss while cash-flowing — sheltering income. Rental losses are passive: they offset passive income freely, and up to $25,000/yr can offset ordinary (W-2) income if you actively participate and your MAGI is under $100k (phasing out to $0 by $150k); unused losses carry forward. On sale, claimed depreciation is recaptured at up to 25%, and gains may owe capital-gains tax (a 1031 exchange can defer both). Figures are a year-1 estimate at your 24.0% rate — not tax advice; consult a CPA.
Schools (NCES district)
- District
- Lamar CISD
- NCES district ID
- 4826580
- Math proficiency
- 50% ▼ -12.00%
- Reading proficiency
- 53% ▼ -4.00%
- Median HH income
- $75,213
- Composite
- 46.43/100
- National rank
- #2452
- State rank
- #116 of 826 in TX
Livability — Rosenberg
- Score
- 62/100
- State rank
- #922
- US rank
- #16414
Category grades
Schools grade is shown separately in the Schools card above.
Census & demographics
- County
- Fort Bend County · 836,777 people
- City population
- 115,151
- Metro
- Houston-The Woodlands-Sugar Land, TX
- Population (ZIP)
- 69,826
- Household income
- $102,125
- Rent vs Own
- Severe rent burden
- 1292.0
Population outlook (Fort Bend County) Hauer SSP2
- Today (2025)
- 1,004,526 people
- By 2030
- 1,153,104 · +14.8%
- By 2040
- 1,453,718 · +44.7%
- By 2050
- 1,753,781 · +74.6%
- By 2075
- 2,455,772 · +144.5%
- By 2100
- 2,930,528 · +191.7%
Race, ethnicity, and origin ACS 2023
- Neighborhood character
- Highly diverse neighborhood (Simpson 0.76)
- Race & ethnicity
- Hispanic / Latino 29% White 27% Black 25% Two or more races 15% Asian 15%
- Hispanic origin (detail)
- Mexican 21%
- Common ancestry
- Romanian 1% Lithuanian 1%
- Foreign-born
- 24% · Canada, Vietnam, China
- Languages at home
- 65% English-only · Spanish 17% Other Indo-European 7% Other Asian/Pacific 2%
Political lean MEDSL · Fort Bend
- 2024 margin
- Toss-up / Even · D 49.5% · R 47.9% · Other 2.6%
- 2008→2024 swing
- +4.0pp toward D · 2008: -2.4pp · 2024: 1.6pp
- All cycles
- 2024: D+1.6 2020: D+10.6 2016: D+6.6 2012: R+6.8 2008: R+2.4
Not yet ingested
- Civics
- —
Market trends
- HPI YoY
- ▼ -78.66%
- Current HPI
- 234.9892
- Rent YoY
- ▼ -1.81%
- Metro
- Houston-The Woodlands-Sugar Land, TX
- State GDP YoY
- ▲ 3.95%
- F500 in state
- 110
Industry mix (Fortune 500 HQ in TX)
| Industry | F500 HQs | Revenue |
|---|---|---|
| Energy | 16 | $1,198B |
|
||
| Technology | 5 | $198B |
|
||
| Engineering / Construction | 4 | $72B |
|
||
| Energy Services | 3 | $60B |
|
||
| Utilities | 3 | $41B |
|
||
| Healthcare | 2 | $330B |
|
||
Price history
+22.8% since first listed17 events — show timeline
- 2026-04-21 Pending — HARMLS
- 2026-04-16 Contingent — HARMLS
- 2026-04-11 Relisted — HARMLS
- 2026-04-06 Contingent — HARMLS
- 2026-03-27 Relisted — HARMLS
- 2026-03-12 Contingent — HARMLS
- 2026-03-05 Price Changed $209,900 HARMLS
- 2026-02-26 Price Changed $224,900 HARMLS
- 2026-02-19 Price Changed $239,900 HARMLS
- 2026-02-11 Relisted — HARMLS
- 2025-12-19 Pending — HARMLS
- 2025-11-14 Relisted — HARMLS
- 2025-11-12 Pending — HARMLS
- 2025-10-09 Listed $259,900 HARMLS
- 2012-06-29 Sold (MLS) — HARMLS
- 2012-05-14 Listing Removed — HARMLS
- 2011-12-01 Listed $170,900 HARMLS
Property tax history
+15.6%/yrLatest (2025): $8,645 · -6.1% YoY. Source: county tax records.
Cash-flow waterfall
monthlySold comps — $/sqft
last 12 mo · ≤1 miLoading sold comps…