2756 E Cairo St · Springfield, MO
Flood risk 1/10 · Minimal
- FEMA flood zone
- X (unshaded)
- Chance of flooding over 30 yrs
- 0.0%
- Est. flood insurance / yr
- $507 – $1,088
Fire risk 2/10 · Minimal
- Est. fire insurance / yr
- $1,054 – $1,958
Heat risk 5/10 · Moderate
- Hot days now (above 104°F)
- 7 days/yr
- Hot days in 30 yrs
- 18 days/yr
Wind risk 2/10 · Minimal
- Chance of severe wind over 30 yrs
- —
Air-quality risk 2/10 · Minimal
- Unhealthy air days now
- 2 days/yr
- Unhealthy air days in 30 yrs
- 2 days/yr
Risk factors via First Street. Map © Google.
Why this score? — see what drove the D grade
The composite is a weighted blend of 9 inputs, each scored 0–100. Each bar is that input's sub-score; the figure is the points it added to the 100-point composite (weight × sub-score).
- Cash flow +11.9/30.0
- ARV discount +10.4/15.0
- Livability +3.8/5.0
- Rent growth +3.7/5.0
- DSCR +3.5/10.0
- Schools +3.2/10.0
- 1% rule +2.5/10.0
- Condition / age +2.5/5.0
- Appreciation +0.0/10.0
$170,000
🖨 Deal sheet 📄 Offer letter ✓ Due diligence
Listing remarks
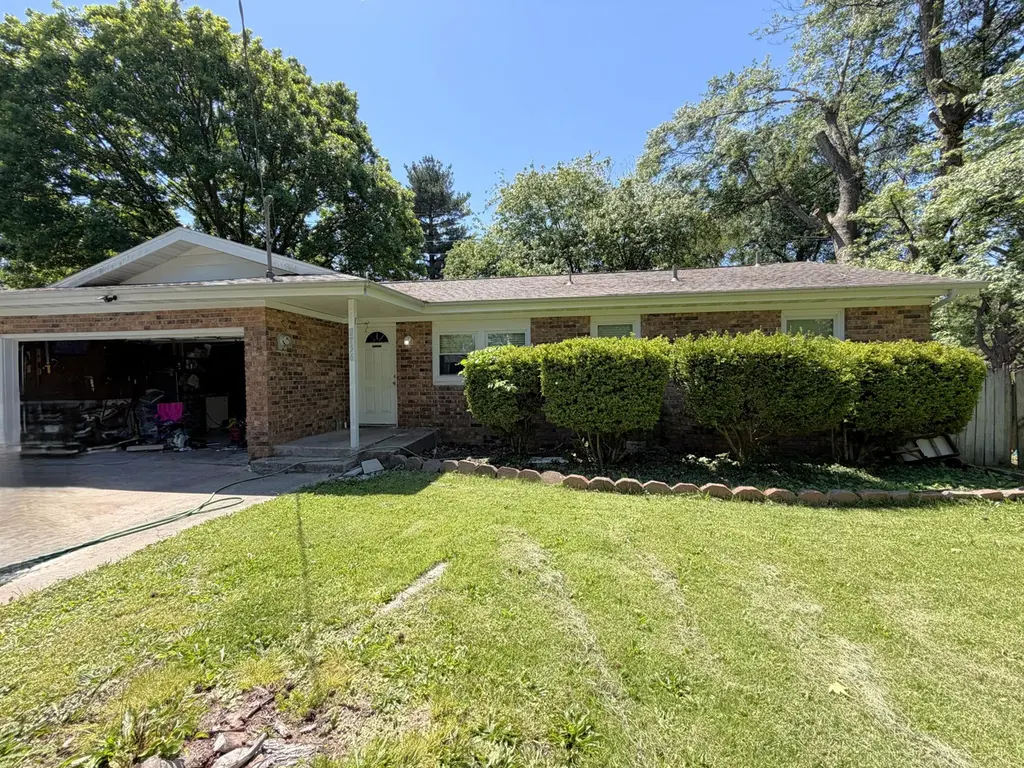
Solid brick-front home is an excellent opportunity for investors! With strong curb appeal and a durable exterior, this property offers the kind of long-term value buyers are looking for. Currently tenant-occupied at $1,500 per month through 10/31/2026, providing immediate rental income from day one. The appealing exterior, established tenancy, and dependable rental history make this property a great addition to an investment portfolio. Whether you are expanding your holdings or purchasing your first rental property, this home offers strong investment potential with a lease already in place.
Key facts
- Brick-front home
- 0.24 acre lot
- 2 garage spots
Tags
Property features AI
Exterior
- Parking: 2-car garage
- Utilities: Public water; Public sewer
- Home design: Single-family residence; One story
- Exterior features: Corner lot; 0.24-acre lot
Interior
- Bathrooms: 1 full bathroom
- Heating & cooling: Central heating; Central air conditioning
- Interior features: Ceiling fan(s); Central heating
Neighborhood map
What this means for you Summary
Snapshot
- This is a 3-bed/1.0-bath single-family listed at $170k.
Deal economics
- At list price, monthly cash flow is $-45 ($-536/yr) — negative.
- To cash-flow at today's rent, offer at most $162k (4.6% below list).
- To meet the 1% rule (rent ≥ 1% of price), the offer needs to be $127k (25.3% below list).
- Recommended offer: $127k (25.3% below list) — sets the bar for 1% rule.
- Cap rate 6.0% vs local median 4.6% in Springfield — meaningfully above typical; check what's discounted (condition, days-on-market, listing class) to confirm the premium yield is real.
Location & tenants
- Location reads 75/100 on livability (#57 in MO, #4,121 nationally) — a middle-class / working-renter tenant base. Strengths: commute A+, cost of living A+, housing A+; Watch: crime F, employment F.
- Springfield R-XII (urban): math 32% / reading 46% proficiency, ranked #174 of 324 in MO (top 54%) — families likely to look elsewhere, expect single-tenant / working-renter base with shorter leases.
- Zoned schools: Bingham Elem. (math 27% / reading 37%, grade F, #761 of 1,115 statewide, top 72%, 422 students, 78% FRL); Hickory Hills Middle (math 31% / reading 44%, grade F, #215 of 391 statewide, top 56%, 414 students, 46% FRL); Glendale High (math 21% / reading 55%, grade F, #290 of 521 statewide, top 56%, 1,307 students, 33% FRL).
- Market conditions: Rents rising fast (+4.8%/yr); 512 active listings in the ZIP; 21 comparable units currently listed for rent nearby; rentals lingering (median 44d on market — plan ~5-8 weeks vacancy on turnover, expect pricing pressure); 52% of comp listings sitting > 30 days — soft ceiling on asking rent; 1,302 units permitted in Greene County in 2024 (250 in 5+ unit buildings).
Forward outlook
- Local home prices are declining (-3.0%/yr); year-one equity from $1k of loan paydown is wiped out by about $5k of value loss. Plan a longer hold.
- Greene County population projected at +25% by 2050 — long-run rental-demand tailwind backs the buy-and-hold thesis.
Negotiation context
- It's been on market 35 days — a 3% lower offer ($165k) is reasonable based on typical stale-listing flexibility.
- 4 sale attempts since 10y ago with the ask held roughly flat each time — persistent listings suggest the price (not the market) is what's stuck; bring a comps-based counter.
Risks & watch-outs
- Climate carrying-cost: extreme-heat days projected 7→18/yr by 2055 (HVAC capex compounding) — expect insurance premiums to compound above CPI over the hold.
Questions for the listing agent
- What do current leases actually rent for vs. the listed asking? Can we see a recent rent roll and the last 12 months of T-12 income?
- It's been on market 35 days. Have you received any prior offers? Is the seller open to a 25% concession, seller financing, or rate buy-down credit?
- Built in 1971 — when were the roof, HVAC, electrical panel, plumbing, and water heater last replaced?
- Is there a deadline driving the sale (1031 exchange, divorce, estate, relocation)? That informs how much negotiation room exists.
- Crime grade is F in this area — have there been break-ins, vandalism, or insurance claims at this property in the last 3 years? What carrier currently insures it and at what premium?
- The area grade is low — what's the realistic commute time and amenity access for the typical tenant pool here? Any planned neighborhood developments (good or bad) we should know about?
- What's the average days-on-market for RENTAL listings here right now (not sales)? A rising rental-DOM trend means longer vacancies and softer asking-rent achievability than the comps imply.
- What's the recent tenant-quality profile in this submarket — average credit score on applications, eviction rate, late-payment / NSF rate, and stable-employment percentage? A property-management company in the area should have these aggregated.
- How much new for-sale + rental construction is in the pipeline within 1–3 miles? Heavy new supply typically softens prices + rents 12–24 months out; constrained supply supports both.
Investment metrics
- 1% rule
- 0.75% ✗
- Cap rate
- 5.98%
- Cash-on-cash
- -1.13%
- DSCR
- 0.95
- GRM
- 11.2
CMA / ARV
- ARV (median comp)
- $181,600
- List price
- $170,000
- Delta
- -6.39%
- Verdict
- FAIR
- Comps
- 20 within 1.0 mi
Show comp detail 12 sales within ~0.75 mi
| Address | Dist | Beds/Ba | Sqft | Sold | Price | $/sf | Match |
|---|---|---|---|---|---|---|---|
| 217 N Ken Ave | 0.16mi | 3/1.5 | 1,188 (-4%) | 2mo | $200,000 | $168 | 82 |
| 639 S Old Orchard Ave | 0.35mi | 3/1.0 | 1,272 (+3%) | 1mo | $119,000 | $94 | 78 |
| 209 S Burton Ave | 0.16mi | 2/1.0 (-1) | 1,168 (-6%) | 2mo | $129,000 | $110 | 77 |
| 2626 E Elm St | 0.23mi | 4/2.0 (+1) | 1,248 (+1%) | 4mo | $199,500 | $160 | 76 |
| 510 S Burton Ave | 0.17mi | 3/2.0 | 1,152 (-7%) | 3mo | $199,900 | $174 | 74 |
| 514 S Prince Ln | 0.28mi | 3/1.5 | 1,316 (+6%) | 2mo | $220,000 | $167 | 73 |
| 2918 E Monroe Ter | 0.54mi | 3/1.5 | 1,229 (-1%) | 2mo | $209,000 | $170 | 70 |
| 620 S Belcrest Ave | 0.44mi | 3/1.0 | 1,160 (-6%) | 2mo | $94,900 | $82 | 67 |
| 634 N Lone Pine Ave | 0.55mi | 2/2.0 (-1) | 1,200 (-3%) | 1mo | $210,000 | $175 | 59 |
| 2212 E Cherry St | 0.71mi | 3/2.0 | 1,200 (-3%) | 3mo | $181,000 | $151 | 55 |
| 2965 E Belmont St | 0.73mi | 3/2.0 | 1,385 (+12%) | 3mo | $269,900 | $195 | 39 |
| 2154 E Cairo St | 0.72mi | 3/2.0 | 1,080 (-13%) | 4mo | $144,400 | $134 | 38 |
Match score weights: distance 35% · size 25% · config 20% · recency 20%. Top-matched comps best support the ARV.
Projected returns pro-forma
-3.0% appreciation · 4.82% rent growth · sell at horizon
- IRR
- -16.4%
- Equity multiple
- 0.41×
- Total profit
- $-28,082
- Equity at exit
- $25,348
- IRR
- -5.5%
- Equity multiple
- 0.62×
- Total profit
- $-18,271
- Equity at exit
- $14,698
Cash invested: $47,600 (down + closing). Projections, not guarantees.
Landlord ↔ Tenant lean methodology
- Overall (STATE)
- 81 Strongly Landlord-Friendly
- State Missouri
- 81 Strongly Landlord-Friendly · R+10
- County
- — inherits STATE
- City
- — inherits STATE
ZIP-level market 65802
- Home prices YoY
- -31.9%
- Rents YoY
- 4.8%
- Active inventory
- 512
- Price-to-rent
- 11.2×
Monthly cashflow live
- Estimated rent
- $1,270 high interval (Pro) →
- Mortgage (P&I)
- −$891
- Tax from tax record
- −$86 /mo · $1,027/yr
- Insurance
- −$71
- HOA
- −$0
- Vacancy / Maint / Mgmt
- −$267
- Net cashflow
- $-45
Break-even live
UW: 25.0% down · 7.5% · 30yr · 1.5% tax · 5.0% vac · 8.0% maint · 8.0% mgmt
Financing live
Cash to close
- Down payment
- $42,500
- Closing costs
- $5,100
- Reserves months
- —
- Total cash needed
- —
Loan-product check · same deal, 3 products live
Conventional
25% down · 7.5% · 30yr
- Down + closing
- —
- Monthly P&I
- —
- Monthly cashflow
- —
- DSCR
- —
- Eligible?
- —
Personal DTI + credit; lowest rate.
DSCR
20% down · 8.5% · 30yr
- Down + closing
- —
- Monthly P&I
- —
- Monthly cashflow
- —
- DSCR
- —
- Eligible?
- —
No personal income docs; deal must DSCR.
Hard money
10% down · 12.0% · 12mo
- Down + closing
- —
- Monthly P&I
- —
- Monthly cashflow
- —
- DSCR
- —
- Eligible?
- —
Short-term bridge; refi at stabilization.
Rent comps 21 comps
| Address | Beds | Baths | Sqft | Rent | $/sqft | DOM | Units | Dist |
|---|---|---|---|---|---|---|---|---|
| 531 N Oak Grove Ave Springfield, MO | 2.0 | 1.5 | 1184 | $925 | $0.78 | 43d | 1 | 0.43mi |
| 504 N Patterson Ave Apt C Springfield, MO | 2.0 | 1.0 | 760 | $725 | $0.95 | 43d | 1 | 0.52mi |
| 2323 E Cherry St Springfield, MO | 2.0 | 1.5 | 750 | $1,195 | $1.59 | 23d | 1 | 0.59mi |
| 2323 E Cherry St Springfield, MO | 2.0 | 1.5 | 750 | $1,195 | $1.59 | 13d | 1 | 0.59mi |
| 3080 E Cherry St Unit D312 Springfield, MO | 2.0 | 2.0 | 730 | $1,125 | $1.54 | 23d | 1 | 0.61mi |
| 3080 E Cherry St Unit F104-ADA Springfield, MO | 3.0 | 2.0 | 1030 | $1,500 | $1.46 | 23d | 1 | 0.61mi |
| 3080 E Cherry St Unit H104-ADA Springfield, MO | 3.0 | 2.0 | 1030 | $1,565 | $1.52 | 43d | 1 | 0.61mi |
| 3080 E Cherry St Unit G308 Springfield, MO | 2.0 | 2.0 | 730 | $1,245 | $1.71 | 43d | 1 | 0.61mi |
| 2154 E Cairo St Springfield, MO | 3.0 | 2.0 | 1100 | $1,395 | $1.27 | 43d | 1 | 0.72mi |
| 3455 E Lombard St Springfield, MO | 2.0 | 2.0 | 828 | $905 | $1.09 | 43d | 1 | 1.14mi |
| 3501 E Lombard St Springfield, MO | 1.0–3.0 | 1.0–2.0 | 800 | $1,065 | $1.33 | 43d | 1 | 1.15mi |
| 3440 E Lombard St Unit 110 Springfield, MO | 2.0 | 1.5 | 900 | $875 | $0.97 | 43d | 1 | 1.19mi |
| 3440 E Lombard St Unit 129 Springfield, MO | 2.0 | 1.5 | 900 | $875 | $0.97 | 23d | 1 | 1.19mi |
| 1834 E Monroe St Springfield, MO | 2.0 | 1.0 | 792 | $895 | $1.13 | 43d | 1 | 1.21mi |
| 1302 S Estate Ave Springfield, MO | 2.0 | 1.0 | 768 | $1,100 | $1.43 | 23d | 1 | 1.24mi |
| 726 S Kentwood Ave Springfield, MO | 2.0 | 1.0 | 1116 | $1,295 | $1.16 | 13d | 1 | 1.33mi |
| 1225 S Ingram Mill Rd Springfield, MO | 1.0–2.0 | 1.0–2.0 | 1150 | $2,345 | $2.04 | 13d | 4 | 1.36mi |
| 2323 E Division St Springfield, MO | 4.0 | 2.0 | 1156 | $1,495 | $1.29 | 23d | 1 | 1.36mi |
| 2765 E Verona St Springfield, MO | 3.0 | 2.0 | 1244 | $1,600 | $1.29 | 43d | 1 | 1.38mi |
| 2641 E Verona St Springfield, MO | 3.0 | 2.0 | 1293 | $1,750 | $1.35 | 23d | 1 | 1.39mi |
| 2146 E Bennett St Unit 0 Springfield, MO | 2.0 | 1.0 | 1009 | $895 | $0.89 | 43d | 1 | 1.48mi |
Listing history 22 events
-
2026-06-18days on market $170,000 Active 35 DOM
-
2026-06-17days on market $170,000 Active 34 DOM
-
2026-06-16days on market $170,000 Active 33 DOM
-
2026-06-15days on market $170,000 Active 32 DOM
-
2026-06-14days on market $170,000 Active 30 DOM
-
2026-06-10days on market $170,000 Active 27 DOM
-
2026-06-09days on market $170,000 Active 26 DOM
-
2026-06-08days on market $170,000 Active 25 DOM
-
2026-06-07days on market $170,000 Active 24 DOM
-
2026-06-03days on market $170,000 Active 20 DOM
-
2026-06-02days on market $170,000 Active 19 DOM
-
2026-06-01days on market $170,000 Active 18 DOM
-
2026-05-31days on market $170,000 Active 17 DOM
-
2026-05-30days on market $170,000 Active 16 DOM
-
2026-05-14$170,000 Active 597-char remark
-
2024-11-07historical $1,295
-
2024-10-26$1,295
-
2022-12-14historical
-
2019-03-15soldstatus $355,524
-
2017-01-01$65,000
-
2016-01-12$104,113
-
2004-03-26soldstatus
ⓘ Source: listings_history table (triggers on properties + properties_extension) + one-shot
backfill from property_details.listing_events for pre-trigger history.
Tax reassessment forecast MO · Resets to sale price
- Current annual tax
- $1,027 · $86/mo
- Projected year-2 tax
- $1,649 · $137/mo
- Expected delta
- +$622/yr (+$52/mo · 60.5%)
ⓘ Screening estimate from a state-policy table — verify with the county assessor before closing.
Climate risk First Street
- Flood 1/10 Low FEMA zone X (unshaded) · 0% chance over 30 yrs
- Wildfire 2/10 Low
- Heat 5/10 Major 7 d/yr ≥104°F today · 18 d/yr by 30 yrs out
- Wind 2/10 Low
- Air quality 2/10 Low 2 unhealthy d/yr today · 2 by 30 yrs out
Nearby sold comps map
Loading sold comps map…
Walkable amenities ~0.75 mi
Loading nearby amenities…
Taxation est. · year 1
- Rental income
- $15,240
- − Mortgage interest
- −$9,523
- − Property taxes
- −$1,027
- − Insurance
- −$850
- − Repairs & maintenance
- −$1,219
- − Management
- −$1,219
- − Depreciation
- −$4,945
- Taxable loss
- −$3,544
- Est. tax savings @ 24.0%
- +$851
- After-tax cash flow
- $315/yr
For passive investors: Depreciation is non-cash, so a rental often shows a tax loss while cash-flowing — sheltering income. Rental losses are passive: they offset passive income freely, and up to $25,000/yr can offset ordinary (W-2) income if you actively participate and your MAGI is under $100k (phasing out to $0 by $150k); unused losses carry forward. On sale, claimed depreciation is recaptured at up to 25%, and gains may owe capital-gains tax (a 1031 exchange can defer both). Figures are a year-1 estimate at your 24.0% rate — not tax advice; consult a CPA.
Schools (NCES district)
- District
- Springfield R-XII
- NCES district ID
- 2928860
- Math proficiency
- 32% ▼ -2.00%
- Reading proficiency
- 46% ▼ -3.00%
- Median HH income
- $37,886
- Composite
- 32.45/100
- National rank
- #5717
- State rank
- #174 of 324 in MO
Livability — Springfield
- Score
- 75/100
- State rank
- #57
- US rank
- #4121
Category grades
Schools grade is shown separately in the Schools card above.
Census & demographics
- Census place
- Springfield, MO
- County
- Greene County · 244,327 people
- City population
- 223,044
- Metro
- Springfield, MO
- Population (ZIP)
- 46,739
- Household income
- $55,019
- Rent vs Own
- Severe rent burden
- 1818.0
Population outlook (Greene County) Hauer SSP2
- Today (2025)
- 319,054 people
- By 2030
- 335,135 · +5.0%
- By 2040
- 366,186 · +14.8%
- By 2050
- 397,431 · +24.6%
- By 2075
- 477,035 · +49.5%
- By 2100
- 520,828 · +63.2%
Race, ethnicity, and origin ACS 2023
- Neighborhood character
- Predominantly White (81%)
- Race & ethnicity
- White 81% Two or more races 8% Hispanic / Latino 5% Black 4% Asian 2%
- Common ancestry
- Slovak 2% Lithuanian 2% Italian 2%
- Foreign-born
- 3% · Canada, Vietnam
- Languages at home
- 95% English-only · Spanish 2% Vietnamese 1% Other Indo-European 1%
Political lean MEDSL · Greene
- 2024 margin
- Strong R (+20.8) · D 38.9% · R 59.7% · Other 1.4%
- 2008→2024 swing
- -5.0pp toward R · 2008: -15.8pp · 2024: -20.8pp
- All cycles
- 2024: R+20.8 2020: R+20.1 2016: R+27.4 2012: R+24.4 2008: R+15.8
Not yet ingested
- Civics
- —
Market trends
- HPI YoY
- ▼ -99.72%
- Current HPI
- 212.9826
- Rent YoY
- ▲ 4.82%
- Metro
- Springfield, MO
- State GDP YoY
- ▲ 1.84%
- F500 in state
- 20
Industry mix (Fortune 500 HQ in MO)
| Industry | F500 HQs | Revenue |
|---|---|---|
| Healthcare | 1 | $163B |
|
||
| Insurance | 1 | $21B |
|
||
| Industrial Technology | 1 | $17B |
|
||
| Retail | 1 | $16B |
|
||
| Industrial Distribution | 1 | $10B |
|
||
| Utilities | 1 | $9B |
|
||
Price history
+63.3% since first listed8 events — show timeline
- 2026-05-14 Listed $170,000 SOMO
- 2024-11-07 Rental Removed $1,295 APPFOLIO
- 2024-10-26 Listed for Rent $1,295 APPFOLIO
- 2022-12-14 Rental Removed — RENT.
- 2019-03-15 Sold (Public Records) $355,524 Public Records
- 2017-01-01 Listed $65,000 SOMO
- 2016-01-12 Listed $104,113 SOMO
- 2004-03-26 Sold (Public Records) — Public Records
Property tax history
+3.4%/yrLatest (2025): $1,027 · +27.1% YoY. Source: county tax records.
Cash-flow waterfall
monthlySold comps — $/sqft
last 12 mo · ≤1 miLoading sold comps…