138 36th Ave N · St. Petersburg, FL
Flood risk 9/10 · Severe
- FEMA flood zone
- X (shaded)
- Chance of flooding over 30 yrs
- 0.99%
- Est. flood insurance / yr
- $507 – $1,088
Fire risk 1/10 · Minimal
- Est. fire insurance / yr
- $947 – $1,759
Heat risk 10/10 · Severe
- Hot days now (above 106°F)
- 7 days/yr
- Hot days in 30 yrs
- 27 days/yr
Wind risk 10/10 · Severe
- Chance of severe wind over 30 yrs
- 99.0%
Air-quality risk 3/10 · Minor
- Unhealthy air days now
- 2 days/yr
- Unhealthy air days in 30 yrs
- 3 days/yr
Risk factors via First Street. Map © Google.
Why this score? — see what drove the B- grade
The composite is a weighted blend of 9 inputs, each scored 0–100. Each bar is that input's sub-score; the figure is the points it added to the 100-point composite (weight × sub-score).
- Cash flow +28.8/30.0
- DSCR +10.0/10.0
- 1% rule +8.0/10.0
- ARV discount +7.5/15.0
- Schools +4.3/10.0
- Rent growth +3.4/5.0
- Livability +2.5/5.0
- Condition / age +1.0/5.0
- Appreciation +0.0/10.0
$144,000
🖨 Deal sheet 📄 Offer letter ✓ Due diligence
Listing remarks
Very nice quiet over 55 community. 1 bed 1 bath Ground Floor with front and back door. sorry no pets or rentals. Close to downtown St. Pete, walk to shopping, walk to Tampa Bay. Property sold as-is.
Key facts
- Walk to tampa bay
- Ground floor
- Walk to shopping
Tags
Property features AI
Exterior
- Home design: Built in 1974
- Construction: Living area approximately 770
- Exterior features: Located in the North East Park subdivision
Neighborhood map
What this means for you Summary
Snapshot
- This is a 1-bed/1.0-bath other listed at $144k. Condition is rated poor.
Deal economics
- At list price, monthly cash flow is $419 ($5k/yr) — positive.
- The deal already cash-flows at list — no discount required.
- Meets the 1% rule at list price ($2k rent vs $144k).
- Recommended offer: $142k (1.5% below list) — sets the bar for market timing.
- Cap rate 10.3% vs local median 2.6% in St. Petersburg — top-decile yield for the area; either an underpriced asset or a hidden risk that comps aren't pricing in. Stress-test before assuming the spread holds.
Location & tenants
- Location reads: area grade B — affects rentability + tenant quality, not the cash-flow math above.
- Pinellas (suburban): math 51% / reading 51% proficiency, ranked #31 of 73 in FL (top 42%) — acceptable for families but not a draw, mixed tenant base, ~2y average lease.
- Market conditions: Rents rising (+3.4%/yr); 239 active listings in the ZIP; 40 comparable units currently listed for rent nearby; rentals at typical pace (median 15d on market — plan ~3-4 weeks tenant-placement turnaround); solid renter incomes; 2,676 units permitted in Pinellas County in 2024 (1,422 in 5+ unit buildings).
Forward outlook
- Local home prices are declining (-3.0%/yr); year-one equity from $996 of loan paydown is wiped out by about $4k of value loss. Plan a longer hold.
- Pinellas County population projected at +14% by 2050 — modest demand growth; plan on rents tracking national, not racing it.
- At projected returns (-3.0% appreciation + 3.4% rent growth), your $40k cash investment doubles in ~9 years — after that, you're playing with house money.
Negotiation context
- It's been on market 22 days — a 2% lower offer ($142k) is reasonable based on typical stale-listing flexibility.
Risks & watch-outs
- Watch-outs: flood insurance adds $66/mo.
- Climate carrying-cost: severe flood risk; severe wind risk, 99% chance of damaging wind over 30y; extreme-heat days projected 7→27/yr by 2055 (HVAC capex compounding) — expect insurance premiums to compound above CPI over the hold.
Questions for the listing agent
- Have any recent inspections been done? Can we get a copy of the seller's disclosures and any deferred-maintenance estimates?
- Built in 1974 — when were the roof, HVAC, electrical panel, plumbing, and water heater last replaced?
- What's the actual annual flood-insurance premium (NFIP or private), and is the property in a SFHA with mandatory coverage?
- Is there a deadline driving the sale (1031 exchange, divorce, estate, relocation)? That informs how much negotiation room exists.
- What's the average days-on-market for RENTAL listings here right now (not sales)? A rising rental-DOM trend means longer vacancies and softer asking-rent achievability than the comps imply.
- What's the recent tenant-quality profile in this submarket — average credit score on applications, eviction rate, late-payment / NSF rate, and stable-employment percentage? A property-management company in the area should have these aggregated.
- How much new for-sale + rental construction is in the pipeline within 1–3 miles? Heavy new supply typically softens prices + rents 12–24 months out; constrained supply supports both.
Investment metrics
- 1% rule
- 1.30% ✓
- Cap rate
- 10.34%
- Cash-on-cash
- 14.46%
- DSCR
- 1.64
- GRM
- 6.4
CMA / ARV
No comps found within radius.
Projected returns pro-forma
-3.0% appreciation · 3.43% rent growth · sell at horizon
- IRR
- 2.7%
- Equity multiple
- 1.11×
- Total profit
- $4,253
- Equity at exit
- $21,471
- IRR
- 12.8%
- Equity multiple
- 2.04×
- Total profit
- $41,741
- Equity at exit
- $12,450
Cash invested: $40,320 (down + closing). Projections, not guarantees.
Landlord ↔ Tenant lean methodology
- Overall (STATE)
- 87 Strongly Landlord-Friendly
- State Florida
- 87 Strongly Landlord-Friendly · R+3
- County
- — inherits STATE
- City
- — inherits STATE
ZIP-level market 33704
- Rents YoY
- 3.4%
- Active inventory
- 239
- Price-to-rent
- 6.4×
Monthly cashflow live
- Estimated rent
- $1,875 high interval (Pro) →
- Mortgage (P&I)
- −$755
- Tax est. 1.5%
- −$180 /mo · $2,160/yr
- Insurance
- −$60
- Flood insurance flood zone
- −$66 /mo · $798/yr
- HOA
- −$0
- Vacancy / Maint / Mgmt
- −$394
- Net cashflow
- $419
Break-even live
Sensitivity live
| Price | -10% $519 | -5% $469 | +0% $419 | +5% $370 | +10% $320 |
|---|---|---|---|---|---|
| Rent | -10% $271 | -5% $345 | +0% $419 | +5% $493 | +10% $567 |
| Rate | -1.0pp $492 | -0.5pp $456 | base $419 | +0.5pp $382 | +1.0pp $344 |
UW: 25.0% down · 7.5% · 30yr · 1.5% tax · 5.0% vac · 8.0% maint · 8.0% mgmt
Financing live
Cash to close
- Down payment
- $36,000
- Closing costs
- $4,320
- Reserves months
- —
- Total cash needed
- —
Loan-product check · same deal, 3 products live
Conventional
25% down · 7.5% · 30yr
- Down + closing
- —
- Monthly P&I
- —
- Monthly cashflow
- —
- DSCR
- —
- Eligible?
- —
Personal DTI + credit; lowest rate.
DSCR
20% down · 8.5% · 30yr
- Down + closing
- —
- Monthly P&I
- —
- Monthly cashflow
- —
- DSCR
- —
- Eligible?
- —
No personal income docs; deal must DSCR.
Hard money
10% down · 12.0% · 12mo
- Down + closing
- —
- Monthly P&I
- —
- Monthly cashflow
- —
- DSCR
- —
- Eligible?
- —
Short-term bridge; refi at stabilization.
Rent comps 40 comps
| Address | Beds | Baths | Sqft | Rent | $/sqft | DOM | Units | Dist |
|---|---|---|---|---|---|---|---|---|
| 252 33rd Ave N St. Petersburg, FL | 1.0 | 1.0 | 700 | $1,995 | $2.85 | 18d | 1 | 0.22mi |
| 344 33rd Ave N St. Petersburg, FL | 1.0 | 1.0 | 560 | $1,200 | $2.14 | 4d | 1 | 0.25mi |
| 131 41st Ave N Saint Petersburg, FL | 2.0 | 2.0 | 933 | $2,100 | $2.25 | 4d | 2 | 0.33mi |
| 4200 1st St NE Unit 2 St. Petersburg, FL | 1.0 | 1.0 | 800 | $1,650 | $2.06 | 24d | 1 | 0.39mi |
| 646 38th Ave N Saint Petersburg, FL | 2.0 | 1.0 | 978 | $2,400 | $2.45 | 4d | 1 | 0.40mi |
| 535 32nd Ave N Unit 5 St. Petersburg, FL | 1.0 | 1.0 | 675 | $1,750 | $2.59 | 14d | 1 | 0.41mi |
| 442 30th Ave N Unit 9 St. Petersburg, FL | 1.0 | 1.0 | 550 | $1,545 | $2.81 | 13d | 1 | 0.45mi |
| 468 44th Ave N Unit 1/2 St. Petersburg, FL | 1.0 | 1.0 | 693 | $1,900 | $2.74 | 24d | 1 | 0.54mi |
| 800 32nd Ave N Saint Petersburg, FL | 1.0–2.0 | 1.0 | 932 | $1,349 | $1.45 | 3d | 3 | 0.61mi |
| 613 44th Ave N Saint Petersburg, FL | 2.0 | 1.0 | 1124 | $2,250 | $2.00 | 4d | 1 | 0.62mi |
| 4651 1st St NE #306 Saint Petersburg, FL | 2.0 | 2.0 | 1120 | $2,900 | $2.59 | 4d | 1 | 0.62mi |
| 120 47th Ave N Saint Petersburg, FL | 1.0–2.0 | 1.0–2.0 | 914 | $1,399 | $1.53 | 3d | 8 | 0.66mi |
| 4681 1st St NE #209 Saint Petersburg, FL | 2.0 | 2.0 | 1120 | $2,250 | $2.01 | 24d | 1 | 0.68mi |
| 547 46th Ave N Saint Petersburg, FL | 2.0 | 1.0 | 837 | $2,000 | $2.39 | 8d | 1 | 0.72mi |
| 3460 Haines Rd N Unit 2 St. Petersburg, FL | 1.0 | 1.0 | 539 | $1,350 | $2.50 | 8d | 1 | 0.74mi |
| 321 24th Ave N Unit 2 St. Petersburg, FL | 1.0 | 1.0 | 560 | $1,495 | $2.67 | 8d | 1 | 0.75mi |
| 135 48th Ave N Unit B St. Petersburg, FL | 1.0 | 1.0 | 800 | $2,495 | $3.12 | 24d | 1 | 0.76mi |
| 363 48th Ave N Saint Petersburg, FL | 1.0 | 1.0 | 750 | $1,900 | $2.53 | 24d | 1 | 0.77mi |
| 780 27th Ave N Saint Petersburg, FL | 2.0 | 1.0 | 775 | $2,000 | $2.58 | 24d | 1 | 0.78mi |
| 310 24th Ave N Unit B2 St. Petersburg, FL | 1.0 | 2.0 | 600 | $1,395 | $2.33 | 18d | 1 | 0.79mi |
| 917 30th Ave N Saint Petersburg, FL | 1.0 | 1.0 | 645 | $1,499 | $2.32 | 3d | 1 | 0.79mi |
| 3651 Haines Rd N Saint Petersburg, FL | 2.0 | 1.0 | 950 | $1,800 | $1.89 | 12d | 1 | 0.80mi |
| 2 23rd Ave N St. Petersburg, FL | 1.0 | 1.0 | 720 | $1,800 | $2.50 | 18d | 1 | 0.83mi |
| 3700 Haines Rd N St Petersburg, FL | 1.0–2.0 | 1.0 | 675 | $1,700 | $2.52 | 15d | 2 | 0.85mi |
| 4880 Locust St NE St Petersburg, FL | 1.0 | 1.0–2.0 | 840 | $1,375 | $1.64 | 24d | 3 | 0.85mi |
| 4880 Locust St NE St Petersburg, FL | 1.0 | 1.5–2.0 | 930 | $1,500 | $1.61 | 4d | 2 | 0.85mi |
| 440 50th Ave N Saint Petersburg, FL | 1.0 | 1.0 | 825 | $2,100 | $2.55 | 24d | 1 | 0.88mi |
| 550 50th Ave N Saint Petersburg, FL | 2.0 | 1.0 | 765 | $1,700 | $2.22 | 8d | 2 | 0.91mi |
| 2758 10th St N Saint Petersburg, FL | 2.0 | 2.0 | 1090 | $3,350 | $3.07 | 4d | 1 | 0.92mi |
| 4920 Locust St NE St. Petersburg, FL | 2.0 | 2.0 | 1035 | $1,825 | $1.76 | 24d | 1 | 0.93mi |
| 265 Mateo Way NE St Petersburg, FL | 2.0 | 2.0 | 1055 | $2,700 | $2.56 | 21d | 1 | 0.98mi |
| 124 20th Ave N Saint Petersburg, FL | 2.0 | 1.0 | 826 | $3,200 | $3.87 | 4d | 1 | 1.00mi |
| 925 24th Ave N Unit 1/2 St. Petersburg, FL | 2.0 | 1.0 | 693 | $1,900 | $2.74 | 15d | 1 | 1.04mi |
| 828 22nd Ave N Apt 1/2 St. Petersburg, FL | 1.0 | 1.0 | 550 | $2,000 | $3.64 | 18d | 1 | 1.07mi |
| 4104 1/2 Haines Rd N Unit 1 St. Petersburg, FL | 2.0 | 1.0 | 1000 | $1,850 | $1.85 | 24d | 1 | 1.12mi |
| 5364 4th St N St. Petersburg, FL | 1.0 | 1.0 | 570 | $1,150 | $2.02 | 24d | 1 | 1.12mi |
| 1801 5th St N Unit 2 St. Petersburg, FL | 1.0 | 1.0 | 738 | $1,595 | $2.16 | 24d | 1 | 1.13mi |
| 1725 5th St N Unit 7 St. Petersburg, FL | — | 1.0 | 629 | $1,395 | $2.22 | 24d | 1 | 1.15mi |
| 375 54th Ter N St. Petersburg, FL | 1.0–2.0 | 1.0–2.0 | 966 | $2,375 | $2.46 | 2d | 13 | 1.17mi |
| 3131 16th St N Unit 4 St. Petersburg, FL | 2.0 | 1.0 | 1000 | $1,750 | $1.75 | 11d | 1 | 1.18mi |
Listing history 13 events
-
2026-06-18days on market $144,000 Active 22 DOM
-
2026-06-17days on market $144,000 Active 21 DOM
-
2026-06-16days on market $144,000 Active 20 DOM
-
2026-06-15days on market $144,000 Active 19 DOM
-
2026-06-13days on market $144,000 Active 17 DOM
-
2026-06-09days on market $144,000 Active 13 DOM
-
2026-06-08days on market $144,000 Active 12 DOM
-
2026-06-07days on market $144,000 Active 11 DOM
-
2026-06-04days on market $144,000 Active 8 DOM
-
2026-06-03days on market $144,000 Active 7 DOM
-
2026-06-01days on market $144,000 Active 5 DOM
-
2026-05-31days on market $144,000 Active 4 DOM
-
2026-05-28$144,000 Active
ⓘ Source: listings_history table (triggers on properties + properties_extension) + one-shot
backfill from property_details.listing_events for pre-trigger history.
Climate risk First Street
- Flood 9/10 Extreme FEMA zone X (shaded) · 99% chance over 30 yrs
- Wildfire 1/10 Low
- Heat 10/10 Extreme 7 d/yr ≥106°F today · 27 d/yr by 30 yrs out
- Wind 10/10 Extreme 99% chance of damaging wind over 30 yrs
- Air quality 3/10 Moderate 2 unhealthy d/yr today · 3 by 30 yrs out
Nearby sold comps map
Loading sold comps map…
Walkable amenities ~0.75 mi
Loading nearby amenities…
Taxation est. · year 1
- Rental income
- $22,494
- − Mortgage interest
- −$8,066
- − Property taxes
- −$2,160
- − Insurance
- −$1,518
- − Repairs & maintenance
- −$1,800
- − Management
- −$1,800
- − Depreciation
- −$4,189
- Taxable income
- $2,962
- Est. tax owed @ 24.0%
- −$711
- After-tax cash flow
- $4,320/yr
For passive investors: Depreciation is non-cash, so a rental often shows a tax loss while cash-flowing — sheltering income. Rental losses are passive: they offset passive income freely, and up to $25,000/yr can offset ordinary (W-2) income if you actively participate and your MAGI is under $100k (phasing out to $0 by $150k); unused losses carry forward. On sale, claimed depreciation is recaptured at up to 25%, and gains may owe capital-gains tax (a 1031 exchange can defer both). Figures are a year-1 estimate at your 24.0% rate — not tax advice; consult a CPA.
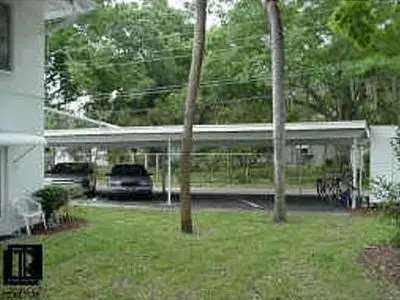
Condition & rehab AI · 1 photo
This property requires extensive repairs and maintenance, including landscaping and interior cleaning, to improve its condition and value.
Repairs flagged
- Major Landscaping — Overgrown lawn and debris
- Major Exterior cleaning — Overgrown lawn and debris
- Major Interior cleaning — Overgrown lawn and debris
Value-add opportunities
- Both Landscaping and exterior cleaning — Improves curb appeal and overall property condition
- Both Interior cleaning — Enhances the home's appearance and can attract more buyers/renters
Renovation cost estimate screening
| Repair item | Severity | Est. cost |
|---|---|---|
| Landscaping · Overgrown lawn and debris | Major | $15,000–50,000 |
| Exterior cleaning · Overgrown lawn and debris | Major | $15,000–50,000 |
| Interior cleaning · Overgrown lawn and debris | Major | $15,000–50,000 |
| Total estimated repair cost · 3 items | $45,000–150,000 |
Value-add ROI direction
- Both Landscaping and exterior cleaning — Improves curb appeal and overall property condition ↑
- Both Interior cleaning — Enhances the home's appearance and can attract more buyers/renters ↑
ⓘ Cost ranges are severity-bucket heuristics (US national rule-of-thumb). Get contractor quotes + a written scope before underwriting a rehab budget.
Schools (NCES district)
- District
- Pinellas
- NCES district ID
- 1201560
- Math proficiency
- 51% ▼ -5.00%
- Reading proficiency
- 51% ▼ -3.00%
- Median HH income
- $46,270
- Composite
- 43.27/100
- National rank
- #3046
- State rank
- #31 of 73 in FL
Livability — St. Petersburg
No livability data for this city. (Only ~50 U.S. cities are tracked.)
Census & demographics
- Census place
- St. Petersburg, FL
- County
- Pinellas County · 939,478 people
- City population
- 249,151
- Metro
- Tampa-St. Petersburg-Clearwater, FL
- Population (ZIP)
- 16,232
- Household income
- $107,889
- Rent vs Own
- Severe rent burden
- 632.0
Population outlook (Pinellas County) Hauer SSP2
- Today (2025)
- 1,027,532 people
- By 2030
- 1,063,586 · +3.5%
- By 2040
- 1,125,020 · +9.5%
- By 2050
- 1,168,637 · +13.7%
- By 2075
- 1,265,188 · +23.1%
- By 2100
- 1,260,357 · +22.7%
Race, ethnicity, and origin ACS 2023
- Neighborhood character
- Predominantly White (83%)
- Race & ethnicity
- White 83% Two or more races 8% Hispanic / Latino 7% Black 4% Asian 2%
- Hispanic origin (detail)
- Mexican 1% Puerto Rican 1% Cuban 1%
- Common ancestry
- Lithuanian 4% Slovak 4% Romanian 4%
- Foreign-born
- 9% · Canada, Jamaica, Vietnam
- Languages at home
- 92% English-only · Spanish 3% German/W. Germanic 1% French/Haitian/Cajun 1%
Political lean MEDSL · Pinellas
- 2024 margin
- Lean R (+5.2) · D 46.9% · R 52.1%
- 2008→2024 swing
- -13.5pp toward R · 2008: 8.3pp · 2024: -5.2pp
- All cycles
- 2024: R+5.2 2020: D+0.2 2016: R+1.1 2012: D+5.6 2008: D+8.3
Not yet ingested
- Civics
- —
Market trends
- HPI YoY
- ▼ -822.13%
- Current HPI
- 473.0888
- Rent YoY
- ▲ 3.43%
- Metro
- Tampa-St. Petersburg-Clearwater, FL
- State GDP YoY
- ▲ 3.28%
- F500 in state
- 36
Industry mix (Fortune 500 HQ in FL)
| Industry | F500 HQs | Revenue |
|---|---|---|
| Industrial Technology | 2 | $29B |
|
||
| Insurance | 2 | $17B |
|
||
| Retail | 1 | $60B |
|
||
| Technology Distribution | 1 | $58B |
|
||
| Homebuilding | 1 | $35B |
|
||
| Technology Manufacturing | 1 | $35B |
|
||
Price history
1 event — show timeline
- 2026-05-28 Listed $144,000 FSBO.com
Cash-flow waterfall
monthlySold comps — $/sqft
last 12 mo · ≤1 miLoading sold comps…