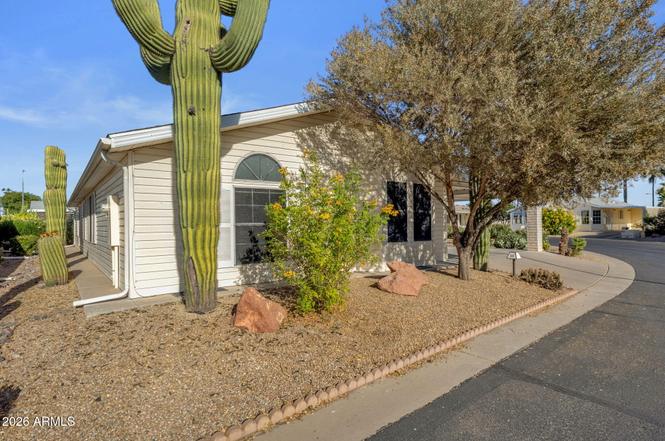
2550 S Ellsworth Rd #68 · Mesa, AZ
Flood risk 1/10 · Minimal
- FEMA flood zone
- X (shaded)
- Chance of flooding over 30 yrs
- 0.0%
- Est. flood insurance / yr
- $507 – $1,088
Fire risk 4/10 · Minor
- Est. fire insurance / yr
- $610 – $1,132
Heat risk 9/10 · Severe
- Hot days now (above 111°F)
- 7 days/yr
- Hot days in 30 yrs
- 18 days/yr
Wind risk 1/10 · Minimal
- Chance of severe wind over 30 yrs
- —
Air-quality risk 3/10 · Minor
- Unhealthy air days now
- 2 days/yr
- Unhealthy air days in 30 yrs
- 3 days/yr
Risk factors via First Street. Map © Google.
Why this score? — see what drove the B- grade
The composite is a weighted blend of 9 inputs, each scored 0–100. Each bar is that input's sub-score; the figure is the points it added to the 100-point composite (weight × sub-score).
- Cash flow +20.2/30.0
- ARV discount +15.0/15.0
- DSCR +6.4/10.0
- Appreciation +5.7/10.0
- 1% rule +5.4/10.0
- Schools +4.6/10.0
- Livability +4.0/5.0
- Condition / age +4.0/5.0
- Rent growth +2.6/5.0
$199,900
🖨 Deal sheet 📄 Offer letter ✓ Due diligence
Listing remarks
Start your mornings in a quiet, resort-style community and end your day in comfort; welcome to Las Palmas Grand! Located on a premium corner lot in this highly desirable 24-hr guard-gated community, this beautifully maintained home offers the perfect blend of space and easy living. The split floor plan features 2 bedrooms, 2 baths, and a versatile den; ideal for a home office, hobby space, or guests. The spacious primary includes an updated ensuite with a tiled, handicap-accessible shower & double vanity. Enjoy your morning coffee or evening unwind in the Arizona room with its own AC. Rare oversized laundry room w/ built-in cabinetry & utility sink. Complete with a covered 2-car
Key facts
- Premium corner lot
- Arizona room
- Updated ensuite
Tags
Property features AI
Finance
- Other: Directions: Enter main gates on Ellsworth; guard will let you in. First two rights and the home is on the left.
- Financial info: Monthly land lease payment
- HOA & community: Community with pool, spa (heated), golf, pickleball, tennis courts, fitness center, community media room, biking/walking paths; Association enforces no visible truck/trailer/RV/boat; Association dues billed annually; includes sewer, grounds maintenance, trash, and water; Land lease in place with a monthly land lease payment
Exterior
- Parking: 2 covered parking spaces; Direct access parking; 2 carport spaces
- Security: Guarded entry
- Utilities: City water; Public sewer
- Home design: Manufactured / Mobile home; Leasehold ownership
- Construction: Vinyl siding; Aluminum siding; Steel frame construction; Composition roof; Building area reported by owner
- Exterior features: Screened-in patio(s); Exterior storage; Corner lot; Desert front landscaping; Desert back landscaping; No fencing
Interior
- Kitchen: Built-in microwave; Reverse osmosis water filtration; Refrigerator; Dishwasher; Garbage disposal; Pantry; Eat-in kitchen
- Bedrooms: Up to 3 bedrooms
- Flooring: Carpet; Vinyl
- Bathrooms: 2 full bathrooms
- Heating & cooling: Electric heating; Central air; Ceiling fans; Mini-split cooling
- Interior features: High-speed internet; Double vanity; Eat-in kitchen; No interior steps; Vaulted ceilings; Pantry; 3/4 bath in master bedroom; Bath roll-in shower; Bath grab bars
- Laundry & utility: Laundry inside
Neighborhood map
What this means for you Summary
Snapshot
- This is a 2-bed/2.0-bath manufactured listed at $200k. Condition is rated good.
Deal economics
- At list price, monthly cash flow is $254 ($3k/yr) — positive.
- The deal already cash-flows at list — no discount required.
- Meets the 1% rule at list price ($2k rent vs $200k).
- Cap rate 7.8% vs local median 3.4% in Mesa — top-decile yield for the area; either an underpriced asset or a hidden risk that comps aren't pricing in. Stress-test before assuming the spread holds.
Location & tenants
- Location reads 79/100 on livability (#6 in AZ, #2,034 nationally) — a middle-class / working-renter tenant base. Strengths: amenities A+, commute A+, housing A+; Watch: health & safety C-, crime D.
- Gilbert Unified District (4239) (suburban): math 49% / reading 52% proficiency, ranked #38 of 249 in AZ (top 15%) — acceptable for families but not a draw, mixed tenant base, ~2y average lease; only 14% free/reduced lunch — higher-income household profile.
- Market conditions: Rents flat; 165 active listings in the ZIP; 40 comparable units currently listed for rent nearby; rentals at typical pace (median 20d on market — plan ~3-4 weeks tenant-placement turnaround); solid renter incomes; 36,011 units permitted in Maricopa County in 2024 (12,801 in 5+ unit buildings).
Forward outlook
- In year one you build about $4k of equity ($1k loan paydown + $3k appreciation (1.4% local appreciation)).
- Maricopa County population projected at +38% by 2050 — long-run rental-demand tailwind backs the buy-and-hold thesis.
- At projected returns (1.4% appreciation + 0.5% rent growth), your $56k cash investment doubles in ~8 years — after that, you're playing with house money.
- By year 8, paydown + projected appreciation supports a ~$33k cash-out refi (75% LTV) — recoverable capital for the next deal without selling this one.
Negotiation context
- Only 1 days on market — expect competitive offers; lowballing is unlikely to land.
Risks & watch-outs
- Climate carrying-cost: extreme-heat days projected 7→18/yr by 2055 (HVAC capex compounding) — expect insurance premiums to compound above CPI over the hold.
Questions for the listing agent
- Is there a deadline driving the sale (1031 exchange, divorce, estate, relocation)? That informs how much negotiation room exists.
- Crime grade is D in this area — have there been break-ins, vandalism, or insurance claims at this property in the last 3 years? What carrier currently insures it and at what premium?
- What's the average days-on-market for RENTAL listings here right now (not sales)? A rising rental-DOM trend means longer vacancies and softer asking-rent achievability than the comps imply.
- What's the recent tenant-quality profile in this submarket — average credit score on applications, eviction rate, late-payment / NSF rate, and stable-employment percentage? A property-management company in the area should have these aggregated.
- How much new for-sale + rental construction is in the pipeline within 1–3 miles? Heavy new supply typically softens prices + rents 12–24 months out; constrained supply supports both.
Investment metrics
- 1% rule
- 1.04% ✓
- Cap rate
- 7.82%
- Cash-on-cash
- 5.44%
- DSCR
- 1.24
- GRM
- 8.0
CMA / ARV
- ARV (on-the-fly)
- $247,838
- Comps found
- 12
Show comp detail 12 sales within ~0.75 mi
| Address | Dist | Beds/Ba | Sqft | Sold | Price | $/sf | Match |
|---|---|---|---|---|---|---|---|
| 2550 S Ellsworth Rd #41 | 0.23mi | 2/2.0 | 1,493 (0%) | 19mo | $221,675 | $148 | 73 |
| 2206 S Ellsworth Rd Unit 160B | 0.29mi | 3/2.0 (+1) | 1,456 (-2%) | 9mo | $345,000 | $237 | 70 |
| 2550 S Ellsworth Rd #664 | 0.38mi | 2/2.0 | 1,493 (0%) | 15mo | $190,000 | $127 | 70 |
| 2550 S Ellsworth Rd #343 | 0.23mi | 2/2.0 | 1,456 (-2%) | 19mo | $150,000 | $103 | 70 |
| 2206 S Ellsworth Rd Unit 50B | 0.28mi | 3/2.0 (+1) | 1,404 (-6%) | 7mo | $238,000 | $170 | 66 |
| 8865 E Baseline Rd #554 | 0.32mi | 3/2.0 (+1) | 1,447 (-3%) | 14mo | $285,000 | $197 | 63 |
| 2206 S Ellsworth Rd Unit 14 B | 0.28mi | 2/2.0 | 1,354 (-9%) | 15mo | $129,000 | $95 | 59 |
| 8865 E Baseline Rd #128 | 0.43mi | 3/2.0 (+1) | 1,404 (-6%) | 9mo | $240,000 | $171 | 58 |
| 8865 E Baseline Rd #138 | 0.32mi | 3/2.0 (+1) | 1,352 (-9%) | 16mo | $225,000 | $166 | 51 |
| 2550 S Ellsworth Rd #364 | 0.38mi | 3/2.0 (+1) | 1,390 (-7%) | 19mo | $190,000 | $137 | 50 |
| 8865 E Baseline Rd #510 | 0.32mi | 2/2.0 | 1,316 (-12%) | 19mo | $160,000 | $122 | 49 |
| 8865 E Baseline Rd #729 | 0.37mi | 3/2.0 (+1) | 1,357 (-9%) | 20mo | $300,000 | $221 | 46 |
Match score weights: distance 35% · size 25% · config 20% · recency 20%. Top-matched comps best support the ARV.
Projected returns pro-forma
1.44% appreciation · 0.54% rent growth · sell at horizon
- IRR
- 6.7%
- Equity multiple
- 1.34×
- Total profit
- $19,267
- Equity at exit
- $72,860
- IRR
- 9.0%
- Equity multiple
- 2.09×
- Total profit
- $61,161
- Equity at exit
- $100,502
Cash invested: $55,972 (down + closing). Projections, not guarantees.
Landlord ↔ Tenant lean methodology
- Overall (STATE)
- 87 Strongly Landlord-Friendly
- State Arizona
- 87 Strongly Landlord-Friendly · R+3
- County
- — inherits STATE
- City
- — inherits STATE
ZIP-level market 85209
- Home prices YoY
- 0.5%
- Rents YoY
- 0.5%
- Active inventory
- 165
- Price-to-rent
- 8.0×
Monthly cashflow live
- Estimated rent
- $2,070 high interval (Pro) →
- Mortgage (P&I)
- −$1,048
- Tax est. 1.5%
- −$250 /mo · $2,998/yr
- Insurance
- −$83
- HOA
- −$0
- Vacancy / Maint / Mgmt
- −$435
- Net cashflow
- $254
Break-even live
UW: 25.0% down · 7.5% · 30yr · 1.5% tax · 5.0% vac · 8.0% maint · 8.0% mgmt
Financing live
Cash to close
- Down payment
- $49,975
- Closing costs
- $5,997
- Reserves months
- —
- Total cash needed
- —
Loan-product check · same deal, 3 products live
Conventional
25% down · 7.5% · 30yr
- Down + closing
- —
- Monthly P&I
- —
- Monthly cashflow
- —
- DSCR
- —
- Eligible?
- —
Personal DTI + credit; lowest rate.
DSCR
20% down · 8.5% · 30yr
- Down + closing
- —
- Monthly P&I
- —
- Monthly cashflow
- —
- DSCR
- —
- Eligible?
- —
No personal income docs; deal must DSCR.
Hard money
10% down · 12.0% · 12mo
- Down + closing
- —
- Monthly P&I
- —
- Monthly cashflow
- —
- DSCR
- —
- Eligible?
- —
Short-term bridge; refi at stabilization.
Rent comps 40 comps
| Address | Beds | Baths | Sqft | Rent | $/sqft | DOM | Units | Dist |
|---|---|---|---|---|---|---|---|---|
| 2206 S Ellsworth Rd Unit 3B Mesa, AZ | 2.0 | 2.0 | 976 | $1,606 | $1.65 | 14d | 1 | 0.28mi |
| 2206 S Ellsworth Rd Unit 101B Mesa, AZ | 2.0 | 2.0 | 924 | $1,555 | $1.68 | 43d | 1 | 0.28mi |
| 2206 S Ellsworth Rd Unit 94B Mesa, AZ | 2.0 | 2.0 | 924 | $3,702 | $4.01 | 24d | 1 | 0.28mi |
| 9233 E Neville Ave Mesa, AZ | 2.0–3.0 | 2.0 | 1145 | $1,575 | $1.37 | 24d | 1 | 0.37mi |
| 9233 E Neville Ave Mesa, AZ | 2.0–3.0 | 2.0 | 1142 | $1,575 | $1.38 | 14d | 3 | 0.37mi |
| 2223 S Gordon Mesa, AZ | 3.0 | 2.0 | 1278 | $2,250 | $1.76 | 24d | 1 | 0.40mi |
| 9322 E Lobo Ave Mesa, AZ | 3.0 | 2.0 | 1691 | $2,200 | $1.30 | 21d | 1 | 0.42mi |
| 9233 E Neville Ave #1088 Mesa, AZ | 3.0 | 2.0 | 1057 | $1,850 | $1.75 | 5d | 1 | 0.44mi |
| 9231 E Lindner Ave Mesa, AZ | 3.0 | 2.0 | 1572 | $2,295 | $1.46 | 5d | 1 | 0.45mi |
| 8865 E Baseline Rd #1028 Mesa, AZ | 2.0 | 1.0 | 1028 | $1,500 | $1.46 | 43d | 1 | 0.46mi |
| 8865 E Baseline Rd #555 Mesa, AZ | 3.0 | 2.0 | 1387 | $3,900 | $2.81 | 24d | 1 | 0.46mi |
| 8865 E Baseline Rd #555 Mesa, AZ | 3.0 | 2.0 | 1387 | $3,900 | $2.81 | 19d | 1 | 0.46mi |
| 2821 S Skyline #157 Mesa, AZ | 2.0 | 2.5 | 1438 | $2,200 | $1.53 | 3d | 1 | 0.48mi |
| 8915 E Guadalupe Rd Mesa, AZ | 2.0–3.0 | 2.0 | 971 | $1,390 | $1.43 | 2d | 11 | 0.55mi |
| 8915 E Guadalupe Rd Mesa, AZ | 2.0 | 2.0 | 1054 | $1,390 | $1.32 | 24d | 1 | 0.55mi |
| 2821 S Skyline #127 Mesa, AZ | 2.0 | 2.5 | 1438 | $2,350 | $1.63 | 43d | 1 | 0.56mi |
| 8528 E Desert Ln Mesa, AZ | 3.0 | 2.0 | 1665 | $2,280 | $1.37 | 5d | 1 | 0.64mi |
| 8720 E Knowles Ave Mesa, AZ | 3.0 | 2.0 | 1692 | $1,995 | $1.18 | 2d | 1 | 0.65mi |
| 9335 E Baseline Rd Mesa, AZ | 1.0–3.0 | 1.0–2.0 | 1162 | $1,717 | $1.48 | 1d | 14 | 0.66mi |
| 8918 E Oro Cir Mesa, AZ | 3.0 | 2.5 | 1566 | $2,100 | $1.34 | 16d | 1 | 0.67mi |
| 8918 E Oro Cir Mesa, AZ | 3.0 | 2.5 | 1566 | $2,180 | $1.39 | 43d | 1 | 0.67mi |
| 8928 E Pampa Ave Mesa, AZ | 3.0 | 2.5 | 1723 | $10,500 | $6.09 | 24d | 1 | 0.78mi |
| 8915 E Pampa Ave Mesa, AZ | 3.0 | 2.5 | 1700 | $1,900 | $1.12 | 43d | 1 | 0.80mi |
| 8527 E Osage Ave Mesa, AZ | 3.0 | 2.5 | 1871 | $2,200 | $1.18 | 43d | 1 | 0.81mi |
| 8843 E Pampa Ave Mesa, AZ | 3.0 | 2.0 | 1357 | $2,050 | $1.51 | 4d | 1 | 0.81mi |
| 2024 S Baldwin #40 Mesa, AZ | 3.0 | 2.5 | 1384 | $1,800 | $1.30 | 24d | 1 | 0.84mi |
| 3121 S Mandy Mesa, AZ | 3.0 | 2.0 | 1357 | $2,190 | $1.61 | 3d | 1 | 0.85mi |
| 8438 E Keats Ave Mesa, AZ | 3.0 | 2.0 | 1363 | $2,300 | $1.69 | 24d | 1 | 0.85mi |
| 2024 S Baldwin #154 Mesa, AZ | 2.0 | 2.5 | 1132 | $1,689 | $1.49 | 5d | 1 | 0.86mi |
| 2024 S Baldwin #154 Mesa, AZ | 2.0 | 2.5 | 1200 | $1,689 | $1.41 | 16d | 1 | 0.86mi |
| 8852 E Plana Ave Mesa, AZ | 3.0 | 2.0 | 1357 | $1,995 | $1.47 | 43d | 1 | 0.87mi |
| 8433 E Guadalupe Rd Mesa, AZ | 1.0–3.0 | 1.0–2.0 | 936 | $2,772 | $2.96 | 1d | 1 | 0.89mi |
| 2024 S Baldwin #114 Mesa, AZ | 2.0 | 2.5 | 1148 | $1,700 | $1.48 | 11d | 1 | 0.91mi |
| 2024 S Baldwin #114 Mesa, AZ | 2.0 | 2.5 | 1148 | $1,700 | $1.48 | 24d | 1 | 0.91mi |
| 8616 E Posada Ave Mesa, AZ | 3.0 | 2.5 | 1792 | $2,309 | $1.29 | 10d | 1 | 0.95mi |
| 8616 E Posada Ave Mesa, AZ | 3.0 | 2.5 | 1792 | $2,289 | $1.28 | 3d | 1 | 0.95mi |
| 8462 E Pampa Ave Mesa, AZ | 3.0 | 2.5 | 1473 | $1,995 | $1.35 | 43d | 1 | 1.01mi |
| 8240 E Obispo Ave Mesa, AZ | 3.0 | 2.0 | 1655 | $2,200 | $1.33 | 18d | 1 | 1.10mi |
| 2031 S Alicia Mesa, AZ | 3.0 | 2.0 | 1524 | $2,009 | $1.32 | 14d | 1 | 1.15mi |
| 2031 S Alicia Mesa, AZ | 3.0 | 2.0 | 1524 | $2,109 | $1.38 | 43d | 1 | 1.15mi |
Listing history 2 events
-
2026-06-18remarks 691-char remark
-
2026-06-18$199,900 Active 1 DOM
ⓘ Source: listings_history table (triggers on properties + properties_extension) + one-shot
backfill from property_details.listing_events for pre-trigger history.
Climate risk First Street
- Flood 1/10 Low FEMA zone X (shaded) · 0% chance over 30 yrs
- Wildfire 4/10 Moderate
- Heat 9/10 Extreme 7 d/yr ≥111°F today · 18 d/yr by 30 yrs out
- Wind 1/10 Low
- Air quality 3/10 Moderate 2 unhealthy d/yr today · 3 by 30 yrs out
Nearby sold comps map
Loading sold comps map…
Walkable amenities ~0.75 mi
Loading nearby amenities…
Taxation est. · year 1
- Rental income
- $24,838
- − Mortgage interest
- −$11,198
- − Property taxes
- −$2,998
- − Insurance
- −$1,000
- − Repairs & maintenance
- −$1,987
- − Management
- −$1,987
- − Depreciation
- −$5,815
- Taxable loss
- −$147
- Est. tax savings @ 24.0%
- +$35
- After-tax cash flow
- $3,080/yr
For passive investors: Depreciation is non-cash, so a rental often shows a tax loss while cash-flowing — sheltering income. Rental losses are passive: they offset passive income freely, and up to $25,000/yr can offset ordinary (W-2) income if you actively participate and your MAGI is under $100k (phasing out to $0 by $150k); unused losses carry forward. On sale, claimed depreciation is recaptured at up to 25%, and gains may owe capital-gains tax (a 1031 exchange can defer both). Figures are a year-1 estimate at your 24.0% rate — not tax advice; consult a CPA.
Condition & rehab AI · 12 photos
This well-maintained mobile home in a desirable community offers a good investment opportunity with minimal repairs needed.
Value-add opportunities
- Both Paint exterior siding — Enhances curb appeal and value
- Both Replace carpet with tile in living areas — Easier to clean and maintain
- Both Install smart home automation — Improves energy efficiency and convenience
Renovation cost estimate screening
Value-add ROI direction
- Both Paint exterior siding — Enhances curb appeal and value ↑
- Both Replace carpet with tile in living areas — Easier to clean and maintain ↑
- Both Install smart home automation — Improves energy efficiency and convenience ↑
ⓘ Cost ranges are severity-bucket heuristics (US national rule-of-thumb). Get contractor quotes + a written scope before underwriting a rehab budget.
Schools (NCES district)
- District
- Gilbert Unified District (4239)
- NCES district ID
- 0403400
- Math proficiency
- 49% ▼ -8.00%
- Reading proficiency
- 52% ▼ -7.00%
- Median HH income
- $74,715
- Composite
- 45.55/100
- National rank
- #2600
- State rank
- #38 of 249 in AZ
Livability — Mesa
- Score
- 79/100
- State rank
- #6
- US rank
- #2034
Category grades
Schools grade is shown separately in the Schools card above.
Census & demographics
- Census place
- Mesa, AZ
- County
- Maricopa County · 4,537,380 people
- City population
- 555,266
- Metro
- Phoenix-Mesa-Chandler, AZ
- Population (ZIP)
- 43,150
- Household income
- $84,432
- Rent vs Own
- Severe rent burden
- 972.0
Population outlook (Maricopa County) Hauer SSP2
- Today (2025)
- 4,979,203 people
- By 2030
- 5,378,229 · +8.0%
- By 2040
- 6,156,598 · +23.6%
- By 2050
- 6,872,376 · +38.0%
- By 2075
- 8,401,270 · +68.7%
- By 2100
- 9,247,439 · +85.7%
Race, ethnicity, and origin ACS 2023
- Neighborhood character
- Predominantly White (72%)
- Race & ethnicity
- White 72% Hispanic / Latino 15% Two or more races 9% Black 4% Asian 3%
- Hispanic origin (detail)
- Mexican 11%
- Common ancestry
- Portuguese 4% Romanian 3% Lithuanian 3%
- Foreign-born
- 9% · Canada, China, Vietnam
- Languages at home
- 87% English-only · Spanish 9% Tagalog/Filipino 1% Chinese 1%
Political lean MEDSL · Maricopa
- 2024 margin
- Toss-up / Even · D 47.7% · R 51.2% · Other 1.1%
- 2008→2024 swing
- +7.1pp toward D · 2008: -10.6pp · 2024: -3.5pp
- All cycles
- 2024: R+3.5 2020: D+2.2 2016: R+3.5 2012: R+12.0 2008: R+10.6
Not yet ingested
- Civics
- —
Market trends
- HPI YoY
- ▲ 1.44%
- Current HPI
- 277.6198
- Rent YoY
- ▲ 0.54%
- Metro
- Phoenix-Mesa-Chandler, AZ
- State GDP YoY
- ▲ 4.54%
- F500 in state
- 20
Industry mix (Fortune 500 HQ in AZ)
| Industry | F500 HQs | Revenue |
|---|---|---|
| Technology | 2 | $13B |
|
||
| Mining / Metals | 1 | $23B |
|
||
| Environmental Services | 1 | $16B |
|
||
| Metals / Steel | 1 | $14B |
|
||
| Technology Distribution | 1 | $9B |
|
||
| Homebuilding | 1 | $8B |
|
||
Price history
1 event — show timeline
- 2026-06-18 Listed $199,900 ARMLS
Cash-flow waterfall
monthlySold comps — $/sqft
last 12 mo · ≤1 miLoading sold comps…