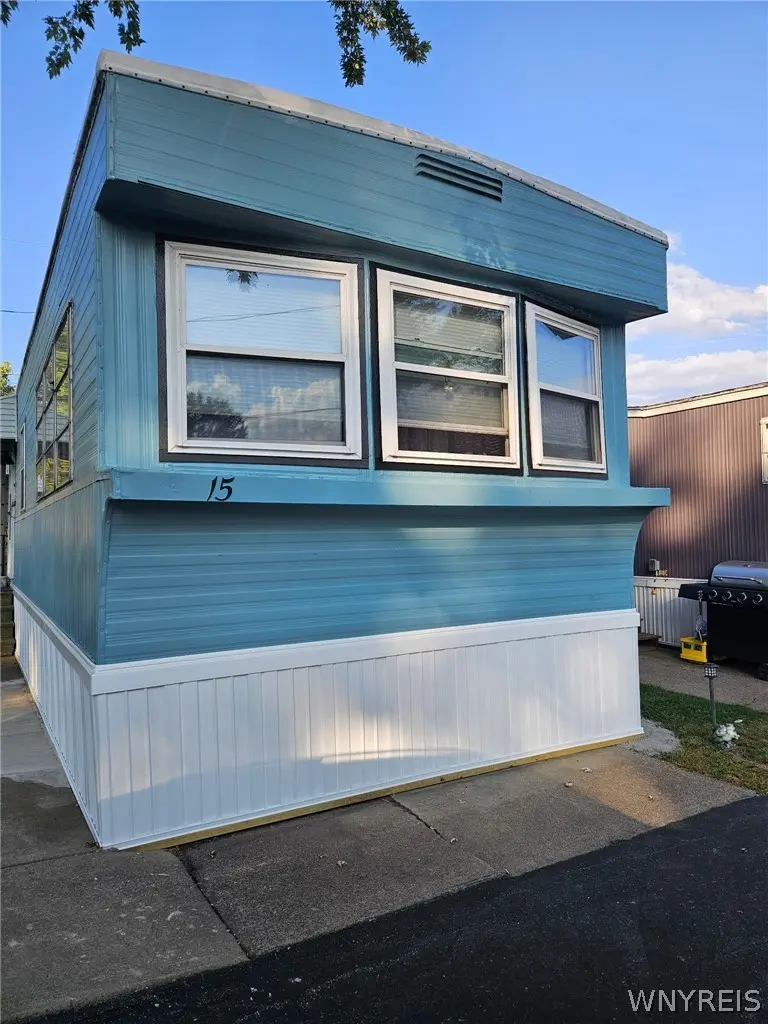
2080 River Rd #15 · Niagara Falls, NY
Flood risk 1/10 · Minimal
- FEMA flood zone
- X (unshaded)
- Chance of flooding over 30 yrs
- 0.0%
- Est. flood insurance / yr
- $507 – $1,088
Fire risk 1/10 · Minimal
- Est. fire insurance / yr
- $691 – $1,283
Heat risk 2/10 · Minimal
- Hot days now (above 94°F)
- 7 days/yr
- Hot days in 30 yrs
- 14 days/yr
Wind risk 1/10 · Minimal
- Chance of severe wind over 30 yrs
- —
Air-quality risk 3/10 · Minor
- Unhealthy air days now
- 2 days/yr
- Unhealthy air days in 30 yrs
- 4 days/yr
Risk factors via First Street. Map © Google.
Why this score? — see what drove the B grade
The composite is a weighted blend of 9 inputs, each scored 0–100. Each bar is that input's sub-score; the figure is the points it added to the 100-point composite (weight × sub-score).
- Cash flow +30.0/30.0
- 1% rule +10.0/10.0
- DSCR +10.0/10.0
- ARV discount +7.5/15.0
- Schools +5.8/10.0
- Condition / age +3.8/5.0
- Livability +3.0/5.0
- Rent growth +2.5/5.0
- Appreciation +0.0/10.0
$44,900
🖨 Deal sheet 📄 Offer letter ✓ Due diligence
Listing remarks
Beautifully updated and move-in ready ranch style home. Main floor laundry includes a stackable washer and dryer. Primary bedroom has a half bath off it. Living room space can be made back into a second bedroom. New windows in living room and back bedroom. Minutes away to all conveniences and shopping. Must apply to and must be approved at Lynch Park Associates.
Key facts
- Built 1975
- Listed 49 days
Property features AI
Finance
- HOA & community: Association fee paid monthly; Land lease: $465
Exterior
- Parking: No garage
- Utilities: Cable available; Public water (connected); Sewer connected
- Home design: Single-wide mobile home (New Yorker); One story; Resale
- Construction: Aluminum siding
- Exterior features: Shed(s) and storage; See remarks for additional exterior details; Near public transit; Rectangular lot
Interior
- Kitchen: Gas oven; Gas range; Refrigerator
- Bedrooms: One main-level bedroom
- Flooring: Laminate; Varied flooring
- Bathrooms: One full bathroom; One half bathroom; Two main-level bathrooms
- Heating & cooling: Gas heating; Wall cooling units
- Interior features: Eat-in kitchen; Kitchen/family room combo; Bedroom on main level
- Laundry & utility: Washer; Dryer; Gas water heater
Neighborhood map
What this means for you Summary
Snapshot
- This is a 1-bed/1.5-bath manufactured listed at $45k. Condition is rated good.
Deal economics
- At list price, monthly cash flow is $502 ($6k/yr) — positive.
- The deal already cash-flows at list — no discount required.
- Meets the 1% rule at list price ($1k rent vs $45k).
- Recommended offer: $44k (3.0% below list) — sets the bar for market timing.
- Cap rate 19.7% vs local median 7.7% in Niagara Falls — top-decile yield for the area; either an underpriced asset or a hidden risk that comps aren't pricing in. Stress-test before assuming the spread holds.
Location & tenants
- Location reads 60/100 on livability (#956 in NY) — a middle-class / working-renter tenant base. Strengths: cost of living A+, housing A+; Watch: schools F, crime F, amenities F.
- Niagara-Wheatfield Central School District (rural): math 64% / reading 70% proficiency, ranked #163 of 590 in NY (top 28%) — acceptable for families but not a draw, mixed tenant base, ~2y average lease.
- Market conditions: 142 active listings in the ZIP; 2 comparable units currently listed for rent nearby; 167 units permitted in Niagara County in 2024 (0 in 5+ unit buildings).
Forward outlook
- Local home prices are declining (-3.0%/yr); year-one equity from $310 of loan paydown is wiped out by about $1k of value loss. Plan a longer hold.
- Niagara County population projected at -19% by 2050 — secular population decline; favor cash flow + early exit over multi-decade hold.
- At projected returns (-3.0% appreciation + 3.0% rent growth), your $13k cash investment doubles in ~3 years — after that, you're playing with house money.
Negotiation context
- It's been on market 49 days — a 3% lower offer ($44k) is reasonable based on typical stale-listing flexibility.
Questions for the listing agent
- It's been on market 49 days. Have you received any prior offers? Is the seller open to a 3% concession, seller financing, or rate buy-down credit?
- Built in 1975 — when were the roof, HVAC, electrical panel, plumbing, and water heater last replaced?
- Is there a deadline driving the sale (1031 exchange, divorce, estate, relocation)? That informs how much negotiation room exists.
- Schools are F-rated, which usually means shorter tenancies and higher turnover. Who's the typical renter profile here, and what's been the actual vacancy rate?
- Crime grade is F in this area — have there been break-ins, vandalism, or insurance claims at this property in the last 3 years? What carrier currently insures it and at what premium?
- What's the average days-on-market for RENTAL listings here right now (not sales)? A rising rental-DOM trend means longer vacancies and softer asking-rent achievability than the comps imply.
- What's the recent tenant-quality profile in this submarket — average credit score on applications, eviction rate, late-payment / NSF rate, and stable-employment percentage? A property-management company in the area should have these aggregated.
- How much new for-sale + rental construction is in the pipeline within 1–3 miles? Heavy new supply typically softens prices + rents 12–24 months out; constrained supply supports both.
Investment metrics
- 1% rule
- 2.29% ✓
- Cap rate
- 19.72%
- Cash-on-cash
- 47.95%
- DSCR
- 3.13
- GRM
- 3.6
CMA / ARV
No comps found within radius.
Projected returns pro-forma
-3.0% appreciation · 3.0% rent growth · sell at horizon
- IRR
- 45.4%
- Equity multiple
- 2.97×
- Total profit
- $24,736
- Equity at exit
- $6,695
- IRR
- 51.3%
- Equity multiple
- 6.00×
- Total profit
- $62,803
- Equity at exit
- $3,882
Cash invested: $12,572 (down + closing). Projections, not guarantees.
Landlord ↔ Tenant lean methodology
- Overall (STATE)
- 15 Strongly Tenant-Friendly
- State New York
- 15 Strongly Tenant-Friendly · D+10
- County
- — inherits STATE
- City
- — inherits STATE
ZIP-level market 14304
- Active inventory
- 142
- Price-to-rent
- 3.6×
Monthly cashflow live
- Estimated rent
- $1,029 medium interval (Pro) →
- Mortgage (P&I)
- −$235
- Tax est. 1.5%
- −$56 /mo · $674/yr
- Insurance
- −$19
- HOA
- −$0
- Vacancy / Maint / Mgmt
- −$216
- Net cashflow
- $502
Break-even live
UW: 25.0% down · 7.5% · 30yr · 1.5% tax · 5.0% vac · 8.0% maint · 8.0% mgmt
Financing live
Cash to close
- Down payment
- $11,225
- Closing costs
- $1,347
- Reserves months
- —
- Total cash needed
- —
Loan-product check · same deal, 3 products live
Conventional
25% down · 7.5% · 30yr
- Down + closing
- —
- Monthly P&I
- —
- Monthly cashflow
- —
- DSCR
- —
- Eligible?
- —
Personal DTI + credit; lowest rate.
DSCR
20% down · 8.5% · 30yr
- Down + closing
- —
- Monthly P&I
- —
- Monthly cashflow
- —
- DSCR
- —
- Eligible?
- —
No personal income docs; deal must DSCR.
Hard money
10% down · 12.0% · 12mo
- Down + closing
- —
- Monthly P&I
- —
- Monthly cashflow
- —
- DSCR
- —
- Eligible?
- —
Short-term bridge; refi at stabilization.
Rent comps 2 comps
| Address | Beds | Baths | Sqft | Rent | $/sqft | DOM | Units | Dist |
|---|---|---|---|---|---|---|---|---|
| 51 S 86th St Unit 11B Niagara Falls, NY | 2.0 | 1.0 | 720 | $1,100 | $1.53 | 2d | 1 | 1.30mi |
| 8405 Buffalo Ave Niagara Falls, NY | 2.0 | 1.0 | 706 | $850 | $1.20 | 12d | 1 | 1.49mi |
Listing history 14 events
-
2026-06-18days on market $44,900 Active 49 DOM
-
2026-06-17days on market $44,900 Active 48 DOM
-
2026-06-16days on market $44,900 Active 47 DOM
-
2026-06-15days on market $44,900 Active 46 DOM
-
2026-06-13days on market $44,900 Active 44 DOM
-
2026-06-10days on market $44,900 Active 41 DOM
-
2026-06-09days on market $44,900 Active 40 DOM
-
2026-06-08days on market $44,900 Active 39 DOM
-
2026-06-07days on market $44,900 Active 38 DOM
-
2026-06-03days on market $44,900 Active 34 DOM
-
2026-06-02days on market $44,900 Active 33 DOM
-
2026-06-01days on market $44,900 Active 32 DOM
-
2026-05-31days on market $44,900 Active 31 DOM
-
2026-04-30$44,900 Active 364-char remark
ⓘ Source: listings_history table (triggers on properties + properties_extension) + one-shot
backfill from property_details.listing_events for pre-trigger history.
Climate risk First Street
- Flood 1/10 Low FEMA zone X (unshaded) · 0% chance over 30 yrs
- Wildfire 1/10 Low
- Heat 2/10 Low 7 d/yr ≥94°F today · 14 d/yr by 30 yrs out
- Wind 1/10 Low
- Air quality 3/10 Moderate 2 unhealthy d/yr today · 4 by 30 yrs out
Nearby sold comps map
Loading sold comps map…
Walkable amenities ~0.75 mi
Loading nearby amenities…
Taxation est. · year 1
- Rental income
- $12,344
- − Mortgage interest
- −$2,515
- − Property taxes
- −$674
- − Insurance
- −$224
- − Repairs & maintenance
- −$988
- − Management
- −$988
- − Depreciation
- −$1,306
- Taxable income
- $5,650
- Est. tax owed @ 24.0%
- −$1,356
- After-tax cash flow
- $4,672/yr
For passive investors: Depreciation is non-cash, so a rental often shows a tax loss while cash-flowing — sheltering income. Rental losses are passive: they offset passive income freely, and up to $25,000/yr can offset ordinary (W-2) income if you actively participate and your MAGI is under $100k (phasing out to $0 by $150k); unused losses carry forward. On sale, claimed depreciation is recaptured at up to 25%, and gains may owe capital-gains tax (a 1031 exchange can defer both). Figures are a year-1 estimate at your 24.0% rate — not tax advice; consult a CPA.
Condition & rehab AI · 1 photo
This beautifully updated and move-in ready manufactured home is in good condition with no visible major repairs needed. It offers a good investment opportunity with potential for further value enhancement through cosmetic upgrades.
Value-add opportunities
- Both Painting the exterior and interior — Fresh paint can enhance the curb appeal and interior aesthetics, making the home more attractive to potential buyers and renters.
- Both Landscaping improvements — Well-maintained landscaping can improve the home's curb appeal and add value to the property.
- Resale Upgrading the kitchen appliances — Modern appliances can make the kitchen more appealing to potential buyers and increase the home's resale value.
- Both Upgrading the HVAC system — A new HVAC system can improve comfort and energy efficiency, making the home more attractive to both buyers and renters.
- Both Upgrading the bathrooms with modern fixtures — Modern bathrooms can enhance the home's appeal and increase its value for both buyers and renters.
- Both Adding a small deck or patio — An outdoor living space can increase the home's appeal and add value for both buyers and renters.
- Both Upgrading the flooring in the living room — Modern flooring can enhance the living room's appearance and increase the home's value for both buyers and renters.
- Both Upgrading the windows with energy-efficient ones — Energy-efficient windows can improve comfort and reduce energy costs, making the home more attractive to both buyers and renters.
- Both Upgrading the exterior siding — New siding can enhance the home's curb appeal and increase its value for both buyers and renters.
- Both Upgrading the roof with a new one — A new roof can improve the home's durability and increase its value for both buyers and renters.
Renovation cost estimate screening
Value-add ROI direction
- Both Painting the exterior and interior — Fresh paint can enhance the curb appeal and interior aesthetics, making the home more attractive to potential buyers and renters. ↑
- Both Landscaping improvements — Well-maintained landscaping can improve the home's curb appeal and add value to the property. ↑
- Resale Upgrading the kitchen appliances — Modern appliances can make the kitchen more appealing to potential buyers and increase the home's resale value. ↑
- Both Upgrading the HVAC system — A new HVAC system can improve comfort and energy efficiency, making the home more attractive to both buyers and renters. ↑
- Both Upgrading the bathrooms with modern fixtures — Modern bathrooms can enhance the home's appeal and increase its value for both buyers and renters. ↑
- Both Adding a small deck or patio — An outdoor living space can increase the home's appeal and add value for both buyers and renters. ↑
- Both Upgrading the flooring in the living room — Modern flooring can enhance the living room's appearance and increase the home's value for both buyers and renters. ↑
- Both Upgrading the windows with energy-efficient ones — Energy-efficient windows can improve comfort and reduce energy costs, making the home more attractive to both buyers and renters. ↑
- Both Upgrading the exterior siding — New siding can enhance the home's curb appeal and increase its value for both buyers and renters. ↑
- Both Upgrading the roof with a new one — A new roof can improve the home's durability and increase its value for both buyers and renters. ↑
ⓘ Cost ranges are severity-bucket heuristics (US national rule-of-thumb). Get contractor quotes + a written scope before underwriting a rehab budget.
Schools (NCES district)
- District
- Niagara-Wheatfield Central School District
- NCES district ID
- 3620850
- Math proficiency
- 64% ▼ -1.00%
- Reading proficiency
- 70% ▲ 10.00%
- Median HH income
- $57,051
- Composite
- 57.53/100
- National rank
- #1067
- State rank
- #163 of 590 in NY
Livability — Niagara Falls
- Score
- 60/100
- State rank
- #956
- US rank
- #18749
Category grades
Schools grade is shown separately in the Schools card above.
Census & demographics
- County
- Niagara County · 157,377 people
- City population
- 62,983
- Metro
- Buffalo-Cheektowaga, NY
- Population (ZIP)
- 29,208
- Household income
- $66,660
- Rent vs Own
- Severe rent burden
- 698.0
Population outlook (Niagara County) Hauer SSP2
- Today (2025)
- 204,149 people
- By 2030
- 197,900 · -3.1%
- By 2040
- 182,239 · -10.7%
- By 2050
- 165,198 · -19.1%
- By 2075
- 129,416 · -36.6%
- By 2100
- 96,222 · -52.9%
Race, ethnicity, and origin ACS 2023
- Neighborhood character
- Predominantly White (85%)
- Race & ethnicity
- White 85% Two or more races 6% Hispanic / Latino 4% Black 3% Asian 2%
- Common ancestry
- Romanian 10% Lithuanian 3% Slovak 2%
- Foreign-born
- 3% · Canada, China, Vietnam
- Languages at home
- 93% English-only · Spanish 3% Other Indo-European 1% Russian/Polish/Slavic 1%
Political lean MEDSL · Niagara
- 2024 margin
- R (+14.9) · D 42.5% · R 57.5%
- 2008→2024 swing
- -15.9pp toward R · 2008: 1.0pp · 2024: -14.9pp
- All cycles
- 2024: R+14.9 2020: R+9.7 2016: R+19.0 2012: D+0.6 2008: D+1.0
Not yet ingested
- Civics
- —
Market trends
- HPI YoY
- ▼ -231.77%
- Current HPI
- 280.3295
- Rent YoY
- —
- Metro
- Buffalo-Cheektowaga, NY
- State GDP YoY
- ▲ 2.60%
- F500 in state
- 92
Industry mix (Fortune 500 HQ in NY)
| Industry | F500 HQs | Revenue |
|---|---|---|
| Financial Services | 10 | $950B |
|
||
| Consumer Goods | 9 | $162B |
|
||
| Insurance | 4 | $225B |
|
||
| Telecommunications | 2 | $144B |
|
||
| Pharmaceuticals | 2 | $112B |
|
||
| Media / Entertainment | 2 | $69B |
|
||
Price history
1 event — show timeline
- 2026-04-30 Listed $44,900 WNYREIS
Cash-flow waterfall
monthlySold comps — $/sqft
last 12 mo · ≤1 miLoading sold comps…