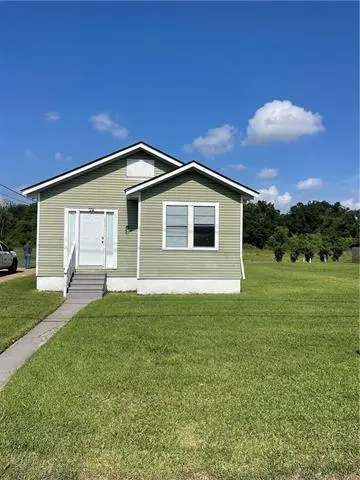
258 Central Ave · Reserve, LA
Flood risk 4/10 · Minor
- FEMA flood zone
- X (shaded)
- Chance of flooding over 30 yrs
- 0.22%
- Est. flood insurance / yr
- $507 – $1,088
Fire risk 1/10 · Minimal
- Est. fire insurance / yr
- $1,269 – $2,357
Heat risk 9/10 · Severe
- Hot days now (above 108°F)
- 7 days/yr
- Hot days in 30 yrs
- 21 days/yr
Wind risk 9/10 · Severe
- Chance of severe wind over 30 yrs
- 99.0%
Air-quality risk 2/10 · Minimal
- Unhealthy air days now
- 1 days/yr
- Unhealthy air days in 30 yrs
- 2 days/yr
Risk factors via First Street. Map © Google.
Why this score? — see what drove the C- grade
The composite is a weighted blend of 9 inputs, each scored 0–100. Each bar is that input's sub-score; the figure is the points it added to the 100-point composite (weight × sub-score).
- Cash flow +24.0/30.0
- DSCR +7.7/10.0
- ARV discount +6.9/15.0
- 1% rule +5.4/10.0
- Livability +3.2/5.0
- Rent growth +2.5/5.0
- Condition / age +2.5/5.0
- Schools +1.7/10.0
- Appreciation +0.0/10.0
$169,000
🖨 Deal sheet (PDF) 📄 Offer letter ✓ Due diligence
Listing remarks MLS
Great opportunity for investors or homebuyers! This 4-bedroom home in Reserve offers spacious living, strong potential, and a convenient location in close proximity to schools, shopping, and local amenities. Tenant occupied with income potential already in place. Showings by appointment only -- please do not disturb tenants.
Key facts
- Income potential
- Convenient location
- 0.29 acre lot
Tags
Property features AI
Finance
- Other: No pets allowed (pet restrictions apply)
Exterior
- Parking: Off-street parking; Driveway
- Utilities: Public water; Public sewer
- Home design: Single-story; Raised foundation; Hardboard exterior; Shingle roof; Property in very good condition
- Construction: Built with hardboard siding; Raised foundation; Shingle roof; 1 story
- Exterior features: Covered patio/porch; Permeable paving; City lot; Rectangular lot; Lot dimensions approximately 80 x 161
Interior
- Kitchen: Oven; Range
- Bathrooms: 1 full bathroom
- Heating & cooling: Central heating; Central air conditioning
- Interior features: Pantry; Accessibility features
- Laundry & utility: Washer hookup; Dryer hookup
Neighborhood map
What this means for you Summary
Snapshot
- This is a 4-bed/1.0-bath single-family listed at $169k.
Deal economics
- At list price, monthly cash flow is $332 ($4k/yr) — positive.
- The deal already cash-flows at list — no discount required.
- Meets the 1% rule at list price ($2k rent vs $169k).
- Recommended offer: $164k (3.0% below list) — sets the bar for market timing.
- Cap rate 8.6% vs local median 6.1% in Reserve — top-decile yield for the area; either an underpriced asset or a hidden risk that comps aren't pricing in. Stress-test before assuming the spread holds.
Location & tenants
- Location reads 65/100 on livability (#153 in LA) — a middle-class / working-renter tenant base. Strengths: cost of living A+, housing A+, health & safety A+; Watch: schools C-, crime F, amenities F.
- St. John The Baptist Parish (suburban): math 13% / reading 25% proficiency, ranked #68 of 98 in LA (top 69%) — low school quality limits family demand, transient renter base, plan for 1-2y turnover; 82% free/reduced lunch — lower-income household profile, screen leases tightly.
- Market conditions: 36 active listings in the ZIP; 61 units permitted in St. John the Baptist Parish in 2024 (0 in 5+ unit buildings).
Forward outlook
- Local home prices are declining (-3.0%/yr); year-one equity from $1k of loan paydown is wiped out by about $5k of value loss. Plan a longer hold.
- St. John the Baptist County population projected at -20% by 2050 — secular population decline; favor cash flow + early exit over multi-decade hold.
Negotiation context
- It's been on market 33 days — a 3% lower offer ($164k) is reasonable based on typical stale-listing flexibility.
- 6 sale attempts since 6y ago with the ask held roughly flat each time — persistent listings suggest the price (not the market) is what's stuck; bring a comps-based counter.
- Current owner paid $66k; list at $169k implies a 156% gain — meaningful room to come down on a strong offer.
Risks & watch-outs
- Watch-outs: built in 1942 — expect roof / HVAC / electrical / plumbing capex.
- Climate carrying-cost: severe wind risk, 99% chance of damaging wind over 30y; extreme-heat days projected 7→21/yr by 2055 (HVAC capex compounding) — expect insurance premiums to compound above CPI over the hold.
Questions for the listing agent
- It's been on market 33 days. Have you received any prior offers? Is the seller open to a 3% concession, seller financing, or rate buy-down credit?
- Built in 1942 — when were the roof, HVAC, electrical panel, plumbing, and water heater last replaced?
- Is there a deadline driving the sale (1031 exchange, divorce, estate, relocation)? That informs how much negotiation room exists.
- Crime grade is F in this area — have there been break-ins, vandalism, or insurance claims at this property in the last 3 years? What carrier currently insures it and at what premium?
- What's the average days-on-market for RENTAL listings here right now (not sales)? A rising rental-DOM trend means longer vacancies and softer asking-rent achievability than the comps imply.
- What's the recent tenant-quality profile in this submarket — average credit score on applications, eviction rate, late-payment / NSF rate, and stable-employment percentage? A property-management company in the area should have these aggregated.
- How much new for-sale + rental construction is in the pipeline within 1–3 miles? Heavy new supply typically softens prices + rents 12–24 months out; constrained supply supports both.
Investment metrics
- 1% rule
- 1.04% ✓
- Cap rate
- 8.65%
- Cash-on-cash
- 8.41%
- DSCR
- 1.37
- GRM
- 8.0
CMA / ARV
- ARV (on-the-fly)
- $166,650
- Comps found
- 5
Show comp detail 5 sales within ~0.75 mi
| Address | Dist | Beds/Ba | Sqft | Sold | Price | $/sf | Match |
|---|---|---|---|---|---|---|---|
| 158 E 7th St | 0.37mi | 3/2.0 (-1) | 1,661 (+1%) | 8mo | $35,500 | $21 | 66 |
| 234 E 12th St Unit ext | 0.39mi | 3/2.5 (-1) | 1,600 (-3%) | 13mo | $170,000 | $106 | 55 |
| 248 W 2nd St | 0.18mi | 3/2.0 (-1) | 1,500 (-9%) | 16mo | $150,350 | $100 | 55 |
| 271 W 7th St | 0.55mi | 3/2.0 (-1) | 1,788 (+8%) | 19mo | $180,000 | $101 | 36 |
| 217 Ivy Ct | 0.70mi | 3/2.0 (-1) | 1,402 (-15%) | 10mo | $229,900 | $164 | 24 |
Match score weights: distance 35% · size 25% · config 20% · recency 20%. Top-matched comps best support the ARV.
Projected returns pro-forma
-3.0% appreciation · 3.0% rent growth · sell at horizon
- IRR
- -3.5%
- Equity multiple
- 0.87×
- Total profit
- $-6,295
- Equity at exit
- $25,198
- IRR
- 6.1%
- Equity multiple
- 1.46×
- Total profit
- $21,563
- Equity at exit
- $14,612
Cash invested: $47,320 (down + closing). Projections, not guarantees.
Landlord ↔ Tenant lean methodology
- Overall (STATE)
- 90 Strongly Landlord-Friendly
- State Louisiana
- 90 Strongly Landlord-Friendly · R+12
- County
- — inherits STATE
- City
- — inherits STATE
ZIP-level market 70084
- Home prices YoY
- -32.4%
- Active inventory
- 36
- Price-to-rent
- 8.0×
Monthly cashflow live
- Estimated rent
- $1,760 medium interval (Pro) →
- Mortgage (P&I)
- −$886
- Tax from tax record
- −$102 /mo · $1,225/yr
- Insurance
- −$70
- HOA
- −$0
- Vacancy / Maint / Mgmt
- −$370
- Net cashflow
- $332
Break-even live
Sensitivity live
| Price | -10% $427 | -5% $380 | +0% $332 | +5% $284 | +10% $236 |
|---|---|---|---|---|---|
| Rent | -10% $193 | -5% $262 | +0% $332 | +5% $401 | +10% $471 |
| Rate | -1.0pp $417 | -0.5pp $375 | base $332 | +0.5pp $288 | +1.0pp $243 |
UW: 25.0% down · 7.5% · 30yr · 1.5% tax · 5.0% vac · 8.0% maint · 8.0% mgmt
Financing live
Cash to close
- Down payment
- $42,250
- Closing costs
- $5,070
- Reserves months
- —
- Total cash needed
- —
Loan-product check · same deal, 3 products live
Conventional
25% down · 7.5% · 30yr
- Down + closing
- —
- Monthly P&I
- —
- Monthly cashflow
- —
- DSCR
- —
- Eligible?
- —
Personal DTI + credit; lowest rate.
DSCR
20% down · 8.5% · 30yr
- Down + closing
- —
- Monthly P&I
- —
- Monthly cashflow
- —
- DSCR
- —
- Eligible?
- —
No personal income docs; deal must DSCR.
Hard money
10% down · 12.0% · 12mo
- Down + closing
- —
- Monthly P&I
- —
- Monthly cashflow
- —
- DSCR
- —
- Eligible?
- —
Short-term bridge; refi at stabilization.
Listing history 27 events
-
2026-06-21days on market $169,000 Active 33 DOM
-
2026-06-19days on market $169,000 Active 31 DOM
-
2026-06-18days on market $169,000 Active 30 DOM
-
2026-06-17days on market $169,000 Active 29 DOM
-
2026-06-16days on market $169,000 Active 28 DOM
-
2026-06-15days on market $169,000 Active 27 DOM
-
2026-06-14days on market $169,000 Active 25 DOM
-
2026-06-13pricedays on market $169,000 Active 24 DOM
-
2026-06-10days on market $174,000 Active 22 DOM
-
2026-06-09days on market $174,000 Active 21 DOM
-
2026-06-08days on market $174,000 Active 20 DOM
-
2026-06-07days on market $174,000 Active 19 DOM
-
2026-06-02days on market $174,000 Active 14 DOM
-
2026-06-01days on market $174,000 Active 13 DOM
-
2026-05-31days on market $174,000 Active 12 DOM
-
2026-05-30days on market $174,000 Active 11 DOM
-
2026-05-19$174,000 Active 326-char remark
Show marketing remark (326 chars)
Great opportunity for investors or homebuyers! This 4-bedroom home in Reserve offers spacious living, strong potential, and a convenient location in close proximity to schools, shopping, and local amenities. Tenant occupied with income potential already in place. Showings by appointment only -- please do not disturb tenants.
-
2026-05-19$174,000 Active
Show marketing remark (326 chars)
Great opportunity for investors or homebuyers! This 4-bedroom home in Reserve offers spacious living, strong potential, and a convenient location in close proximity to schools, shopping, and local amenities. Tenant occupied with income potential already in place. Showings by appointment only -- please do not disturb tenants.
-
2024-07-04historical $1,450
-
2024-05-24$1,450
-
2023-09-27price $100,000
-
2023-08-26price $115,000
-
2023-08-25$100,000
-
2021-04-26soldstatus $66,000 Closed
-
2021-01-10status Pending
-
2020-12-25$70,000
-
2020-12-25$70,000 Active
ⓘ Source: listings_history table (triggers on properties + properties_extension) + one-shot
backfill from property_details.listing_events for pre-trigger history.
Tax reassessment forecast LA · Resets to sale price
- Current annual tax
- $1,225 · $102/mo
- Projected year-2 tax
- $1,225 · $102/mo
- Expected delta
- $0/yr ($0/mo · 0.0%)
ⓘ Screening estimate from a state-policy table — verify with the county assessor before closing.
Climate risk First Street
- Flood 4/10 Moderate FEMA zone X (shaded) · 22% chance over 30 yrs
- Wildfire 1/10 Low
- Heat 9/10 Extreme 7 d/yr ≥108°F today · 21 d/yr by 30 yrs out
- Wind 9/10 Extreme 99% chance of damaging wind over 30 yrs
- Air quality 2/10 Low 1 unhealthy d/yr today · 2 by 30 yrs out
Nearby sold comps map
Loading sold comps map…
Walkable amenities ~0.75 mi
Loading nearby amenities…
Taxation est. · year 1
- Rental income
- $21,121
- − Mortgage interest
- −$9,467
- − Property taxes
- −$1,225
- − Insurance
- −$845
- − Repairs & maintenance
- −$1,690
- − Management
- −$1,690
- − Depreciation
- −$4,916
- Taxable income
- $1,289
- Est. tax owed @ 24.0%
- −$309
- After-tax cash flow
- $3,672/yr
For passive investors: Depreciation is non-cash, so a rental often shows a tax loss while cash-flowing — sheltering income. Rental losses are passive: they offset passive income freely, and up to $25,000/yr can offset ordinary (W-2) income if you actively participate and your MAGI is under $100k (phasing out to $0 by $150k); unused losses carry forward. On sale, claimed depreciation is recaptured at up to 25%, and gains may owe capital-gains tax (a 1031 exchange can defer both). Figures are a year-1 estimate at your 24.0% rate — not tax advice; consult a CPA.
Schools (NCES district)
- District
- St. John The Baptist Parish
- NCES district ID
- 2201530
- Math proficiency
- 13% ▼ -42.00%
- Reading proficiency
- 25% ▼ -39.00%
- Median HH income
- $50,280
- Composite
- 17.07/100
- National rank
- #9120
- State rank
- #68 of 98 in LA
Livability — Reserve
- Score
- 65/100
- State rank
- #153
- US rank
- #13020
Category grades
Schools grade is shown separately in the Schools card above.
Census & demographics
- Census place
- Reserve, LA
- City population
- 5,273
- Population (ZIP)
- 5,273
Population outlook (St. John the Baptist County) Hauer SSP2
- Today (2025)
- 40,972 people
- By 2030
- 39,295 · -4.1%
- By 2040
- 35,902 · -12.4%
- By 2050
- 32,988 · -19.5%
- By 2075
- 28,661 · -30.0%
- By 2100
- 26,456 · -35.4%
Race, ethnicity, and origin ACS 2023
- Neighborhood character
- Diverse neighborhood (Simpson 0.61)
- Race & ethnicity
- Black 51% White 35% Hispanic / Latino 10% Two or more races 7% Native American 2%
- Hispanic origin (detail)
- Mexican 2% Cuban 5%
- Common ancestry
- Lithuanian 13%
- Foreign-born
- 8% · Canada, Jamaica
- Languages at home
- 90% English-only · Spanish 9% Other Indo-European 1%
Political lean MEDSL · St. John the Baptist
- 2024 margin
- Strong D (+29.1) · D 64.0% · R 34.8% · Other 1.2%
- 2008→2024 swing
- +12.9pp toward D · 2008: 16.2pp · 2024: 29.1pp
- All cycles
- 2024: D+29.1 2020: D+28.2 2016: D+24.5 2012: D+26.3 2008: D+16.2
Not yet ingested
- Civics
- —
Market trends
- HPI YoY
- ▼ -62.08%
- Current HPI
- 129.578
- Rent YoY
- —
- Metro
- —
- State GDP YoY
- ▲ 3.29%
- F500 in state
- 10
Industry mix (Fortune 500 HQ in LA)
| Industry | F500 HQs | Revenue |
|---|---|---|
| Telecommunications | 2 | $23B |
|
||
| Utilities | 1 | $12B |
|
||
| Wholesale / Distribution | 1 | $5B |
|
||
| Advertising | 1 | $2B |
|
||
Price history
+148.6% since first listed11 events — show timeline
- 2026-05-19 Listed $174,000 GSREIN
- 2026-05-19 Listed $174,000 AcadianaMLS
- 2024-07-04 Rental Removed $1,450 GSREIN
- 2024-05-24 Listed for Rent $1,450 GSREIN
- 2023-09-27 Price Changed $100,000 GSREIN
- 2023-08-26 Price Changed $115,000 GSREIN
- 2023-08-25 Listed $100,000 AcadianaMLS
- 2021-04-26 Sold (MLS) $66,000 GSREIN
- 2021-01-10 Pending — GSREIN
- 2020-12-25 Listed $70,000 GSREIN
- 2020-12-25 Listed $70,000 AcadianaMLS
Property tax history
+3.0%/yrLatest (2025): $1,225 · +0.1% YoY. Source: county tax records.
Cash-flow waterfall
monthlySold comps — $/sqft
last 12 mo · ≤1 miLoading sold comps…