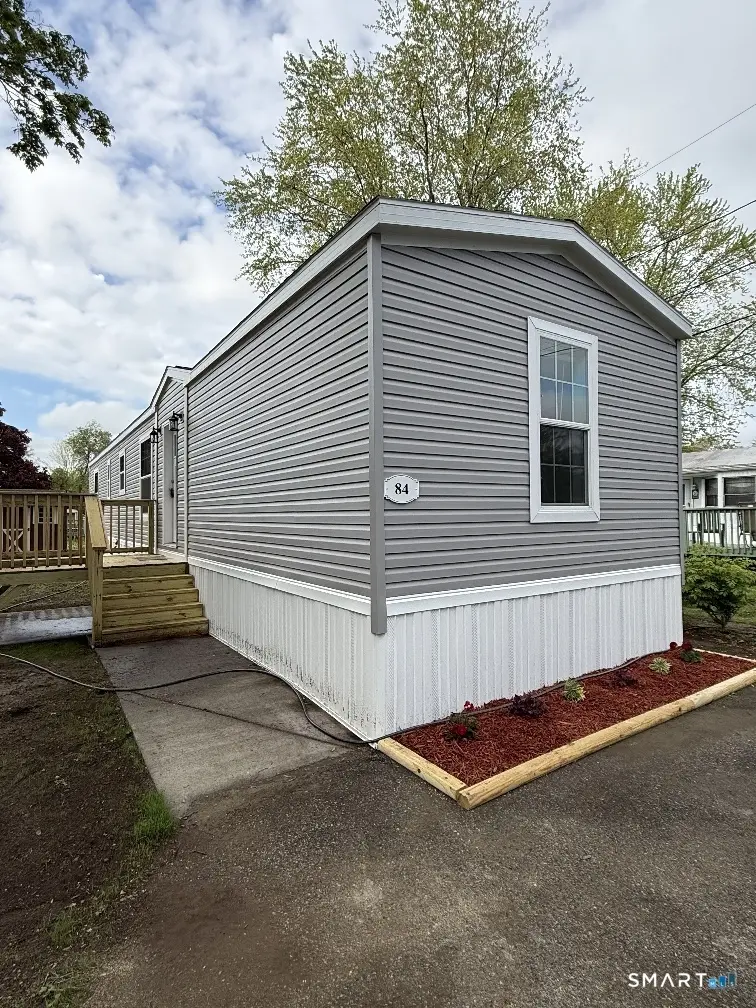
252 Old Canterbury Tpke #84 · Norwich, CT
Flood risk 1/10 · Minimal
- FEMA flood zone
- X (unshaded)
- Chance of flooding over 30 yrs
- 0.0%
- Est. flood insurance / yr
- $507 – $1,088
Fire risk 2/10 · Minimal
- Est. fire insurance / yr
- $829 – $1,539
Heat risk 4/10 · Minor
- Hot days now (above 98°F)
- 7 days/yr
- Hot days in 30 yrs
- 16 days/yr
Wind risk 6/10 · Moderate
- Chance of severe wind over 30 yrs
- 64.0%
Air-quality risk 3/10 · Minor
- Unhealthy air days now
- 2 days/yr
- Unhealthy air days in 30 yrs
- 3 days/yr
Risk factors via First Street. Map © Google.
Why this score? — see what drove the B- grade
The composite is a weighted blend of 9 inputs, each scored 0–100. Each bar is that input's sub-score; the figure is the points it added to the 100-point composite (weight × sub-score).
- Cash flow +29.0/30.0
- DSCR +10.0/10.0
- ARV discount +7.5/15.0
- 1% rule +6.8/10.0
- Rent growth +4.2/5.0
- Livability +4.0/5.0
- Condition / age +2.5/5.0
- Schools +2.1/10.0
- Appreciation +0.0/10.0
$139,900
🖨 Deal sheet 📄 Offer letter ✓ Due diligence
Listing remarks
Brand new, two bedroom/two bath mobile home located on 70 acres with a picturesque country setting. Sale subject to park approval of occupancy application. The current lot rent is $560/month and includes the land rent, water, sewer, trash, and common area maintenance. Only mobile home conveys. Owner agent related.
Key facts
- 2,178 sq ft lot
- Built 2026
- Listed 5 days
Property features AI
Finance
- Other: Home warranty offered
Exterior
- Utilities: Shared well water; Septic sewer; Above-ground fuel tank
- Home design: Single-family home; Under construction
- Construction: Prefab construction; Block foundation; Asphalt shingle roof
- Exterior features: Level lot; Vinyl siding
Interior
- Kitchen: Gas range; Microwave; Range hood; Refrigerator; Dishwasher
- Bedrooms: 2 bedrooms
- Bathrooms: 2 full bathrooms
- Heating & cooling: Hot air heating; Propane fuel; 40-gallon electric hot water tank
- Interior features: Total of 4 rooms; No basement
Neighborhood map
What this means for you Summary
Snapshot
- This is a 2-bed/1.0-bath manufactured listed at $140k.
Deal economics
- At list price, monthly cash flow is $479 ($6k/yr) — positive.
- The deal already cash-flows at list — no discount required.
- Meets the 1% rule at list price ($2k rent vs $140k).
- Cap rate 10.4% vs local median 4.0% in Norwich — top-decile yield for the area; either an underpriced asset or a hidden risk that comps aren't pricing in. Stress-test before assuming the spread holds.
Location & tenants
- Location reads 81/100 on livability (#18 in CT, #1,391 nationally) — a professional / high-income tenant draw. Strengths: housing A+, health & safety A+, commute A-; Watch: schools D+.
- Norwich School District (urban): math 19% / reading 29% proficiency, ranked #139 of 153 in CT (top 91%) — low school quality limits family demand, transient renter base, plan for 1-2y turnover; 62% free/reduced lunch — lower-income household profile, screen leases tightly.
- Market conditions: Rents rising fast (+6.6%/yr); 241 active listings in the ZIP; 487 units permitted in Southeastern Connecticut Planning Region in 2024 (244 in 5+ unit buildings).
- This rent runs 30% of the median local income ($66k/yr) — at the standard rent-burdened threshold; future hikes will face affordability resistance.
Forward outlook
- Local home prices are declining (-3.0%/yr); year-one equity from $967 of loan paydown is wiped out by about $4k of value loss. Plan a longer hold.
- At projected returns (-3.0% appreciation + 6.6% rent growth), your $39k cash investment doubles in ~7 years — after that, you're playing with house money.
Negotiation context
- Only 5 days on market — expect competitive offers; lowballing is unlikely to land.
Risks & watch-outs
- Climate carrying-cost: major wind risk, 64% chance of damaging wind over 30y — expect insurance premiums to compound above CPI over the hold.
Questions for the listing agent
- Is there a deadline driving the sale (1031 exchange, divorce, estate, relocation)? That informs how much negotiation room exists.
- Schools are D-rated, which usually means shorter tenancies and higher turnover. Who's the typical renter profile here, and what's been the actual vacancy rate?
- What's the average days-on-market for RENTAL listings here right now (not sales)? A rising rental-DOM trend means longer vacancies and softer asking-rent achievability than the comps imply.
- What's the recent tenant-quality profile in this submarket — average credit score on applications, eviction rate, late-payment / NSF rate, and stable-employment percentage? A property-management company in the area should have these aggregated.
- How much new for-sale + rental construction is in the pipeline within 1–3 miles? Heavy new supply typically softens prices + rents 12–24 months out; constrained supply supports both.
Investment metrics
- 1% rule
- 1.18% ✓
- Cap rate
- 10.41%
- Cash-on-cash
- 14.69%
- DSCR
- 1.65
- GRM
- 7.1
CMA / ARV
- ARV (median comp)
- $89,222
- List price
- $139,900
- Delta
- 56.80%
- Verdict
- OVERPRICED
- Comps
- 20 within 1.0 mi
Projected returns pro-forma
-3.0% appreciation · 6.62% rent growth · sell at horizon
- IRR
- 8.8%
- Equity multiple
- 1.36×
- Total profit
- $14,014
- Equity at exit
- $20,860
- IRR
- 20.6%
- Equity multiple
- 3.01×
- Total profit
- $78,722
- Equity at exit
- $12,096
Cash invested: $39,172 (down + closing). Projections, not guarantees.
Landlord ↔ Tenant lean methodology
- Overall (STATE)
- 27 Tenant-Leaning
- State Connecticut
- 27 Tenant-Leaning · D+7
- County
- — inherits STATE
- City
- — inherits STATE
ZIP-level market 06360
- Home prices YoY
- -19.9%
- Rents YoY
- 6.6%
- Active inventory
- 241
- Price-to-rent
- 7.1×
Monthly cashflow live
- Estimated rent
- $1,646 medium interval (Pro) →
- Mortgage (P&I)
- −$734
- Tax from tax record
- −$29 /mo · $343/yr
- Insurance
- −$58
- HOA
- −$0
- Vacancy / Maint / Mgmt
- −$346
- Net cashflow
- $479
Break-even live
UW: 25.0% down · 7.5% · 30yr · 1.5% tax · 5.0% vac · 8.0% maint · 8.0% mgmt
Financing live
Cash to close
- Down payment
- $34,975
- Closing costs
- $4,197
- Reserves months
- —
- Total cash needed
- —
Loan-product check · same deal, 3 products live
Conventional
25% down · 7.5% · 30yr
- Down + closing
- —
- Monthly P&I
- —
- Monthly cashflow
- —
- DSCR
- —
- Eligible?
- —
Personal DTI + credit; lowest rate.
DSCR
20% down · 8.5% · 30yr
- Down + closing
- —
- Monthly P&I
- —
- Monthly cashflow
- —
- DSCR
- —
- Eligible?
- —
No personal income docs; deal must DSCR.
Hard money
10% down · 12.0% · 12mo
- Down + closing
- —
- Monthly P&I
- —
- Monthly cashflow
- —
- DSCR
- —
- Eligible?
- —
Short-term bridge; refi at stabilization.
Listing history 2 events
-
2026-05-18status Under Contract 315-char remark
-
2026-05-11$139,900 Active 315-char remark
ⓘ Source: listings_history table (triggers on properties + properties_extension) + one-shot
backfill from property_details.listing_events for pre-trigger history.
Tax reassessment forecast CT · Partial reset (capped growth)
- Current annual tax
- $343 · $29/mo
- Projected year-2 tax
- $1,668 · $139/mo
- Expected delta
- +$1,325/yr (+$110/mo · 386.4%)
ⓘ Screening estimate from a state-policy table — verify with the county assessor before closing.
Climate risk First Street
- Flood 1/10 Low FEMA zone X (unshaded) · 0% chance over 30 yrs
- Wildfire 2/10 Low
- Heat 4/10 Moderate 7 d/yr ≥98°F today · 16 d/yr by 30 yrs out
- Wind 6/10 Major 64% chance of damaging wind over 30 yrs
- Air quality 3/10 Moderate 2 unhealthy d/yr today · 3 by 30 yrs out
Nearby sold comps map
Loading sold comps map…
Walkable amenities ~0.75 mi
Loading nearby amenities…
Taxation est. · year 1
- Rental income
- $19,747
- − Mortgage interest
- −$7,837
- − Property taxes
- −$343
- − Insurance
- −$700
- − Repairs & maintenance
- −$1,580
- − Management
- −$1,580
- − Depreciation
- −$4,070
- Taxable income
- $3,638
- Est. tax owed @ 24.0%
- −$873
- After-tax cash flow
- $4,880/yr
For passive investors: Depreciation is non-cash, so a rental often shows a tax loss while cash-flowing — sheltering income. Rental losses are passive: they offset passive income freely, and up to $25,000/yr can offset ordinary (W-2) income if you actively participate and your MAGI is under $100k (phasing out to $0 by $150k); unused losses carry forward. On sale, claimed depreciation is recaptured at up to 25%, and gains may owe capital-gains tax (a 1031 exchange can defer both). Figures are a year-1 estimate at your 24.0% rate — not tax advice; consult a CPA.
Schools (NCES district)
- District
- Norwich School District
- NCES district ID
- 0903120
- Math proficiency
- 19% ▼ -8.00%
- Reading proficiency
- 29% ▼ -7.00%
- Median HH income
- $50,813
- Composite
- 21.27/100
- National rank
- #8395
- State rank
- #139 of 153 in CT
Livability — Norwich
- Score
- 81/100
- State rank
- #18
- US rank
- #1391
Category grades
Schools grade is shown separately in the Schools card above.
Census & demographics
- Census place
- Norwich, CT
- County
- New London County · 147,197 people
- City population
- 37,216
- Metro
- Norwich-New London, CT
- Population (ZIP)
- 37,216
- Household income
- $65,539
- Rent vs Own
- Severe rent burden
- 1643.0
Population outlook (Southeastern Connecticut County) Hauer SSP2
- By 2040
- 293,442
Race, ethnicity, and origin ACS 2023
- Neighborhood character
- Diverse neighborhood (Simpson 0.63)
- Race & ethnicity
- White 56% Hispanic / Latino 21% Two or more races 12% Black 10% Asian 7%
- Hispanic origin (detail)
- Mexican 3% Puerto Rican 9% Cuban 1% Dominican 3%
- Common ancestry
- Lithuanian 8% Romanian 5% Hispanic 4%
- Foreign-born
- 15% · Canada, China
- Languages at home
- 77% English-only · Spanish 11% French/Haitian/Cajun 4% Chinese 3%
Political lean MEDSL · Southeastern Connecticut
- 2024 margin
- D (+13.0) · D 55.6% · R 42.6% · Other 1.8%
- All cycles
- 2024: D+13.0
Not yet ingested
- Civics
- —
Market trends
- HPI YoY
- ▼ -65.27%
- Current HPI
- 261.8575
- Rent YoY
- ▲ 6.62%
- Metro
- Norwich-New London, CT
- State GDP YoY
- ▲ 1.06%
- F500 in state
- 38
Industry mix (Fortune 500 HQ in CT)
| Industry | F500 HQs | Revenue |
|---|---|---|
| Industrial Machinery | 4 | $38B |
|
||
| Insurance | 3 | $71B |
|
||
| Financial Services | 2 | $25B |
|
||
| Transportation / Logistics | 2 | $18B |
|
||
| Healthcare | 1 | $247B |
|
||
| Telecommunications | 1 | $55B |
|
||
Price history
2 events — show timeline
- 2026-05-18 Pending — Smart MLS
- 2026-05-11 Listed $139,900 Smart MLS
Property tax history
-2.1%/yrLatest (2023): $343 · -0.9% YoY. Source: county tax records.
Cash-flow waterfall
monthlySold comps — $/sqft
last 12 mo · ≤1 miLoading sold comps…