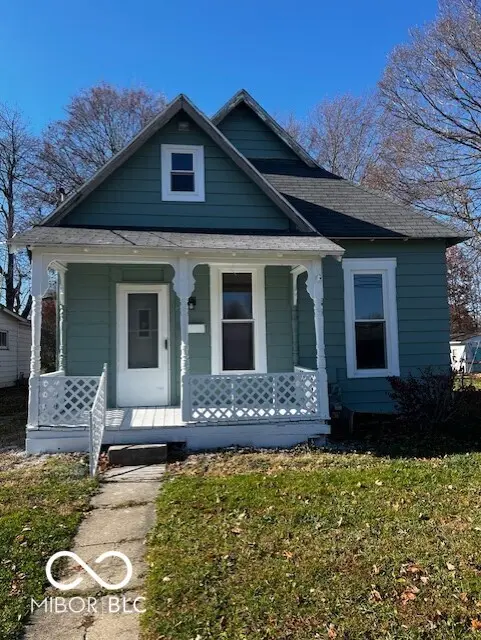
247 N 8th St · Middletown, IN
Flood risk 1/10 · Minimal
- FEMA flood zone
- X (unshaded)
- Chance of flooding over 30 yrs
- 0.0%
- Est. flood insurance / yr
- $473 – $860
Fire risk 1/10 · Minimal
- Est. fire insurance / yr
- $717 – $1,331
Heat risk 3/10 · Minor
- Hot days now (above 99°F)
- 7 days/yr
- Hot days in 30 yrs
- 18 days/yr
Wind risk 2/10 · Minimal
- Chance of severe wind over 30 yrs
- 1.0%
Air-quality risk 3/10 · Minor
- Unhealthy air days now
- 2 days/yr
- Unhealthy air days in 30 yrs
- 4 days/yr
Risk factors via First Street. Map © Google.
Why this score? — see what drove the D+ grade
The composite is a weighted blend of 9 inputs, each scored 0–100. Each bar is that input's sub-score; the figure is the points it added to the 100-point composite (weight × sub-score).
- ARV discount +15.0/15.0
- Cash flow +12.4/30.0
- DSCR +3.7/10.0
- Schools +3.6/10.0
- Livability +3.4/5.0
- 1% rule +2.8/10.0
- Rent growth +2.5/5.0
- Condition / age +2.5/5.0
- Appreciation +0.0/10.0
$114,900
🖨 Deal sheet 📄 Offer letter ✓ Due diligence
Listing remarks MLS
Location, Location, Location. Middletown, IN sitting on a large lot with lots of potential for a garage or expansion of the home. Perfect starter home or investment property recently rented for $975. Many recent updates to the home. Come and see this home today!
Key facts
- Large lot
- 8,712 sq ft lot
- Built 1900
Tags
Neighborhood map
What this means for you Summary
Snapshot
- This is a 2-bed/1.0-bath single-family listed at $115k.
Deal economics
- At list price, monthly cash flow is $-19 ($-230/yr) — negative.
- To cash-flow at today's rent, offer at most $112k (3.0% below list).
- To meet the 1% rule (rent ≥ 1% of price), the offer needs to be $90k (22.1% below list).
- Recommended offer: $90k (22.1% below list) — sets the bar for 1% rule.
Location & tenants
- Location reads 67/100 on livability (#235 in IN) — a middle-class / working-renter tenant base. Strengths: crime A+, cost of living A+, housing A+; Watch: schools C-, amenities F, commute F.
- Shenandoah School Corporation (rural): math 38% / reading 46% proficiency, ranked #118 of 301 in IN (top 39%) — families likely to look elsewhere, expect single-tenant / working-renter base with shorter leases.
- Market conditions: 35 active listings in the ZIP; 1 comparable units currently listed for rent nearby; 47 units permitted in Henry County in 2024 (0 in 5+ unit buildings).
Forward outlook
- Local home prices are declining (-3.0%/yr); year-one equity from $794 of loan paydown is wiped out by about $3k of value loss. Plan a longer hold.
- Henry County population projected at -12% by 2050 — secular population decline; favor cash flow + early exit over multi-decade hold.
Negotiation context
- It's been on market 133 days — a 12% lower offer ($101k) is reasonable based on typical stale-listing flexibility.
- 4 sale attempts since 25y ago; this cycle's ask has dropped $10k (8%) from the opening price — seller is motivated, your offer sets the floor, not the list.
- Current owner paid $20k; list at $115k implies a 474% gain — meaningful room to come down on a strong offer.
Risks & watch-outs
- Watch-outs: built in 1900 — expect roof / HVAC / electrical / plumbing capex.
Questions for the listing agent
- What do current leases actually rent for vs. the listed asking? Can we see a recent rent roll and the last 12 months of T-12 income?
- It's been on market 133 days. Have you received any prior offers? Is the seller open to a 22% concession, seller financing, or rate buy-down credit?
- Built in 1900 — when were the roof, HVAC, electrical panel, plumbing, and water heater last replaced?
- Why hasn't it sold? Are there any deal-killer items the seller is aware of (foundation, flood, title, zoning, code violations)?
- Is there a deadline driving the sale (1031 exchange, divorce, estate, relocation)? That informs how much negotiation room exists.
- The area grade is low — what's the realistic commute time and amenity access for the typical tenant pool here? Any planned neighborhood developments (good or bad) we should know about?
- What's the average days-on-market for RENTAL listings here right now (not sales)? A rising rental-DOM trend means longer vacancies and softer asking-rent achievability than the comps imply.
- What's the recent tenant-quality profile in this submarket — average credit score on applications, eviction rate, late-payment / NSF rate, and stable-employment percentage? A property-management company in the area should have these aggregated.
- How much new for-sale + rental construction is in the pipeline within 1–3 miles? Heavy new supply typically softens prices + rents 12–24 months out; constrained supply supports both.
Investment metrics
- 1% rule
- 0.78% ✗
- Cap rate
- 6.09%
- Cash-on-cash
- -0.72%
- DSCR
- 0.97
- GRM
- 10.7
CMA / ARV
- ARV (median comp)
- $149,268
- List price
- $114,900
- Delta
- -23.02%
- Verdict
- UNDERPRICED
- Comps
- 20 within 1.0 mi
Show comp detail 1 sale within ~0.75 mi
| Address | Dist | Beds/Ba | Sqft | Sold | Price | $/sf | Match |
|---|---|---|---|---|---|---|---|
| 1458 Congress St | 0.64mi | 2/1.0 | 720 (+1%) | 5mo | $127,000 | $176 | 65 |
Match score weights: distance 35% · size 25% · config 20% · recency 20%. Top-matched comps best support the ARV.
Projected returns pro-forma
-3.0% appreciation · 3.0% rent growth · sell at horizon
- IRR
- -17.5%
- Equity multiple
- 0.38×
- Total profit
- $-19,870
- Equity at exit
- $17,132
- IRR
- -9.6%
- Equity multiple
- 0.41×
- Total profit
- $-18,992
- Equity at exit
- $9,934
Cash invested: $32,172 (down + closing). Projections, not guarantees.
Landlord ↔ Tenant lean methodology
- Overall (STATE)
- 90 Strongly Landlord-Friendly
- State Indiana
- 90 Strongly Landlord-Friendly · R+11
- County
- — inherits STATE
- City
- — inherits STATE
ZIP-level market 47356
- Home prices YoY
- -18.9%
- Active inventory
- 35
- Price-to-rent
- 10.7×
Monthly cashflow live
- Estimated rent
- $895 medium interval (Pro) →
- Mortgage (P&I)
- −$603
- Tax from tax record
- −$76 /mo · $910/yr
- Insurance
- −$48
- HOA
- −$0
- Vacancy / Maint / Mgmt
- −$188
- Net cashflow
- $-19
Break-even live
UW: 25.0% down · 7.5% · 30yr · 1.5% tax · 5.0% vac · 8.0% maint · 8.0% mgmt
Financing live
Cash to close
- Down payment
- $28,725
- Closing costs
- $3,447
- Reserves months
- —
- Total cash needed
- —
Loan-product check · same deal, 3 products live
Conventional
25% down · 7.5% · 30yr
- Down + closing
- —
- Monthly P&I
- —
- Monthly cashflow
- —
- DSCR
- —
- Eligible?
- —
Personal DTI + credit; lowest rate.
DSCR
20% down · 8.5% · 30yr
- Down + closing
- —
- Monthly P&I
- —
- Monthly cashflow
- —
- DSCR
- —
- Eligible?
- —
No personal income docs; deal must DSCR.
Hard money
10% down · 12.0% · 12mo
- Down + closing
- —
- Monthly P&I
- —
- Monthly cashflow
- —
- DSCR
- —
- Eligible?
- —
Short-term bridge; refi at stabilization.
Rent comps 1 comps
| Address | Beds | Baths | Sqft | Rent | $/sqft | DOM | Units | Dist |
|---|---|---|---|---|---|---|---|---|
| 803 High St Unit 805 Middletown, IN | 2.0 | 1.0 | 600 | $895 | $1.49 | 43d | 1 | 0.09mi |
Listing history 29 events
-
2026-06-19days on market $114,900 Active 133 DOM
-
2026-06-18days on market $114,900 Active 132 DOM
-
2026-06-17days on market $114,900 Active 131 DOM
-
2026-06-16days on market $114,900 Active 130 DOM
-
2026-06-15days on market $114,900 Active 129 DOM
-
2026-06-14days on market $114,900 Active 127 DOM
-
2026-06-12days on market $114,900 Active 126 DOM
-
2026-06-09days on market $114,900 Active 123 DOM
-
2026-06-08days on market $114,900 Active 122 DOM
-
2026-06-07days on market $114,900 Active 121 DOM
-
2026-06-05days on market $114,900 Active 118 DOM
-
2026-06-03days on market $114,900 Active 117 DOM
-
2026-06-02days on market $114,900 Active 116 DOM
-
2026-06-01days on market $114,900 Active 115 DOM
-
2026-05-31days on market $114,900 Active 114 DOM
-
2026-05-30days on market $114,900 Active 113 DOM
-
2026-04-24price $114,900 262-char remark
Show marketing remark (262 chars)
Location, Location, Location. Middletown, IN sitting on a large lot with lots of potential for a garage or expansion of the home. Perfect starter home or investment property recently rented for $975. Many recent updates to the home. Come and see this home today!
-
2026-04-08price $119,000 262-char remark
Show marketing remark (262 chars)
Location, Location, Location. Middletown, IN sitting on a large lot with lots of potential for a garage or expansion of the home. Perfect starter home or investment property recently rented for $975. Many recent updates to the home. Come and see this home today!
-
2026-04-04price $124,900 262-char remark
Show marketing remark (262 chars)
Location, Location, Location. Middletown, IN sitting on a large lot with lots of potential for a garage or expansion of the home. Perfect starter home or investment property recently rented for $975. Many recent updates to the home. Come and see this home today!
-
2026-02-04$125,000 Active 262-char remark
Show marketing remark (262 chars)
Location, Location, Location. Middletown, IN sitting on a large lot with lots of potential for a garage or expansion of the home. Perfect starter home or investment property recently rented for $975. Many recent updates to the home. Come and see this home today!
-
2025-11-26historical
-
2025-07-07price $119,000
-
2025-06-19status Active
-
2025-06-10historical
-
2025-04-20price $124,000
-
2025-03-07price $129,000
-
2025-01-10$130,000 Active
-
2002-06-28soldstatus $20,000
-
2001-11-25$22,900
ⓘ Source: listings_history table (triggers on properties + properties_extension) + one-shot
backfill from property_details.listing_events for pre-trigger history.
Tax reassessment forecast IN · Partial reset (capped growth)
- Current annual tax
- $910 · $76/mo
- Projected year-2 tax
- $943 · $79/mo
- Expected delta
- +$33/yr (+$3/mo · 3.7%)
ⓘ Screening estimate from a state-policy table — verify with the county assessor before closing.
Climate risk First Street
- Flood 1/10 Low FEMA zone X (unshaded) · 0% chance over 30 yrs
- Wildfire 1/10 Low
- Heat 3/10 Moderate 7 d/yr ≥99°F today · 18 d/yr by 30 yrs out
- Wind 2/10 Low 100% chance of damaging wind over 30 yrs
- Air quality 3/10 Moderate 2 unhealthy d/yr today · 4 by 30 yrs out
Nearby sold comps map
Loading sold comps map…
Walkable amenities ~0.75 mi
Loading nearby amenities…
Taxation est. · year 1
- Rental income
- $10,740
- − Mortgage interest
- −$6,436
- − Property taxes
- −$910
- − Insurance
- −$574
- − Repairs & maintenance
- −$859
- − Management
- −$859
- − Depreciation
- −$3,343
- Taxable loss
- −$2,242
- Est. tax savings @ 24.0%
- +$538
- After-tax cash flow
- $308/yr
For passive investors: Depreciation is non-cash, so a rental often shows a tax loss while cash-flowing — sheltering income. Rental losses are passive: they offset passive income freely, and up to $25,000/yr can offset ordinary (W-2) income if you actively participate and your MAGI is under $100k (phasing out to $0 by $150k); unused losses carry forward. On sale, claimed depreciation is recaptured at up to 25%, and gains may owe capital-gains tax (a 1031 exchange can defer both). Figures are a year-1 estimate at your 24.0% rate — not tax advice; consult a CPA.
Schools (NCES district)
- District
- Shenandoah School Corporation
- NCES district ID
- 1808280
- Math proficiency
- 38% ▼ -15.00%
- Reading proficiency
- 46% ▼ -9.00%
- Median HH income
- $50,961
- Composite
- 36.22/100
- National rank
- #4723
- State rank
- #118 of 301 in IN
Livability — Middletown
- Score
- 67/100
- State rank
- #235
- US rank
- #10188
Category grades
Schools grade is shown separately in the Schools card above.
Census & demographics
- Census place
- Middletown, IN
- Population (ZIP)
- 5,508
Population outlook (Henry County) Hauer SSP2
- Today (2025)
- 48,028 people
- By 2030
- 47,125 · -1.9%
- By 2040
- 44,820 · -6.7%
- By 2050
- 42,207 · -12.1%
- By 2075
- 35,814 · -25.4%
- By 2100
- 26,779 · -44.2%
Race, ethnicity, and origin ACS 2023
- Neighborhood character
- Predominantly White (90%)
- Race & ethnicity
- White 90% Two or more races 5% Hispanic / Latino 3% Black 2%
- Common ancestry
- Serbian 3% Iranian 2% Slovak 2%
- Foreign-born
- 2%
- Languages at home
- 99% English-only · Spanish 1%
Political lean MEDSL · Henry
- 2024 margin
- Solid R (+47.7) · D 25.3% · R 73.0% · Other 1.7%
- 2008→2024 swing
- -43.8pp toward R · 2008: -3.9pp · 2024: -47.7pp
- All cycles
- 2024: R+47.7 2020: R+45.2 2016: R+43.7 2012: R+17.0 2008: R+3.9
Not yet ingested
- Civics
- —
Market trends
- HPI YoY
- ▼ -55.87%
- Current HPI
- 240.0691
- Rent YoY
- —
- Metro
- —
- State GDP YoY
- ▲ 2.90%
- F500 in state
- 18
Industry mix (Fortune 500 HQ in IN)
| Industry | F500 HQs | Revenue |
|---|---|---|
| Industrial Machinery | 2 | $37B |
|
||
| Healthcare | 1 | $177B |
|
||
| Pharmaceuticals | 1 | $45B |
|
||
| Metals / Steel | 1 | $18B |
|
||
| Agriculture | 1 | $17B |
|
||
| Packaging | 1 | $12B |
|
||
Price history
+401.7% since first listed13 events — show timeline
- 2026-04-24 Price Changed $114,900 MIBOR as Distributed by MLS Grid
- 2026-04-08 Price Changed $119,000 MIBOR as Distributed by MLS Grid
- 2026-04-04 Price Changed $124,900 MIBOR as Distributed by MLS Grid
- 2026-02-04 Listed $125,000 MIBOR as Distributed by MLS Grid
- 2025-11-26 Listing Removed — MIBOR as Distributed by MLS Grid
- 2025-07-07 Price Changed $119,000 MIBOR as Distributed by MLS Grid
- 2025-06-19 Relisted — MIBOR as Distributed by MLS Grid
- 2025-06-10 Listing Removed — MIBOR as Distributed by MLS Grid
- 2025-04-20 Price Changed $124,000 MIBOR as Distributed by MLS Grid
- 2025-03-07 Price Changed $129,000 MIBOR as Distributed by MLS Grid
- 2025-01-10 Listed $130,000 MIBOR as Distributed by MLS Grid
- 2002-06-28 Sold (MLS) $20,000 MIBOR as Distributed by MLS Grid
- 2001-11-25 Listed $22,900 MIBOR as Distributed by MLS Grid
Property tax history
+3.1%/yrLatest (2024): $910 · +16.1% YoY. Source: county tax records.
Cash-flow waterfall
monthlySold comps — $/sqft
last 12 mo · ≤1 miLoading sold comps…