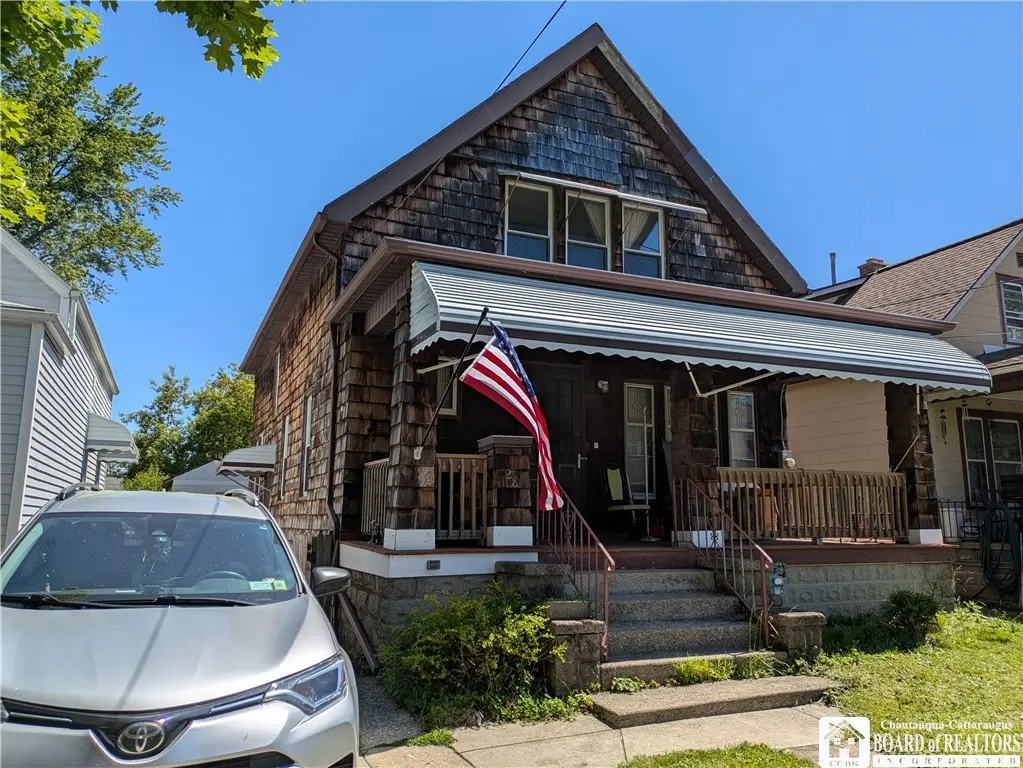
28 Oschawa Ave · West Seneca, NY
Flood risk 1/10 · Minimal
- FEMA flood zone
- X (unshaded)
- Chance of flooding over 30 yrs
- 0.0%
- Est. flood insurance / yr
- $473 – $860
Fire risk 1/10 · Minimal
- Est. fire insurance / yr
- $691 – $1,283
Heat risk 3/10 · Minor
- Hot days now (above 92°F)
- 7 days/yr
- Hot days in 30 yrs
- 16 days/yr
Wind risk 1/10 · Minimal
- Chance of severe wind over 30 yrs
- —
Air-quality risk 3/10 · Minor
- Unhealthy air days now
- 2 days/yr
- Unhealthy air days in 30 yrs
- 3 days/yr
Risk factors via First Street. Map © Google.
Why this score? — see what drove the B+ grade
The composite is a weighted blend of 9 inputs, each scored 0–100. Each bar is that input's sub-score; the figure is the points it added to the 100-point composite (weight × sub-score).
- Cash flow +25.9/30.0
- Appreciation +10.0/10.0
- DSCR +8.7/10.0
- 1% rule +8.4/10.0
- ARV discount +7.5/15.0
- Rent growth +5.0/5.0
- Schools +4.5/10.0
- Livability +4.0/5.0
- Condition / age +2.5/5.0
$99,900
🖨 Deal sheet 📄 Offer letter ✓ Due diligence
Listing remarks
Calling all investors: great opportunity on a nice West Seneca street. Lots of great character and original charm, needs some drywall repair in a number of places and updating throughout but it has great bones. 1st floor bedroom and full bath, living room and eat-in kitchen. Upstairs has 1 large bedroom and could easily add a 3rd bedroom and possibly a bath or half bath. Full basement with tons of storage. The mechanicals are solid. Concrete drive, 2 sheds, large fenced yard. Private appointments only and they must occur between 10am and 2pm on Saturday 6/6 and between 4pm and 7pm on Tuesday 6/9. Offers due by 1pm on Wednesday 6/10. Cash only offers.
Key facts
- 1st floor bedroom
- Large bedroom
- Full basement
Tags
Property features AI
Exterior
- Parking: No garage
- Utilities: Public water (connected); Sewer connected
- Home design: 2-story home; Resale property; Cedar construction
- Construction: Block foundation; Cedar exterior
- Exterior features: Concrete driveway; Rectangular residential lot (35 x 142)
Interior
- Kitchen: Gas oven; Gas range; Refrigerator
- Bedrooms: 1 main-level bedroom
- Flooring: Hardwood; Varies
- Bathrooms: 1 full bathroom (main level)
- Heating & cooling: Gas forced-air heating
- Interior features: Eat-in kitchen; Bedroom on main level; Full basement
Neighborhood map
What this means for you Summary
Snapshot
- This is a 2-bed/1.0-bath single-family listed at $100k.
Deal economics
- At list price, monthly cash flow is $246 ($3k/yr) — positive.
- The deal already cash-flows at list — no discount required.
- Meets the 1% rule at list price ($1k rent vs $100k).
- Cap rate 9.2% vs local median 3.7% in West Seneca — top-decile yield for the area; either an underpriced asset or a hidden risk that comps aren't pricing in. Stress-test before assuming the spread holds.
Location & tenants
- Location reads 79/100 on livability (#130 in NY, #2,089 nationally) — a middle-class / working-renter tenant base. Strengths: housing A+, health & safety A+, crime A-; Watch: amenities D, commute F.
- West Seneca Central School District (suburban): math 49% / reading 55% proficiency, ranked #336 of 590 in NY (top 57%) — acceptable for families but not a draw, mixed tenant base, ~2y average lease.
- Market conditions: Rents rising fast (+12.7%/yr); 94 active listings in the ZIP; 15 comparable units currently listed for rent nearby; rentals at typical pace (median 15d on market — plan ~3-4 weeks tenant-placement turnaround); 1,244 units permitted in Erie County in 2024 (563 in 5+ unit buildings).
Forward outlook
- In year one you build about $11k of equity ($691 loan paydown + $10k appreciation (10.0% local appreciation)).
- At projected returns (10.0% appreciation + 8.0% rent growth), your $28k cash investment doubles in ~2 years — after that, you're playing with house money.
- By year 4, paydown + projected appreciation supports a ~$38k cash-out refi (75% LTV) — recoverable capital for the next deal without selling this one.
Negotiation context
- Only 7 days on market — expect competitive offers; lowballing is unlikely to land.
Risks & watch-outs
- Watch-outs: property tax is 2.9% of price; built in 1917 — expect roof / HVAC / electrical / plumbing capex.
Questions for the listing agent
- Built in 1917 — when were the roof, HVAC, electrical panel, plumbing, and water heater last replaced?
- Property tax is high relative to price — has the assessment been appealed recently, and will the sale trigger a re-assessment?
- Is there a deadline driving the sale (1031 exchange, divorce, estate, relocation)? That informs how much negotiation room exists.
- Schools are B-rated — typically a magnet for longer-tenancy family renters. What's the average tenant stay here, and is there a school-zone premium baked into asking?
- What's the average days-on-market for RENTAL listings here right now (not sales)? A rising rental-DOM trend means longer vacancies and softer asking-rent achievability than the comps imply.
- What's the recent tenant-quality profile in this submarket — average credit score on applications, eviction rate, late-payment / NSF rate, and stable-employment percentage? A property-management company in the area should have these aggregated.
- How much new for-sale + rental construction is in the pipeline within 1–3 miles? Heavy new supply typically softens prices + rents 12–24 months out; constrained supply supports both.
Investment metrics
- 1% rule
- 1.34% ✓
- Cap rate
- 9.25%
- Cash-on-cash
- 10.54%
- DSCR
- 1.47
- GRM
- 6.2
CMA / ARV
- ARV (on-the-fly)
- $212,648
- Comps found
- 12
Show comp detail 12 sales within ~0.75 mi
| Address | Dist | Beds/Ba | Sqft | Sold | Price | $/sf | Match |
|---|---|---|---|---|---|---|---|
| 248 Kirkwood Dr | 0.31mi | 3/1.0 (+1) | 1,309 (-6%) | 4mo | $192,000 | $147 | 67 |
| 428 Indian Church Rd | 0.49mi | 3/1.5 (+1) | 1,344 (-4%) | 5mo | $130,000 | $97 | 60 |
| 243 Burch Ave | 0.21mi | 3/1.0 (+1) | 1,206 (-14%) | 6mo | $240,000 | $199 | 57 |
| 302 Kirkwood Dr | 0.29mi | 3/2.0 (+1) | 1,550 (+11%) | 8mo | $245,600 | $158 | 53 |
| 123 Columbia Pkwy | 0.41mi | 3/1.5 (+1) | 1,566 (+12%) | 2mo | $260,000 | $166 | 53 |
| 214 Aurora Ave | 0.69mi | 3/1.5 (+1) | 1,440 (+3%) | 5mo | $215,000 | $149 | 52 |
| 209 Geary St | 0.47mi | 3/2.0 (+1) | 1,479 (+6%) | 9mo | $225,000 | $152 | 52 |
| 50 Dwyer St | 0.69mi | 3/2.0 (+1) | 1,432 (+2%) | 5mo | $260,000 | $182 | 51 |
| 531 Harlem Rd | 0.69mi | 3/2.0 (+1) | 1,450 (+4%) | 4mo | $110,000 | $76 | 49 |
| 39 Klas Ave | 0.74mi | 3/1.5 (+1) | 1,352 (-3%) | 7mo | $163,000 | $121 | 47 |
| 330 Cumberland Ave | 0.71mi | 3/1.5 (+1) | 1,321 (-6%) | 6mo | $217,000 | $164 | 46 |
| 83 Kirkwood Dr | 0.51mi | 3/1.5 (+1) | 1,241 (-11%) | 7mo | $175,000 | $141 | 44 |
Match score weights: distance 35% · size 25% · config 20% · recency 20%. Top-matched comps best support the ARV.
Projected returns pro-forma
10.0% appreciation · 8.0% rent growth · sell at horizon
- IRR
- 34.6%
- Equity multiple
- 3.76×
- Total profit
- $77,215
- Equity at exit
- $89,998
- IRR
- 31.8%
- Equity multiple
- 9.32×
- Total profit
- $232,752
- Equity at exit
- $194,084
Cash invested: $27,972 (down + closing). Projections, not guarantees.
Landlord ↔ Tenant lean methodology
- Overall (STATE)
- 15 Strongly Tenant-Friendly
- State New York
- 15 Strongly Tenant-Friendly · D+10
- County
- — inherits STATE
- City
- — inherits STATE
ZIP-level market 14210
- Home prices YoY
- 13.8%
- Rents YoY
- 12.7%
- Active inventory
- 94
- Price-to-rent
- 6.2×
Monthly cashflow live
- Estimated rent
- $1,336 high interval (Pro) →
- Mortgage (P&I)
- −$524
- Tax from tax record
- −$244 /mo · $2,929/yr
- Insurance
- −$42
- HOA
- −$0
- Vacancy / Maint / Mgmt
- −$281
- Net cashflow
- $246
Break-even live
UW: 25.0% down · 7.5% · 30yr · 1.5% tax · 5.0% vac · 8.0% maint · 8.0% mgmt
Financing live
Cash to close
- Down payment
- $24,975
- Closing costs
- $2,997
- Reserves months
- —
- Total cash needed
- —
Loan-product check · same deal, 3 products live
Conventional
25% down · 7.5% · 30yr
- Down + closing
- —
- Monthly P&I
- —
- Monthly cashflow
- —
- DSCR
- —
- Eligible?
- —
Personal DTI + credit; lowest rate.
DSCR
20% down · 8.5% · 30yr
- Down + closing
- —
- Monthly P&I
- —
- Monthly cashflow
- —
- DSCR
- —
- Eligible?
- —
No personal income docs; deal must DSCR.
Hard money
10% down · 12.0% · 12mo
- Down + closing
- —
- Monthly P&I
- —
- Monthly cashflow
- —
- DSCR
- —
- Eligible?
- —
Short-term bridge; refi at stabilization.
Rent comps 15 comps
| Address | Beds | Baths | Sqft | Rent | $/sqft | DOM | Units | Dist |
|---|---|---|---|---|---|---|---|---|
| 23 Indian Orchard Pl Unit Lower Buffalo, NY | 3.0 | 1.0 | 1200 | $1,250 | $1.04 | 43d | 1 | 0.15mi |
| 102 Wildwood Pl Unit 1 Buffalo, NY | 3.0 | 1.0 | 1100 | $1,250 | $1.14 | 16d | 1 | 0.41mi |
| 2111 Seneca St #3 Buffalo, NY | 2.0 | 1.0 | 937 | $1,150 | $1.23 | 43d | 1 | 0.47mi |
| 78 Kirkwood Dr Unit Lower Unit West Seneca, NY | 2.0 | 1.0 | 1808 | $1,375 | $0.76 | 2d | 1 | 0.51mi |
| 46 Kirkwood Dr Unit Lower West Seneca, NY | 2.0 | 1.0 | 1064 | $1,350 | $1.27 | 16d | 1 | 0.55mi |
| 34 Hayden St Unit Back Buffalo, NY | 3.0 | 1.0 | 1200 | $1,600 | $1.33 | 43d | 1 | 0.63mi |
| 1927 Seneca St Buffalo, NY | 3.0 | 1.0 | 1196 | $1,250 | $1.05 | 23d | 1 | 0.75mi |
| 298 Cumberland Ave Buffalo, NY | 3.0 | 1.5 | 1208 | $2,200 | $1.82 | 1d | 1 | 0.75mi |
| 1899 Seneca St Buffalo, NY | 3.0 | 1.0 | 1134 | $1,075 | $0.95 | 14d | 1 | 0.81mi |
| 86 Edgewood Ave Buffalo, NY | 2.0 | 2.0 | 1700 | $1,700 | $1.00 | 1d | 1 | 0.89mi |
| 76 Hammerschmidt Ave Buffalo, NY | 3.0 | 1.0 | 1200 | $1,275 | $1.06 | 2d | 1 | 0.92mi |
| 214 Abbott Rd Unit 2 Buffalo, NY | 2.0 | 1.0 | 945 | $1,200 | $1.27 | 14d | 1 | 1.10mi |
| 111 Southside Pkwy Buffalo, NY | 1.0 | 1.0 | 1000 | $1,000 | $1.00 | 23d | 1 | 1.20mi |
| 74 Woodside Ave Unit 1 Buffalo, NY | 3.0 | 1.0 | 1250 | $1,510 | $1.21 | 1d | 1 | 1.33mi |
| 89 Macamley St #2 Buffalo, NY | 3.0 | 1.0 | 1274 | $1,100 | $0.86 | 10d | 1 | 1.34mi |
Listing history 5 events
-
2026-06-10days on market $99,900 Active 7 DOM
-
2026-06-09days on market $99,900 Active 6 DOM
-
2026-06-08days on market $99,900 Active 5 DOM
-
2026-06-07remarks 660-char remark
-
2026-06-07$99,900 Active 4 DOM
ⓘ Source: listings_history table (triggers on properties + properties_extension) + one-shot
backfill from property_details.listing_events for pre-trigger history.
Tax reassessment forecast NY · Partial reset (capped growth)
- Current annual tax
- $2,929 · $244/mo
- Projected year-2 tax
- $2,929 · $244/mo
- Expected delta
- $0/yr ($0/mo · 0.0%)
ⓘ Screening estimate from a state-policy table — verify with the county assessor before closing.
Climate risk First Street
- Flood 1/10 Low FEMA zone X (unshaded) · 0% chance over 30 yrs
- Wildfire 1/10 Low
- Heat 3/10 Moderate 7 d/yr ≥92°F today · 16 d/yr by 30 yrs out
- Wind 1/10 Low
- Air quality 3/10 Moderate 2 unhealthy d/yr today · 3 by 30 yrs out
Nearby sold comps map
Loading sold comps map…
Walkable amenities ~0.75 mi
Loading nearby amenities…
Taxation est. · year 1
- Rental income
- $16,031
- − Mortgage interest
- −$5,596
- − Property taxes
- −$2,929
- − Insurance
- −$500
- − Repairs & maintenance
- −$1,282
- − Management
- −$1,282
- − Depreciation
- −$2,906
- Taxable income
- $1,535
- Est. tax owed @ 24.0%
- −$368
- After-tax cash flow
- $2,581/yr
For passive investors: Depreciation is non-cash, so a rental often shows a tax loss while cash-flowing — sheltering income. Rental losses are passive: they offset passive income freely, and up to $25,000/yr can offset ordinary (W-2) income if you actively participate and your MAGI is under $100k (phasing out to $0 by $150k); unused losses carry forward. On sale, claimed depreciation is recaptured at up to 25%, and gains may owe capital-gains tax (a 1031 exchange can defer both). Figures are a year-1 estimate at your 24.0% rate — not tax advice; consult a CPA.
Schools (NCES district)
- District
- West Seneca Central School District
- NCES district ID
- 3630780
- Math proficiency
- 49% ▼ -15.00%
- Reading proficiency
- 55% ▼ -4.00%
- Median HH income
- $54,231
- Composite
- 44.83/100
- National rank
- #2735
- State rank
- #336 of 590 in NY
Livability — West Seneca
- Score
- 79/100
- State rank
- #130
- US rank
- #2089
Category grades
Schools grade is shown separately in the Schools card above.
Census & demographics
- Census place
- West Seneca, NY
- County
- Erie County · 714,559 people
- City population
- 41,101
- Metro
- Buffalo-Cheektowaga, NY
- Population (ZIP)
- 15,563
- Household income
- $54,197
- Rent vs Own
- Severe rent burden
- 959.0
Population outlook (Erie County) Hauer SSP2
- Today (2025)
- 933,037 people
- By 2030
- 935,181 · +0.2%
- By 2040
- 928,531 · -0.5%
- By 2050
- 905,725 · -2.9%
- By 2075
- 834,037 · -10.6%
- By 2100
- 708,033 · -24.1%
Race, ethnicity, and origin ACS 2023
- Neighborhood character
- Predominantly White (79%)
- Race & ethnicity
- White 79% Two or more races 8% Black 8% Hispanic / Latino 7% Asian 1%
- Hispanic origin (detail)
- Puerto Rican 6%
- Common ancestry
- Romanian 21% Lithuanian 2% Serbian 1%
- Foreign-born
- 2% · Canada, China
- Languages at home
- 95% English-only · Spanish 2% Arabic 1% Other Indo-European 1%
Political lean MEDSL · Erie
- 2024 margin
- Lean D (+9.7) · D 54.8% · R 45.2%
- 2008→2024 swing
- -7.9pp toward R · 2008: 17.5pp · 2024: 9.7pp
- All cycles
- 2024: D+9.7 2020: D+14.7 2016: D+4.8 2012: D+15.6 2008: D+17.5
Not yet ingested
- Civics
- —
Market trends
- HPI YoY
- ▲ 52.34%
- Current HPI
- 431.7951
- Rent YoY
- ▲ 12.67%
- Metro
- Buffalo-Cheektowaga, NY
- State GDP YoY
- ▲ 2.60%
- F500 in state
- 92
Industry mix (Fortune 500 HQ in NY)
| Industry | F500 HQs | Revenue |
|---|---|---|
| Financial Services | 10 | $950B |
|
||
| Consumer Goods | 9 | $162B |
|
||
| Insurance | 4 | $225B |
|
||
| Telecommunications | 2 | $144B |
|
||
| Pharmaceuticals | 2 | $112B |
|
||
| Media / Entertainment | 2 | $69B |
|
||
Price history
1 event — show timeline
- 2026-06-03 Listed $99,900 UNYREIS
Property tax history
+10.7%/yrLatest (2025): $2,929 · -1.4% YoY. Source: county tax records.
Cash-flow waterfall
monthlySold comps — $/sqft
last 12 mo · ≤1 miLoading sold comps…