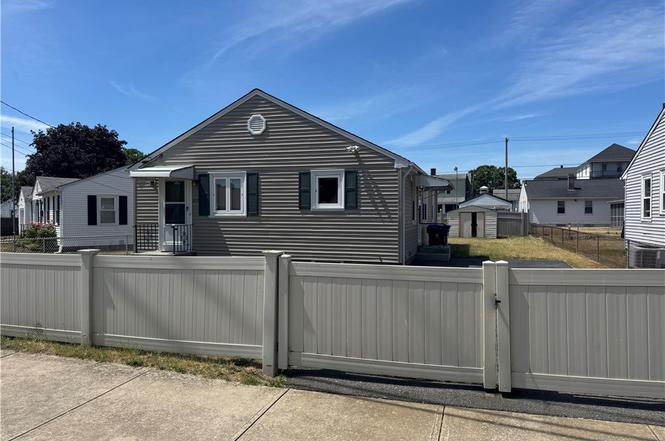
315 Rhode Island Ave · Pawtucket, RI
Flood risk 1/10 · Minimal
- FEMA flood zone
- X (unshaded)
- Chance of flooding over 30 yrs
- 0.0%
- Est. flood insurance / yr
- $473 – $860
Fire risk 1/10 · Minimal
- Est. fire insurance / yr
- $835 – $1,551
Heat risk 6/10 · Moderate
- Hot days now (above 98°F)
- 7 days/yr
- Hot days in 30 yrs
- 15 days/yr
Wind risk 6/10 · Moderate
- Chance of severe wind over 30 yrs
- 70.0%
Air-quality risk 2/10 · Minimal
- Unhealthy air days now
- 1 days/yr
- Unhealthy air days in 30 yrs
- 2 days/yr
Risk factors via First Street. Map © Google.
Why this score? — see what drove the D+ grade
The composite is a weighted blend of 9 inputs, each scored 0–100. Each bar is that input's sub-score; the figure is the points it added to the 100-point composite (weight × sub-score).
- ARV discount +15.0/15.0
- Cash flow +14.2/30.0
- DSCR +4.3/10.0
- 1% rule +4.2/10.0
- Livability +3.6/5.0
- Rent growth +3.4/5.0
- Condition / age +2.5/5.0
- Schools +1.1/10.0
- Appreciation +0.0/10.0
$219,999
🖨 Deal sheet 📄 Offer letter ✓ Due diligence
Listing remarks
Charming 2-bedroom ranch offering comfortable single-level living in a convenient Pawtucket location. Features include a bright and functional layout, full basement for storage or future expansion, off-street parking, and a manageable yard. Close to shopping, dining, parks, schools, and major highways. A great opportunity for first-time buyers, downsizers, or investors.
Key facts
- Manageable yard
- Full basement
- Close to dining
Tags
Property features AI
Finance
- HOA & community: Community amenities nearby include golf, marina, pool, public transportation, recreation area, restaurants, shopping, tennis courts, highway access, and proximity to hospital and schools
Exterior
- Parking: Space for 3 vehicles (no garage)
- Utilities: 200+ amp electric service; Public water; Public sewer
- Home design: Single-story home
- Construction: Concrete perimeter foundation
- Exterior features: No notable exterior features listed
Interior
- Kitchen: Refrigerator; Dishwasher
- Bedrooms: Two first-floor bedrooms
- Flooring: Hardwood; Laminate
- Bathrooms: One full bathroom (first floor)
- Heating & cooling: Oil-fired baseboard heating
- Interior features: Stall shower; Partially finished basement with interior and exterior entry
- Laundry & utility: Washer; Dryer; Water heater
Neighborhood map
What this means for you Summary
Snapshot
- This is a 2-bed/1.0-bath single-family listed at $220k.
Deal economics
- At list price, monthly cash flow is $38 ($454/yr) — positive.
- The deal already cash-flows at list — no discount required.
- To meet the 1% rule (rent ≥ 1% of price), the offer needs to be $202k (8.1% below list).
- Recommended offer: $202k (8.1% below list) — sets the bar for 1% rule.
- Cap rate 6.5% vs local median 3.8% in Pawtucket — top-decile yield for the area; either an underpriced asset or a hidden risk that comps aren't pricing in. Stress-test before assuming the spread holds.
Location & tenants
- Location reads 71/100 on livability (#16 in RI) — a middle-class / working-renter tenant base. Strengths: housing A+, health & safety A+, cost of living B+; Watch: employment C-, schools D, amenities F.
- Pawtucket (suburban): math 7% / reading 19% proficiency, ranked #33 of 39 in RI (top 85%) — low school quality limits family demand, transient renter base, plan for 1-2y turnover; 67% free/reduced lunch — lower-income household profile, screen leases tightly.
- Market conditions: Rents rising (+3.5%/yr); 123 active listings in the ZIP; 40 comparable units currently listed for rent nearby; rentals at typical pace (median 24d on market — plan ~3-4 weeks tenant-placement turnaround); 776 units permitted in Providence County in 2024 (229 in 5+ unit buildings).
- This rent runs 39% of the median local income ($62k/yr) — at the standard rent-burdened threshold; future hikes will face affordability resistance.
Forward outlook
- Local home prices are declining (-3.0%/yr); year-one equity from $2k of loan paydown is wiped out by about $7k of value loss. Plan a longer hold.
- Providence County population projected at +5% by 2050 — modest demand growth; plan on rents tracking national, not racing it.
Negotiation context
- Only 2 days on market — expect competitive offers; lowballing is unlikely to land.
Risks & watch-outs
- Watch-outs: built in 1955 — expect roof / HVAC / electrical / plumbing capex.
- Climate carrying-cost: major wind risk, 70% chance of damaging wind over 30y; extreme-heat days projected 7→15/yr by 2055 (HVAC capex compounding) — expect insurance premiums to compound above CPI over the hold.
Questions for the listing agent
- Built in 1955 — when were the roof, HVAC, electrical panel, plumbing, and water heater last replaced?
- Is there a deadline driving the sale (1031 exchange, divorce, estate, relocation)? That informs how much negotiation room exists.
- Schools are D-rated, which usually means shorter tenancies and higher turnover. Who's the typical renter profile here, and what's been the actual vacancy rate?
- The area grade is low — what's the realistic commute time and amenity access for the typical tenant pool here? Any planned neighborhood developments (good or bad) we should know about?
- What's the average days-on-market for RENTAL listings here right now (not sales)? A rising rental-DOM trend means longer vacancies and softer asking-rent achievability than the comps imply.
- What's the recent tenant-quality profile in this submarket — average credit score on applications, eviction rate, late-payment / NSF rate, and stable-employment percentage? A property-management company in the area should have these aggregated.
- How much new for-sale + rental construction is in the pipeline within 1–3 miles? Heavy new supply typically softens prices + rents 12–24 months out; constrained supply supports both.
Investment metrics
- 1% rule
- 0.92% ✗
- Cap rate
- 6.50%
- Cash-on-cash
- 0.74%
- DSCR
- 1.03
- GRM
- 9.1
CMA / ARV
- ARV (on-the-fly)
- $404,320
- Comps found
- 12
Show comp detail 12 sales within ~0.75 mi
| Address | Dist | Beds/Ba | Sqft | Sold | Price | $/sf | Match |
|---|---|---|---|---|---|---|---|
| 327 Rhode Island Ave | 0.01mi | 3/2.0 (+1) | 1,053 (-1%) | 1mo | $415,000 | $394 | 88 |
| 76 Rosella Ave | 0.55mi | 3/1.0 (+1) | 1,092 (+3%) | 1mo | $415,000 | $380 | 64 |
| 100 Columbus Ave | 0.43mi | 2/1.0 | 1,118 (+5%) | 15mo | $265,000 | $237 | 59 |
| 39 Yale Ave | 0.43mi | 3/1.0 (+1) | 1,036 (-3%) | 16mo | $390,000 | $376 | 58 |
| 45 Fortin Ave | 0.44mi | 2/2.0 | 1,153 (+8%) | 7mo | $419,000 | $363 | 56 |
| 67 Alfa Dr | 0.20mi | 3/2.0 (+1) | 924 (-13%) | 6mo | $80,000 | $87 | 55 |
| 76 Lake St | 0.55mi | 2/2.0 | 972 (-9%) | 2mo | $375,000 | $386 | 54 |
| 49 Fred St | 0.52mi | 3/1.0 (+1) | 960 (-10%) | 12mo | $392,000 | $408 | 44 |
| 84 Farrell St | 0.64mi | 2/1.0 | 967 (-9%) | 13mo | $340,000 | $352 | 44 |
| 24 Kepler St | 0.54mi | 2/1.5 | 925 (-13%) | 11mo | $299,000 | $323 | 42 |
| 125 Monticello Rd | 0.64mi | 3/1.0 (+1) | 960 (-10%) | 10mo | $375,000 | $391 | 41 |
| 104 Lyman St | 0.61mi | 3/1.0 (+1) | 1,171 (+10%) | 11mo | $519,500 | $444 | 40 |
Match score weights: distance 35% · size 25% · config 20% · recency 20%. Top-matched comps best support the ARV.
Projected returns pro-forma
-3.0% appreciation · 3.47% rent growth · sell at horizon
- IRR
- -14.6%
- Equity multiple
- 0.48×
- Total profit
- $-32,226
- Equity at exit
- $32,803
- IRR
- -5.0%
- Equity multiple
- 0.66×
- Total profit
- $-20,762
- Equity at exit
- $19,021
Cash invested: $61,600 (down + closing). Projections, not guarantees.
Landlord ↔ Tenant lean methodology
- Overall (STATE)
- 31 Tenant-Leaning
- State Rhode Island
- 31 Tenant-Leaning · D+8
- County
- — inherits STATE
- City
- — inherits STATE
ZIP-level market 02860
- Rents YoY
- 3.5%
- Active inventory
- 123
- Price-to-rent
- 9.1×
Monthly cashflow live
- Estimated rent
- $2,021 high interval (Pro) →
- Mortgage (P&I)
- −$1,154
- Tax from tax record
- −$313 /mo · $3,761/yr
- Insurance
- −$92
- HOA
- −$0
- Vacancy / Maint / Mgmt
- −$424
- Net cashflow
- $38
Break-even live
UW: 25.0% down · 7.5% · 30yr · 1.5% tax · 5.0% vac · 8.0% maint · 8.0% mgmt
Financing live
Cash to close
- Down payment
- $55,000
- Closing costs
- $6,600
- Reserves months
- —
- Total cash needed
- —
Loan-product check · same deal, 3 products live
Conventional
25% down · 7.5% · 30yr
- Down + closing
- —
- Monthly P&I
- —
- Monthly cashflow
- —
- DSCR
- —
- Eligible?
- —
Personal DTI + credit; lowest rate.
DSCR
20% down · 8.5% · 30yr
- Down + closing
- —
- Monthly P&I
- —
- Monthly cashflow
- —
- DSCR
- —
- Eligible?
- —
No personal income docs; deal must DSCR.
Hard money
10% down · 12.0% · 12mo
- Down + closing
- —
- Monthly P&I
- —
- Monthly cashflow
- —
- DSCR
- —
- Eligible?
- —
Short-term bridge; refi at stabilization.
Rent comps 40 comps
| Address | Beds | Baths | Sqft | Rent | $/sqft | DOM | Units | Dist |
|---|---|---|---|---|---|---|---|---|
| 29 Fortin Ave Pawtucket, RI | 2.0 | 2.0 | 1216 | $2,500 | $2.06 | 3d | 1 | 0.39mi |
| 67 Fred St Pawtucket, RI | 3.0 | 1.0 | 1200 | $2,500 | $2.08 | 44d | 1 | 0.49mi |
| 133 Clifford St Unit 2 Pawtucket, RI | 2.0 | 1.0 | 960 | $1,800 | $1.88 | 23d | 1 | 0.68mi |
| 31 Potter St Unit 1 Pawtucket, RI | 3.0 | 1.0 | 1100 | $2,000 | $1.82 | 44d | 1 | 0.75mi |
| 53 S Bend St Unit 3 Pawtucket, RI | 3.0 | 1.0 | 922 | $1,900 | $2.06 | 23d | 1 | 0.79mi |
| 178 Oak Hill Ave Unit 1 Pawtucket, RI | 2.0 | 1.0 | 1200 | $2,500 | $2.08 | 44d | 1 | 0.86mi |
| 136 George St Unit 8 Pawtucket, RI | 2.0 | 1.0 | 800 | $1,650 | $2.06 | 44d | 1 | 0.90mi |
| 29 Pine St Unit 2 Pawtucket, RI | 3.0 | 1.0 | 1100 | $1,900 | $1.73 | 16d | 1 | 0.94mi |
| 6 Lawton St Unit 5 Pawtucket, RI | 2.0 | 1.0 | 800 | $1,450 | $1.81 | 23d | 1 | 0.97mi |
| 44 Pine St Unit 2 Pawtucket, RI | 2.0 | 1.0 | 980 | $1,800 | $1.84 | 23d | 1 | 0.97mi |
| 132 Armistice Blvd Unit 3 Pawtucket, RI | 1.0 | 1.0 | 700 | $1,300 | $1.86 | 17d | 1 | 1.00mi |
| 160 Garden St Pawtucket, RI | 2.0 | 1.0 | 1200 | $2,300 | $1.92 | 1d | 1 | 1.01mi |
| 48 Waltham St Pawtucket, RI | 3.0 | 1.0 | 1100 | $2,450 | $2.23 | 44d | 1 | 1.06mi |
| 397 Pawtucket Ave Unit 2 Pawtucket, RI | 3.0 | 1.0 | 1434 | $2,200 | $1.53 | 23d | 1 | 1.10mi |
| 13 Magill St Unit 2 Pawtucket, RI | 2.0 | 1.0 | 1100 | $1,850 | $1.68 | 44d | 1 | 1.11mi |
| 724 Beverage Hill Ave Unit B2 Pawtucket, RI | 2.0 | 1.0 | 790 | $1,700 | $2.15 | 23d | 1 | 1.12mi |
| 75 S Union St Pawtucket, RI | 1.0–2.0 | 1.0–2.0 | 1053 | $2,795 | $2.65 | 1d | 8 | 1.12mi |
| 422 Pawtucket Ave Unit 2 Pawtucket, RI | 3.0 | 1.0 | 900 | $1,875 | $2.08 | 44d | 1 | 1.12mi |
| 422 Pawtucket Ave Unit 11 Pawtucket, RI | 2.0 | 1.0 | 700 | $1,750 | $2.50 | 23d | 1 | 1.12mi |
| 145 Randall St Pawtucket, RI | 1.0–2.0 | 1.0 | 955 | $2,150 | $2.25 | 4d | 5 | 1.16mi |
| 180 Parkview Dr Pawtucket, RI | 2.0 | 1.0 | 900 | $1,885 | $2.09 | 44d | 1 | 1.18mi |
| 421 West Ave Unit 1 Pawtucket, RI | 3.0 | 1.0 | 1498 | $2,300 | $1.54 | 1d | 1 | 1.18mi |
| 43 Trenton St Unit 2 Pawtucket, RI | 3.0 | 1.0 | 1092 | $2,500 | $2.29 | 44d | 1 | 1.19mi |
| 171 N Bend St Unit 1 Pawtucket, RI | 3.0 | 2.0 | 1352 | $2,450 | $1.81 | 1d | 1 | 1.20mi |
| 28 Bayley St Unit 1107 Pawtucket, RI | 1.0 | 1.5 | 1270 | $2,400 | $1.89 | 1d | 1 | 1.21mi |
| 19 Barney Ave Unit 1 Pawtucket, RI | 3.0 | 1.0 | 1000 | $1,950 | $1.95 | 44d | 1 | 1.22mi |
| 904 York Ave Unit 1 Pawtucket, RI | 2.0 | 1.0 | 1015 | $2,200 | $2.17 | 23d | 1 | 1.22mi |
| 223 Cottage St Unit 1 Pawtucket, RI | 1.0 | 1.0 | 1000 | $1,650 | $1.65 | 44d | 1 | 1.27mi |
| 301 Lowden St Pawtucket, RI | 3.0 | 1.0 | 1000 | $2,100 | $2.10 | 16d | 1 | 1.31mi |
| 8 Bagley St Unit 2 Pawtucket, RI | 3.0 | 1.0 | 1173 | $1,975 | $1.68 | 23d | 1 | 1.32mi |
| 97 11th St #2 Providence, RI | 2.0 | 1.0 | 1074 | $2,500 | $2.33 | 23d | 1 | 1.33mi |
| 14 Saratoga Ave Unit 5 Pawtucket, RI | 2.0 | 1.0 | 1100 | $1,950 | $1.77 | 3d | 1 | 1.34mi |
| 14 Saratoga Ave Unit 4 Pawtucket, RI | 2.0 | 1.0 | 1000 | $1,795 | $1.79 | 14d | 1 | 1.34mi |
| 984 York Ave Unit 2L Pawtucket, RI | 1.0 | 1.0 | 726 | $1,600 | $2.20 | 44d | 1 | 1.35mi |
| 56 Greene St Unit 2 Pawtucket, RI | 3.0 | 1.0 | 1200 | $2,200 | $1.83 | 44d | 1 | 1.36mi |
| 22 Heaton St Unit 3 Pawtucket, RI | 3.0 | 1.0 | 1117 | $2,300 | $2.06 | 44d | 1 | 1.37mi |
| 595 Armistice Blvd Unit 3 Pawtucket, RI | 2.0 | 1.0 | 700 | $1,850 | $2.64 | 10d | 1 | 1.38mi |
| 595 Armistice Blvd Unit 2 Pawtucket, RI | 2.0 | 1.0 | 1000 | $2,000 | $2.00 | 10d | 1 | 1.38mi |
| 413 Central Ave Pawtucket, RI | 1.0–3.0 | 1.0–2.0 | 1285 | $2,428 | $1.89 | 1d | 9 | 1.38mi |
| 850 Main St #2 Pawtucket, RI | 2.0 | 1.0 | 1000 | $1,495 | $1.50 | 23d | 1 | 1.38mi |
Listing history 3 events
-
2026-06-18days on market $219,999 Active 2 DOM
-
2026-06-17remarks 372-char remark
-
2026-06-17$219,999 Active 1 DOM
ⓘ Source: listings_history table (triggers on properties + properties_extension) + one-shot
backfill from property_details.listing_events for pre-trigger history.
Tax reassessment forecast RI · Partial reset (capped growth)
- Current annual tax
- $3,761 · $313/mo
- Projected year-2 tax
- $3,761 · $313/mo
- Expected delta
- $0/yr ($0/mo · 0.0%)
ⓘ Screening estimate from a state-policy table — verify with the county assessor before closing.
Climate risk First Street
- Flood 1/10 Low FEMA zone X (unshaded) · 0% chance over 30 yrs
- Wildfire 1/10 Low
- Heat 6/10 Major 7 d/yr ≥98°F today · 15 d/yr by 30 yrs out
- Wind 6/10 Major 70% chance of damaging wind over 30 yrs
- Air quality 2/10 Low 1 unhealthy d/yr today · 2 by 30 yrs out
Nearby sold comps map
Loading sold comps map…
Walkable amenities ~0.75 mi
Loading nearby amenities…
Taxation est. · year 1
- Rental income
- $24,252
- − Mortgage interest
- −$12,323
- − Property taxes
- −$3,761
- − Insurance
- −$1,100
- − Repairs & maintenance
- −$1,940
- − Management
- −$1,940
- − Depreciation
- −$6,400
- Taxable loss
- −$3,212
- Est. tax savings @ 24.0%
- +$771
- After-tax cash flow
- $1,225/yr
For passive investors: Depreciation is non-cash, so a rental often shows a tax loss while cash-flowing — sheltering income. Rental losses are passive: they offset passive income freely, and up to $25,000/yr can offset ordinary (W-2) income if you actively participate and your MAGI is under $100k (phasing out to $0 by $150k); unused losses carry forward. On sale, claimed depreciation is recaptured at up to 25%, and gains may owe capital-gains tax (a 1031 exchange can defer both). Figures are a year-1 estimate at your 24.0% rate — not tax advice; consult a CPA.
Schools (NCES district)
- District
- Pawtucket
- NCES district ID
- 4400840
- Math proficiency
- 7% ▼ -10.00%
- Reading proficiency
- 19% ▼ -5.00%
- Median HH income
- $41,838
- Composite
- 11.29/100
- National rank
- #9718
- State rank
- #33 of 39 in RI
Livability — Pawtucket
- Score
- 71/100
- State rank
- #16
- US rank
- #7037
Category grades
Schools grade is shown separately in the Schools card above.
Census & demographics
- Census place
- Pawtucket, RI
- County
- Providence County · 548,917 people
- City population
- 75,942
- Metro
- Providence-Warwick, RI-MA
- Population (ZIP)
- 47,818
- Household income
- $61,539
- Rent vs Own
- Severe rent burden
- 2528.0
Population outlook (Providence County) Hauer SSP2
- Today (2025)
- 653,469 people
- By 2030
- 660,819 · +1.1%
- By 2040
- 672,747 · +3.0%
- By 2050
- 683,741 · +4.6%
- By 2075
- 720,435 · +10.2%
- By 2100
- 741,582 · +13.5%
Race, ethnicity, and origin ACS 2023
- Neighborhood character
- Highly diverse neighborhood (Simpson 0.74)
- Race & ethnicity
- White 40% Hispanic / Latino 29% Two or more races 22% Black 14% Asian 1%
- Hispanic origin (detail)
- Mexican 2% Puerto Rican 9% Dominican 6%
- Common ancestry
- Russian 9% Lithuanian 4% Romanian 2%
- Foreign-born
- 28% · Canada, Jamaica
- Languages at home
- 57% English-only · Spanish 22% Other Indo-European 9% French/Haitian/Cajun 9%
Political lean MEDSL · Providence
- 2024 margin
- D (+14.4) · D 56.1% · R 41.7% · Other 2.2%
- 2008→2024 swing
- -20.0pp toward R · 2008: 34.4pp · 2024: 14.4pp
- All cycles
- 2024: D+14.4 2020: D+22.9 2016: D+21.2 2012: D+34.9 2008: D+34.4
Not yet ingested
- Civics
- —
Market trends
- HPI YoY
- ▼ -215.00%
- Current HPI
- 355.0152
- Rent YoY
- ▲ 3.47%
- Metro
- Providence-Warwick, RI-MA
- State GDP YoY
- ▲ 2.25%
- F500 in state
- 10
Industry mix (Fortune 500 HQ in RI)
| Industry | F500 HQs | Revenue |
|---|---|---|
| Healthcare | 1 | $373B |
|
||
| Food Distribution | 1 | $31B |
|
||
| Aerospace / Defense | 1 | $14B |
|
||
| Financial Services | 1 | $8B |
|
||
| Consumer Goods | 1 | $4B |
|
||
Price history
1 event — show timeline
- 2026-06-16 Listed $219,999 RIS
Property tax history
+2.1%/yrLatest (2025): $3,761 · +6.6% YoY. Source: county tax records.
Cash-flow waterfall
monthlySold comps — $/sqft
last 12 mo · ≤1 miLoading sold comps…