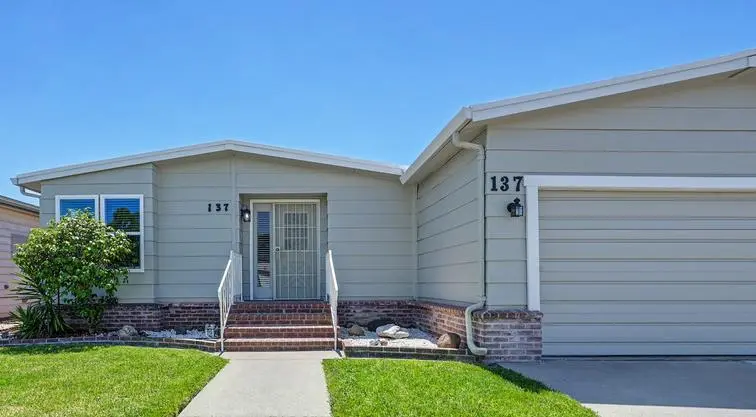
137 Kasberg Dr · Roseville, CA
Flood risk 1/10 · Minimal
- FEMA flood zone
- X (unshaded)
- Chance of flooding over 30 yrs
- 0.0%
- Est. flood insurance / yr
- $507 – $1,088
Fire risk 6/10 · Moderate
- Est. fire insurance / yr
- $659 – $1,223
Heat risk 7/10 · Major
- Hot days now (above 104°F)
- 7 days/yr
- Hot days in 30 yrs
- 16 days/yr
Wind risk 1/10 · Minimal
- Chance of severe wind over 30 yrs
- —
Air-quality risk 10/10 · Severe
- Unhealthy air days now
- 33 days/yr
- Unhealthy air days in 30 yrs
- 37 days/yr
Risk factors via First Street. Map © Google.
Why this score? — see what drove the B- grade
The composite is a weighted blend of 9 inputs, each scored 0–100. Each bar is that input's sub-score; the figure is the points it added to the 100-point composite (weight × sub-score).
- Cash flow +30.0/30.0
- DSCR +10.0/10.0
- 1% rule +8.8/10.0
- Schools +5.1/10.0
- ARV discount +4.4/15.0
- Condition / age +4.0/5.0
- Livability +3.9/5.0
- Rent growth +2.9/5.0
- Appreciation +0.0/10.0
$205,000
🖨 Deal sheet 📄 Offer letter ✓ Due diligence
Listing remarks
This gorgous home has new everything and top of the line appliances. Plenty of room for entertaining. Dimond K is famous for history and luxury. Ownership includes access to the beautiful grounds, Billiard room, Game room, library, spacious clubhouse, Tennis courts, pickleball courts and too many activities to list. ENJOY RETIREMENT Welcome home
Key facts
- Tennis courts
- Billiard room
- Library
Tags
Property features AI
Finance
- Other: Property condition listed as updated/remodeled; Directions: Take Pleasant Grove Boulevard to Washington, look for the large Diamond K sign, turn onto Kasberg; the home is about 3 blocks in.
- Financial info: Land lease: No (land lease amount listed separately)
- HOA & community: No association; Senior community
Exterior
- Parking: Attached covered parking
- Utilities: Public water; Public sewer; Cable available; DSL available; Individual electric meter; Individual gas meter; 220 volts in kitchen and laundry
- Home design: Manufactured in park; Triple wide; Built in 1980
- Construction: Composition roof; Roberts Homes make; Skirt: Other/Unknown
- Exterior features: Backyard and front yard; Regular-shaped lot
Interior
- Kitchen: Free standing gas range; Free standing refrigerator; Dishwasher
- Bedrooms: 3 bedrooms
- Flooring: Laminate flooring
- Bathrooms: 2 full bathrooms; Double sinks; Combination tub with shower and separate shower stall(s)
- Heating & cooling: Central heating; Central cooling
- Interior features: Updated/remodeled interior; Covered deck and covered patio; Cathedral/vaulted living room with attached deck; Breakfast area and pantry closet in kitchen; Stone countertops
- Laundry & utility: Laundry hookups inside a room
Neighborhood map
What this means for you Summary
Snapshot
- This is a 3-bed/2.0-bath manufactured listed at $205k. Condition is rated good.
Deal economics
- At list price, monthly cash flow is $814 ($10k/yr) — positive.
- The deal already cash-flows at list — no discount required.
- Meets the 1% rule at list price ($3k rent vs $205k).
- Recommended offer: $202k (1.5% below list) — sets the bar for market timing.
- Cap rate 11.1% vs local median 2.8% in Roseville — top-decile yield for the area; either an underpriced asset or a hidden risk that comps aren't pricing in. Stress-test before assuming the spread holds.
Location & tenants
- Location reads 77/100 on livability (#90 in CA, #3,239 nationally) — a middle-class / working-renter tenant base. Strengths: commute A+, employment A+, housing A+; Watch: cost of living F.
- Roseville Joint Union High (urban): math 42% / reading 71% proficiency, ranked #86 of 517 in CA (top 17%) — acceptable for families but not a draw, mixed tenant base, ~2y average lease.
- Market conditions: Rents rising (+1.8%/yr); 167 active listings in the ZIP; 15 comparable units currently listed for rent nearby; rentals leasing fast (median 2d on market — plan ~1-2 weeks tenant-placement turnaround); solid renter incomes; 3,535 units permitted in Placer County in 2024 (689 in 5+ unit buildings).
- This rent runs 34% of the median local income ($101k/yr) — at the standard rent-burdened threshold; future hikes will face affordability resistance.
Forward outlook
- Local home prices are declining (-3.0%/yr); year-one equity from $1k of loan paydown is wiped out by about $6k of value loss. Plan a longer hold.
- Placer County population projected at +20% by 2050 — long-run rental-demand tailwind backs the buy-and-hold thesis.
- At projected returns (-3.0% appreciation + 1.8% rent growth), your $57k cash investment doubles in ~8 years — after that, you're playing with house money.
Negotiation context
- It's been on market 21 days — a 2% lower offer ($202k) is reasonable based on typical stale-listing flexibility.
Risks & watch-outs
- Climate carrying-cost: major wildfire risk; extreme-heat days projected 7→16/yr by 2055 (HVAC capex compounding) — expect insurance premiums to compound above CPI over the hold.
Questions for the listing agent
- Is there a deadline driving the sale (1031 exchange, divorce, estate, relocation)? That informs how much negotiation room exists.
- Schools are B-rated — typically a magnet for longer-tenancy family renters. What's the average tenant stay here, and is there a school-zone premium baked into asking?
- What's the average days-on-market for RENTAL listings here right now (not sales)? A rising rental-DOM trend means longer vacancies and softer asking-rent achievability than the comps imply.
- What's the recent tenant-quality profile in this submarket — average credit score on applications, eviction rate, late-payment / NSF rate, and stable-employment percentage? A property-management company in the area should have these aggregated.
- How much new for-sale + rental construction is in the pipeline within 1–3 miles? Heavy new supply typically softens prices + rents 12–24 months out; constrained supply supports both.
Investment metrics
- 1% rule
- 1.38% ✓
- Cap rate
- 11.06%
- Cash-on-cash
- 17.01%
- DSCR
- 1.76
- GRM
- 6.1
CMA / ARV
- ARV (on-the-fly)
- $191,880
- Comps found
- 2
Show comp detail 2 sales within ~0.75 mi
| Address | Dist | Beds/Ba | Sqft | Sold | Price | $/sf | Match |
|---|---|---|---|---|---|---|---|
| 227 Lafayette Dr #227 | 0.73mi | 3/2.0 | 1,624 (-1%) | 11mo | $190,000 | $117 | 55 |
| 290 Lafayette | 0.71mi | 2/2.0 (-1) | 1,708 (+4%) | 5mo | $175,900 | $103 | 51 |
Match score weights: distance 35% · size 25% · config 20% · recency 20%. Top-matched comps best support the ARV.
Projected returns pro-forma
-3.0% appreciation · 1.75% rent growth · sell at horizon
- IRR
- 6.9%
- Equity multiple
- 1.26×
- Total profit
- $15,130
- Equity at exit
- $30,566
- IRR
- 15.1%
- Equity multiple
- 2.15×
- Total profit
- $66,033
- Equity at exit
- $17,725
Cash invested: $57,400 (down + closing). Projections, not guarantees.
Landlord ↔ Tenant lean methodology
- Overall (STATE)
- 18 Strongly Tenant-Friendly
- State California
- 18 Strongly Tenant-Friendly · D+13
- County
- — inherits STATE
- City
- — inherits STATE
ZIP-level market 95678
- Rents YoY
- 1.8%
- Active inventory
- 167
- Price-to-rent
- 6.1×
Monthly cashflow live
- Estimated rent
- $2,823 high interval (Pro) →
- Mortgage (P&I)
- −$1,075
- Tax est. 1.5%
- −$256 /mo · $3,075/yr
- Insurance
- −$85
- HOA
- −$0
- Vacancy / Maint / Mgmt
- −$593
- Net cashflow
- $814
Break-even live
UW: 25.0% down · 7.5% · 30yr · 1.5% tax · 5.0% vac · 8.0% maint · 8.0% mgmt
Financing live
Cash to close
- Down payment
- $51,250
- Closing costs
- $6,150
- Reserves months
- —
- Total cash needed
- —
Loan-product check · same deal, 3 products live
Conventional
25% down · 7.5% · 30yr
- Down + closing
- —
- Monthly P&I
- —
- Monthly cashflow
- —
- DSCR
- —
- Eligible?
- —
Personal DTI + credit; lowest rate.
DSCR
20% down · 8.5% · 30yr
- Down + closing
- —
- Monthly P&I
- —
- Monthly cashflow
- —
- DSCR
- —
- Eligible?
- —
No personal income docs; deal must DSCR.
Hard money
10% down · 12.0% · 12mo
- Down + closing
- —
- Monthly P&I
- —
- Monthly cashflow
- —
- DSCR
- —
- Eligible?
- —
Short-term bridge; refi at stabilization.
Rent comps 15 comps
| Address | Beds | Baths | Sqft | Rent | $/sqft | DOM | Units | Dist |
|---|---|---|---|---|---|---|---|---|
| 604 Hovey Way Roseville, CA | 3.0 | 2.0 | 1169 | $2,695 | $2.31 | 1d | 1 | 0.24mi |
| 1317 Rice Ln Roseville, CA | 3.0 | 2.0 | 1442 | $2,395 | $1.66 | 1d | 1 | 0.34mi |
| 512 Adora Cir Roseville, CA | 2.0 | 3.0 | 1225 | $3,387 | $2.76 | 4d | 1 | 0.45mi |
| 413 Adora Cir Roseville, CA | 1.0–2.0 | 1.0–2.5 | 985 | $2,863 | $2.91 | 1d | 4 | 0.46mi |
| 120 Ivy St Roseville, CA | 3.0 | 2.5 | 1525 | $2,595 | $1.70 | 1d | 1 | 0.70mi |
| 1601 Vineyard Rd Roseville, CA | 1.0–3.0 | 1.0–2.0 | 1107 | $2,799 | $2.53 | 1d | 9 | 0.84mi |
| 409 Washington Blvd Roseville, CA | 3.0 | 2.0 | 2000 | $1,995 | $1.00 | 1d | 1 | 0.85mi |
| 210 D St Roseville, CA | 3.0 | 2.5 | 1433 | $2,795 | $1.95 | 1d | 1 | 1.06mi |
| 1422 Lorimer Way Roseville, CA | 4.0 | 2.0 | 1650 | $2,795 | $1.69 | 1d | 1 | 1.07mi |
| 1243 S Bluff Dr Roseville, CA | 3.0 | 2.0 | 1433 | $2,795 | $1.95 | 22d | 1 | 1.14mi |
| 129 Vernon St Apt 403 Roseville, CA | 2.0 | 2.0 | 2112 | $4,500 | $2.13 | 7d | 1 | 1.19mi |
| 304 Diamond Oaks Rd Roseville, CA | 3.0 | 2.0 | 2116 | $3,200 | $1.51 | 10d | 1 | 1.19mi |
| 348 B St Roseville, CA | 2.0 | 1.0 | 1150 | $1,995 | $1.73 | 1d | 1 | 1.20mi |
| 317 Aspen Ct Roseville, CA | 3.0 | 2.0 | 1744 | $3,200 | $1.83 | 1d | 1 | 1.35mi |
| 1057 Shenencock Way Roseville, CA | 3.0 | 2.0 | 1406 | $2,795 | $1.99 | 1d | 1 | 1.45mi |
Listing history 14 events
-
2026-06-18days on market $205,000 Active 21 DOM
-
2026-06-17days on market $205,000 Active 20 DOM
-
2026-06-16days on market $205,000 Active 19 DOM
-
2026-06-15days on market $205,000 Active 18 DOM
-
2026-06-13days on market $205,000 Active 16 DOM
-
2026-06-13days on market $205,000 Active 15 DOM
-
2026-06-09days on market $205,000 Active 12 DOM
-
2026-06-08days on market $205,000 Active 11 DOM
-
2026-06-07days on market $205,000 Active 10 DOM
-
2026-06-05days on market $205,000 Active 7 DOM
-
2026-06-03days on market $205,000 Active 6 DOM
-
2026-06-02days on market $205,000 Active 5 DOM
-
2026-06-01days on market $205,000 Active 4 DOM
-
2026-05-31days on market $205,000 Active 3 DOM
ⓘ Source: listings_history table (triggers on properties + properties_extension) + one-shot
backfill from property_details.listing_events for pre-trigger history.
Climate risk First Street
- Flood 1/10 Low FEMA zone X (unshaded) · 0% chance over 30 yrs
- Wildfire 6/10 Major
- Heat 7/10 Severe 7 d/yr ≥104°F today · 16 d/yr by 30 yrs out
- Wind 1/10 Low
- Air quality 10/10 Extreme 33 unhealthy d/yr today · 37 by 30 yrs out
Nearby sold comps map
Loading sold comps map…
Walkable amenities ~0.75 mi
Loading nearby amenities…
Taxation est. · year 1
- Rental income
- $33,877
- − Mortgage interest
- −$11,483
- − Property taxes
- −$3,075
- − Insurance
- −$1,025
- − Repairs & maintenance
- −$2,710
- − Management
- −$2,710
- − Depreciation
- −$5,964
- Taxable income
- $6,910
- Est. tax owed @ 24.0%
- −$1,658
- After-tax cash flow
- $8,104/yr
For passive investors: Depreciation is non-cash, so a rental often shows a tax loss while cash-flowing — sheltering income. Rental losses are passive: they offset passive income freely, and up to $25,000/yr can offset ordinary (W-2) income if you actively participate and your MAGI is under $100k (phasing out to $0 by $150k); unused losses carry forward. On sale, claimed depreciation is recaptured at up to 25%, and gains may owe capital-gains tax (a 1031 exchange can defer both). Figures are a year-1 estimate at your 24.0% rate — not tax advice; consult a CPA.
Condition & rehab AI · 1 photo
This move-in-ready manufactured home is in excellent condition with no visible repairs needed. It offers a great value with potential for minor updates to enhance its curb appeal and interior aesthetics.
Value-add opportunities
- Both Painting exterior and interior — Fresh paint enhances curb appeal and interior aesthetics
- Both Landscaping improvements — Enhances curb appeal and adds value
- Both New flooring in bathrooms and kitchen — Modern flooring improves aesthetics and adds value
- Both New appliances — Top-of-the-line appliances enhance functionality and attract buyers
Renovation cost estimate screening
Value-add ROI direction
- Both Painting exterior and interior — Fresh paint enhances curb appeal and interior aesthetics ↑
- Both Landscaping improvements — Enhances curb appeal and adds value ↑
- Both New flooring in bathrooms and kitchen — Modern flooring improves aesthetics and adds value ↑
- Both New appliances — Top-of-the-line appliances enhance functionality and attract buyers ↑
ⓘ Cost ranges are severity-bucket heuristics (US national rule-of-thumb). Get contractor quotes + a written scope before underwriting a rehab budget.
Schools (NCES district)
- District
- Roseville Joint Union High
- NCES district ID
- 0633630
- Math proficiency
- 42% ▼ -6.00%
- Reading proficiency
- 71% ▼ -3.00%
- Median HH income
- $81,930
- Composite
- 51.11/100
- National rank
- #1763
- State rank
- #86 of 517 in CA
Livability — Roseville
- Score
- 77/100
- State rank
- #90
- US rank
- #3239
Category grades
Schools grade is shown separately in the Schools card above.
Census & demographics
- Census place
- Roseville, CA
- County
- Placer County · 390,510 people
- City population
- 161,837
- Metro
- Sacramento-Roseville-Folsom, CA
- Population (ZIP)
- 45,346
- Household income
- $100,554
- Rent vs Own
- Severe rent burden
- 2544.0
Population outlook (Placer County) Hauer SSP2
- Today (2025)
- 422,709 people
- By 2030
- 444,249 · +5.1%
- By 2040
- 480,192 · +13.6%
- By 2050
- 506,390 · +19.8%
- By 2075
- 550,219 · +30.2%
- By 2100
- 547,760 · +29.6%
Race, ethnicity, and origin ACS 2023
- Neighborhood character
- Diverse neighborhood (Simpson 0.58)
- Race & ethnicity
- White 60% Hispanic / Latino 23% Two or more races 17% Asian 8% Black 2%
- Hispanic origin (detail)
- Mexican 16% Puerto Rican 1%
- Common ancestry
- Russian 3% Slovak 2% Italian 2%
- Foreign-born
- 14% · Canada, China, South Korea
- Languages at home
- 79% English-only · Spanish 10% Other Indo-European 4% Russian/Polish/Slavic 2%
Political lean MEDSL · Placer
- 2024 margin
- Lean R (+8.5) · D 44.3% · R 52.8% · Other 2.9%
- 2008→2024 swing
- +2.8pp toward D · 2008: -11.3pp · 2024: -8.5pp
- All cycles
- 2024: R+8.5 2020: R+6.7 2016: R+11.3 2012: R+20.1 2008: R+11.3
Not yet ingested
- Civics
- —
Market trends
- HPI YoY
- ▼ -418.46%
- Current HPI
- 272.0182
- Rent YoY
- ▲ 1.75%
- Metro
- Sacramento-Roseville-Folsom, CA
- State GDP YoY
- ▲ 3.21%
- F500 in state
- 116
Industry mix (Fortune 500 HQ in CA)
| Industry | F500 HQs | Revenue |
|---|---|---|
| Technology | 27 | $1,492B |
|
||
| Financial Services | 3 | $174B |
|
||
| Retail | 3 | $44B |
|
||
| Insurance | 3 | $26B |
|
||
| Media / Entertainment | 2 | $115B |
|
||
| Pharmaceuticals / Biotech | 2 | $62B |
|
||
Cash-flow waterfall
monthlySold comps — $/sqft
last 12 mo · ≤1 miLoading sold comps…