8146 Market · Stinesville, IN
Flood risk 1/10 · Minimal
- FEMA flood zone
- X (unshaded)
- Chance of flooding over 30 yrs
- 0.0%
- Est. flood insurance / yr
- $507 – $1,088
Fire risk 2/10 · Minimal
- Est. fire insurance / yr
- $717 – $1,331
Heat risk 4/10 · Minor
- Hot days now (above 103°F)
- 7 days/yr
- Hot days in 30 yrs
- 18 days/yr
Wind risk 2/10 · Minimal
- Chance of severe wind over 30 yrs
- 0.0%
Air-quality risk 2/10 · Minimal
- Unhealthy air days now
- 1 days/yr
- Unhealthy air days in 30 yrs
- 2 days/yr
Risk factors via First Street. Map © Google.
Why this score? — see what drove the D+ grade
The composite is a weighted blend of 9 inputs, each scored 0–100. Each bar is that input's sub-score; the figure is the points it added to the 100-point composite (weight × sub-score).
- Cash flow +14.7/30.0
- ARV discount +7.5/15.0
- Appreciation +5.0/10.0
- DSCR +4.5/10.0
- Schools +4.0/10.0
- Livability +3.5/5.0
- 1% rule +2.8/10.0
- Rent growth +2.5/5.0
- Condition / age +2.5/5.0
$110,000
🖨 Deal sheet (PDF) 📄 Offer letter ✓ Due diligence
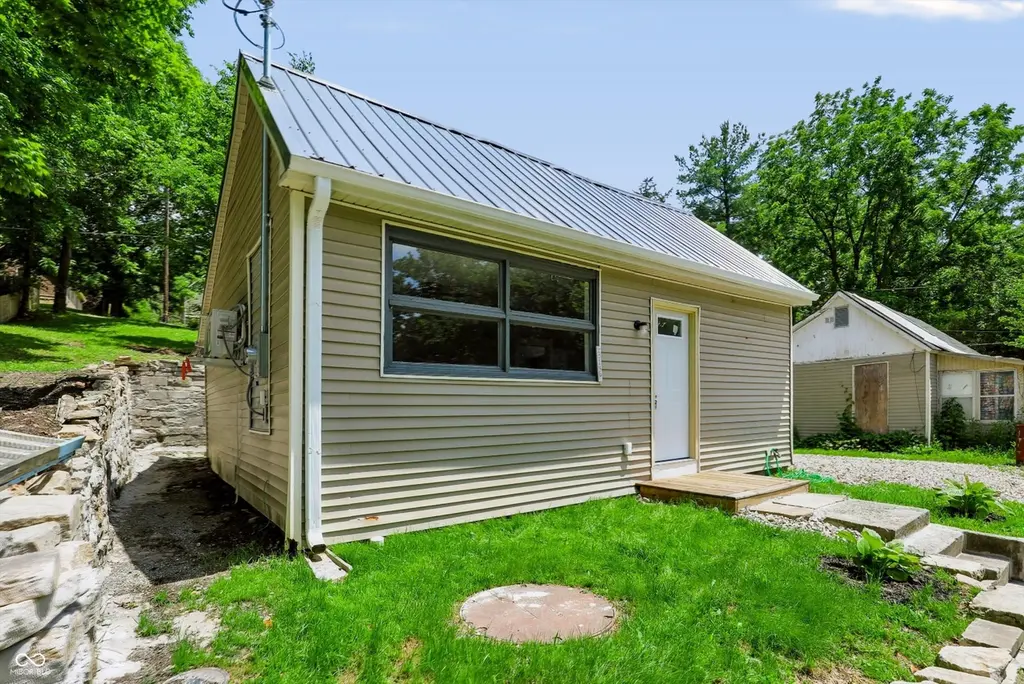
Listing remarks
This home may be small, but it is perfect for someone wanting to enjoy the benefits of homeownership and needs a home that is easy to maintain. The seller has completely remodeled this home and it is move in ready. All kitchen appliances stay and the large bathroom has a washer and dryer hookup. The bedroom just needs a closet or armoire added. There is a block structure that is ideal for lawn mower and yard item storage and a lovely and spacious rear yard with mature trees. The property goes all the way to the alley and is within walking distance or a very short drive to the Stinesville General Store.
Key facts
- 6,098 sq ft lot
- Built 1899
- Listed 8 days
Property features AI
Exterior
- Parking: Gravel parking
- Utilities: Public water; Municipal sewer connected; No solid waste service listed
- Home design: Single-family residence; One level
- Construction: Vinyl siding, wood siding and stone exterior; Block foundation
- Exterior features: Porch; City lot with mature trees; Less than 1/4 acre
Interior
- Kitchen: Microwave; Electric oven; Refrigerator; Tankless water heater
- Bedrooms: 1 bedroom on the main level (approximately 10 x 14)
- Bathrooms: 1 full bathroom with a full shower stall
- Heating & cooling: Electric heating; Heat pump; Central air; Ductless cooling (heat pump)
- Interior features: Eat-in kitchen; Updated/remodeled; Has view; Low-maintenance lifestyle
- Laundry & utility: Dedicated laundry room; Water heater
Neighborhood map
What this means for you Summary
Snapshot
- This is a 2-bed/1.0-bath single-family listed at $110k.
Deal economics
- At list price, monthly cash flow is $29 ($346/yr) — positive.
- The deal already cash-flows at list — no discount required.
- To meet the 1% rule (rent ≥ 1% of price), the offer needs to be $86k (22.2% below list).
- Recommended offer: $86k (22.2% below list) — sets the bar for 1% rule.
Location & tenants
- Location reads 69/100 on livability (#182 in IN) — a middle-class / working-renter tenant base. Strengths: cost of living A+, housing A+, health & safety A+; Watch: crime C-, amenities F, commute F.
- Richland-Bean Blossom Community School Corporation (suburban): math 41% / reading 52% proficiency, ranked #82 of 301 in IN (top 27%) — families likely to look elsewhere, expect single-tenant / working-renter base with shorter leases.
- Zoned schools: Edgewood Junior High School (math 30% / reading 51%, grade F, #117 of 330 statewide, top 36%, 603 students, 40% FRL); Edgewood High School (math 42% / reading 77%, grade C+, #49 of 369 statewide, top 16%, 820 students, 33% FRL).
- Market conditions: 1 active listings in the ZIP; 872 units permitted in Monroe County in 2024 (663 in 5+ unit buildings).
Forward outlook
- In year one you build about $4k of equity ($761 loan paydown + $3k appreciation (3.0% local appreciation)).
- Monroe County population projected at +29% by 2050 — long-run rental-demand tailwind backs the buy-and-hold thesis.
- At projected returns (3.0% appreciation + 3.0% rent growth), your $31k cash investment doubles in ~6 years — after that, you're playing with house money.
- By year 8, paydown + projected appreciation supports a ~$30k cash-out refi (75% LTV) — recoverable capital for the next deal without selling this one.
Negotiation context
- Only 8 days on market — expect competitive offers; lowballing is unlikely to land.
Risks & watch-outs
- Watch-outs: built in 1899 — expect roof / HVAC / electrical / plumbing capex.
Questions for the listing agent
- Built in 1899 — when were the roof, HVAC, electrical panel, plumbing, and water heater last replaced?
- Is there a deadline driving the sale (1031 exchange, divorce, estate, relocation)? That informs how much negotiation room exists.
- Schools are F-rated, which usually means shorter tenancies and higher turnover. Who's the typical renter profile here, and what's been the actual vacancy rate?
- The area grade is low — what's the realistic commute time and amenity access for the typical tenant pool here? Any planned neighborhood developments (good or bad) we should know about?
- What's the average days-on-market for RENTAL listings here right now (not sales)? A rising rental-DOM trend means longer vacancies and softer asking-rent achievability than the comps imply.
- What's the recent tenant-quality profile in this submarket — average credit score on applications, eviction rate, late-payment / NSF rate, and stable-employment percentage? A property-management company in the area should have these aggregated.
- How much new for-sale + rental construction is in the pipeline within 1–3 miles? Heavy new supply typically softens prices + rents 12–24 months out; constrained supply supports both.
Investment metrics
- 1% rule
- 0.78% ✗
- Cap rate
- 6.61%
- Cash-on-cash
- 1.12%
- DSCR
- 1.05
- GRM
- 10.7
CMA / ARV
No comps found within radius.
Projected returns pro-forma
3.0% appreciation · 3.0% rent growth · sell at horizon
- IRR
- 8.5%
- Equity multiple
- 1.49×
- Total profit
- $15,033
- Equity at exit
- $49,461
- IRR
- 11.0%
- Equity multiple
- 2.65×
- Total profit
- $50,878
- Equity at exit
- $76,225
Cash invested: $30,800 (down + closing). Projections, not guarantees.
Landlord ↔ Tenant lean methodology
- Overall (STATE)
- 90 Strongly Landlord-Friendly
- State Indiana
- 90 Strongly Landlord-Friendly · R+11
- County
- — inherits STATE
- City
- — inherits STATE
ZIP-level market 47464
- Active inventory
- 1
- Price-to-rent
- 10.7×
Monthly cashflow live
- Estimated rent
- $856 medium interval (Pro) →
- Mortgage (P&I)
- −$577
- Tax from tax record
- −$24 /mo · $292/yr
- Insurance
- −$46
- HOA
- −$0
- Vacancy / Maint / Mgmt
- −$180
- Net cashflow
- $29
Break-even live
Sensitivity live
| Price | -10% $91 | -5% $60 | +0% $29 | +5% $-2 | +10% $-33 |
|---|---|---|---|---|---|
| Rent | -10% $-39 | -5% $-5 | +0% $29 | +5% $63 | +10% $96 |
| Rate | -1.0pp $84 | -0.5pp $57 | base $29 | +0.5pp $0 | +1.0pp $-29 |
UW: 25.0% down · 7.5% · 30yr · 1.5% tax · 5.0% vac · 8.0% maint · 8.0% mgmt
Financing live
Cash to close
- Down payment
- $27,500
- Closing costs
- $3,300
- Reserves months
- —
- Total cash needed
- —
Loan-product check · same deal, 3 products live
Conventional
25% down · 7.5% · 30yr
- Down + closing
- —
- Monthly P&I
- —
- Monthly cashflow
- —
- DSCR
- —
- Eligible?
- —
Personal DTI + credit; lowest rate.
DSCR
20% down · 8.5% · 30yr
- Down + closing
- —
- Monthly P&I
- —
- Monthly cashflow
- —
- DSCR
- —
- Eligible?
- —
No personal income docs; deal must DSCR.
Hard money
10% down · 12.0% · 12mo
- Down + closing
- —
- Monthly P&I
- —
- Monthly cashflow
- —
- DSCR
- —
- Eligible?
- —
Short-term bridge; refi at stabilization.
Listing history 9 events
-
2026-06-22days on market $110,000 Active 8 DOM
-
2026-06-19days on market $110,000 Active 6 DOM
-
2026-06-18days on market $110,000 Active 5 DOM
-
2026-06-17days on market $110,000 Active 4 DOM
-
2026-06-17remarks 609-char remark
-
2026-06-16days on market $110,000 Active 3 DOM
-
2026-06-15days on market $110,000 Active 2 DOM
-
2026-06-14remarks 496-char remark
-
2026-06-14$110,000 Active 1 DOM
ⓘ Source: listings_history table (triggers on properties + properties_extension) + one-shot
backfill from property_details.listing_events for pre-trigger history.
Tax reassessment forecast IN · Partial reset (capped growth)
- Current annual tax
- $292 · $24/mo
- Projected year-2 tax
- $613 · $51/mo
- Expected delta
- +$322/yr (+$27/mo · 110.1%)
ⓘ Screening estimate from a state-policy table — verify with the county assessor before closing.
Climate risk First Street
- Flood 1/10 Low FEMA zone X (unshaded) · 0% chance over 30 yrs
- Wildfire 2/10 Low
- Heat 4/10 Moderate 7 d/yr ≥103°F today · 18 d/yr by 30 yrs out
- Wind 2/10 Low 0% chance of damaging wind over 30 yrs
- Air quality 2/10 Low 1 unhealthy d/yr today · 2 by 30 yrs out
Nearby sold comps map
Loading sold comps map…
Walkable amenities ~0.75 mi
Loading nearby amenities…
Taxation est. · year 1
- Rental income
- $10,266
- − Mortgage interest
- −$6,162
- − Property taxes
- −$292
- − Insurance
- −$550
- − Repairs & maintenance
- −$821
- − Management
- −$821
- − Depreciation
- −$3,200
- Taxable loss
- −$1,580
- Est. tax savings @ 24.0%
- +$379
- After-tax cash flow
- $725/yr
For passive investors: Depreciation is non-cash, so a rental often shows a tax loss while cash-flowing — sheltering income. Rental losses are passive: they offset passive income freely, and up to $25,000/yr can offset ordinary (W-2) income if you actively participate and your MAGI is under $100k (phasing out to $0 by $150k); unused losses carry forward. On sale, claimed depreciation is recaptured at up to 25%, and gains may owe capital-gains tax (a 1031 exchange can defer both). Figures are a year-1 estimate at your 24.0% rate — not tax advice; consult a CPA.
Schools (NCES district)
- District
- Richland-Bean Blossom Community School Corporation
- NCES district ID
- 1809480
- Math proficiency
- 41% ▼ -15.00%
- Reading proficiency
- 52% ▼ -8.00%
- Median HH income
- $53,816
- Composite
- 40.21/100
- National rank
- #3780
- State rank
- #82 of 301 in IN
Livability — Stinesville
- Score
- 69/100
- State rank
- #182
- US rank
- #8402
Category grades
Schools grade is shown separately in the Schools card above.
Census & demographics
- Census place
- Stinesville, IN
- City population
- 316
- Population (ZIP)
- 316
Population outlook (Monroe County) Hauer SSP2
- Today (2025)
- 160,645 people
- By 2030
- 170,174 · +5.9%
- By 2040
- 188,326 · +17.2%
- By 2050
- 206,892 · +28.8%
- By 2075
- 256,650 · +59.8%
- By 2100
- 303,242 · +88.8%
Race, ethnicity, and origin ACS 2023
- Neighborhood character
- Predominantly White (88%)
- Race & ethnicity
- White 88% Two or more races 12% Hispanic / Latino 10%
- Hispanic origin (detail)
- Common ancestry
- Iranian 3% Slovak 2% Serbian 1%
Political lean MEDSL · Monroe
- 2024 margin
- Strong D (+27.4) · D 63.0% · R 35.5% · Other 1.5%
- 2008→2024 swing
- -4.7pp toward R · 2008: 32.2pp · 2024: 27.4pp
- All cycles
- 2024: D+27.4 2020: D+28.2 2016: D+23.7 2012: D+16.5 2008: D+32.2
Not yet ingested
- Civics
- —
Market trends
- HPI YoY
- —
- Current HPI
- —
- Rent YoY
- —
- Metro
- —
- State GDP YoY
- ▲ 2.90%
- F500 in state
- 18
Industry mix (Fortune 500 HQ in IN)
| Industry | F500 HQs | Revenue |
|---|---|---|
| Industrial Machinery | 2 | $37B |
|
||
| Healthcare | 1 | $177B |
|
||
| Pharmaceuticals | 1 | $45B |
|
||
| Metals / Steel | 1 | $18B |
|
||
| Agriculture | 1 | $17B |
|
||
| Packaging | 1 | $12B |
|
||
Price history
1 event — show timeline
- 2026-06-12 Listed $110,000 MIBOR as Distributed by MLS Grid
Property tax history
+5.3%/yrLatest (2024): $292 · -1.2% YoY. Source: county tax records.
Cash-flow waterfall
monthlySold comps — $/sqft
last 12 mo · ≤1 miLoading sold comps…