112 W London Dr · San Marcos, TX
Flood risk No data
- FEMA flood zone
- —
- Chance of flooding over 30 yrs
- —
- Est. flood insurance / yr
- —
Fire risk No data
- Est. fire insurance / yr
- —
Heat risk No data
- Hot days now (above threshold)
- —
- Hot days in 30 yrs
- —
Wind risk No data
- Chance of severe wind over 30 yrs
- —
Air-quality risk No data
- Unhealthy air days now
- —
- Unhealthy air days in 30 yrs
- —
Risk factors via First Street. Map © Google.
Why this score? — see what drove the D- grade
The composite is a weighted blend of 9 inputs, each scored 0–100. Each bar is that input's sub-score; the figure is the points it added to the 100-point composite (weight × sub-score).
- Cash flow +10.0/30.0
- ARV discount +7.5/15.0
- Appreciation +4.5/10.0
- Livability +4.0/5.0
- 1% rule +3.2/10.0
- DSCR +2.8/10.0
- Condition / age +2.5/5.0
- Schools +2.4/10.0
- Rent growth +1.2/5.0
$243,990
🖨 Deal sheet (PDF) 📄 Offer letter ✓ Due diligence
Listing remarks
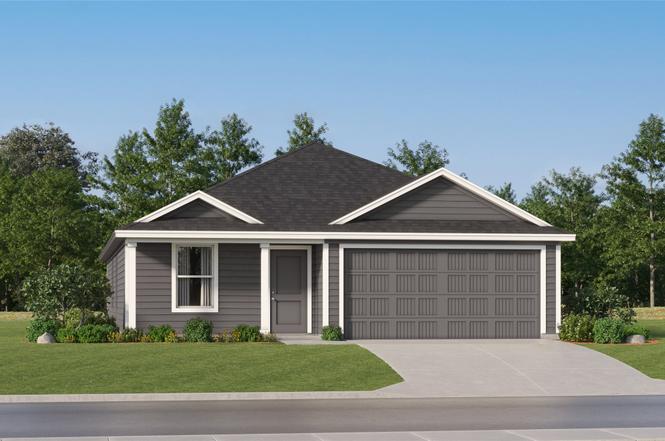
The Ramsey - This new single-story home boasts a low-maintenance design ideal for modern lifestyles. An open-concept layout combines the kitchen, living and dining areas to encourage seamless transitions and multitasking. Three bedrooms are located near the front of the home, with a luxurious owner’s suite at the back of the home, complete with a full bathroom and walk-in closet. Photos are for illustrative purposes only. Estimated Completion September 2026. The completion date, prices and features may vary and are subject to change. Please verify with Lennar directly.
Key facts
- 5,401 sq ft lot
- 2 garage spots
- Community pool
Property features AI
Finance
- HOA & community: Community association (Cotton Gateway HOA) with monthly fee; Association fee: $45 per month; Fee includes common area maintenance; Community amenities: park, pool
Exterior
- Parking: Attached garage; 2 covered parking spaces (2 total)
- Utilities: Electricity available; Public water; Public sewer (connected)
- Home design: Single-story home; Under construction; Southeast-facing
- Construction: Built by Lennar; Brick, cement siding and stone exterior; Composition roof; Slab foundation; Built by builder source
- Exterior features: Private yard; Porch; Privacy fencing; Back yard; Front yard; Interior lot
Interior
- Kitchen: Dishwasher; Range
- Bedrooms: 4 main-level bedrooms
- Flooring: Carpet; Vinyl
- Bathrooms: 2 full bathrooms
- Heating & cooling: Central heating; Central air conditioning
- Interior features: Main level primary suite; Open floor plan; Walk-in closets
- Laundry & utility: Dedicated laundry room
Neighborhood map
What this means for you Summary
Snapshot
- This is a 4-bed/2.0-bath land listed at $244k.
Deal economics
- At list price, monthly cash flow is $-148 ($-2k/yr) — negative.
- To cash-flow at today's rent, offer at most $223k (8.8% below list).
- To meet the 1% rule (rent ≥ 1% of price), the offer needs to be $200k (17.8% below list).
- Recommended offer: $200k (17.8% below list) — sets the bar for 1% rule.
- Cap rate 5.6% vs local median 3.1% in San Marcos — top-decile yield for the area; either an underpriced asset or a hidden risk that comps aren't pricing in. Stress-test before assuming the spread holds.
Location & tenants
- Location reads 81/100 on livability (#30 in TX, #1,601 nationally) — a professional / high-income tenant draw. Strengths: amenities A+, cost of living A+, health & safety A+; Watch: crime D+, schools F, employment F.
- Lockhart ISD (town): math 27% / reading 29% proficiency, ranked #657 of 826 in TX (top 80%) — low school quality limits family demand, transient renter base, plan for 1-2y turnover; 62% free/reduced lunch — lower-income household profile, screen leases tightly.
- Market conditions: Rents falling (-5.4%/yr); 307 active listings in the ZIP; 39 comparable units currently listed for rent nearby; rentals at typical pace (median 19d on market — plan ~3-4 weeks tenant-placement turnaround); solid renter incomes; 529 units permitted in Caldwell County in 2024 (6 in 5+ unit buildings).
Forward outlook
- Local home prices are declining (-1.0%/yr); year-one equity from $2k of loan paydown is wiped out by about $2k of value loss. Plan a longer hold.
- Caldwell County population projected at +33% by 2050 — long-run rental-demand tailwind backs the buy-and-hold thesis.
Negotiation context
- Only 8 days on market — expect competitive offers; lowballing is unlikely to land.
Questions for the listing agent
- What do current leases actually rent for vs. the listed asking? Can we see a recent rent roll and the last 12 months of T-12 income?
- What does the HOA fee cover, when was the last increase, and are there any pending special assessments or reserve-fund shortfalls?
- Is there a deadline driving the sale (1031 exchange, divorce, estate, relocation)? That informs how much negotiation room exists.
- Schools are F-rated, which usually means shorter tenancies and higher turnover. Who's the typical renter profile here, and what's been the actual vacancy rate?
- Crime grade is D in this area — have there been break-ins, vandalism, or insurance claims at this property in the last 3 years? What carrier currently insures it and at what premium?
- The area grade is low — what's the realistic commute time and amenity access for the typical tenant pool here? Any planned neighborhood developments (good or bad) we should know about?
- What's the average days-on-market for RENTAL listings here right now (not sales)? A rising rental-DOM trend means longer vacancies and softer asking-rent achievability than the comps imply.
- What's the recent tenant-quality profile in this submarket — average credit score on applications, eviction rate, late-payment / NSF rate, and stable-employment percentage? A property-management company in the area should have these aggregated.
- How much new for-sale + rental construction is in the pipeline within 1–3 miles? Heavy new supply typically softens prices + rents 12–24 months out; constrained supply supports both.
Investment metrics
- 1% rule
- 0.82% ✗
- Cap rate
- 5.57%
- Cash-on-cash
- -2.59%
- DSCR
- 0.88
- GRM
- 10.1
CMA / ARV
No comps found within radius.
Projected returns pro-forma
-1.02% appreciation · 0.0% rent growth · sell at horizon
- IRR
- -11.8%
- Equity multiple
- 0.50×
- Total profit
- $-33,860
- Equity at exit
- $58,607
- IRR
- -7.9%
- Equity multiple
- 0.35×
- Total profit
- $-44,463
- Equity at exit
- $61,295
Cash invested: $68,317 (down + closing). Projections, not guarantees.
Landlord ↔ Tenant lean methodology
- Overall (STATE)
- 87 Strongly Landlord-Friendly
- State Texas
- 87 Strongly Landlord-Friendly · R+5
- County
- — inherits STATE
- City
- — inherits STATE
ZIP-level market 78656
- Home prices YoY
- -0.5%
- Rents YoY
- -5.4%
- Active inventory
- 307
- Price-to-rent
- 10.1×
Monthly cashflow live
- Estimated rent
- $2,005 high interval (Pro) →
- Mortgage (P&I)
- −$1,280
- Tax est. 1.5%
- −$305 /mo · $3,660/yr
- Insurance
- −$102
- HOA
- −$45
- Vacancy / Maint / Mgmt
- −$421
- Net cashflow
- $-148
Break-even live
Sensitivity live
| Price | -10% $21 | -5% $-63 | +0% $-148 | +5% $-232 | +10% $-316 |
|---|---|---|---|---|---|
| Rent | -10% $-306 | -5% $-227 | +0% $-148 | +5% $-68 | +10% $11 |
| Rate | -1.0pp $-25 | -0.5pp $-86 | base $-148 | +0.5pp $-211 | +1.0pp $-275 |
UW: 25.0% down · 7.5% · 30yr · 1.5% tax · 5.0% vac · 8.0% maint · 8.0% mgmt
Financing live
Cash to close
- Down payment
- $60,998
- Closing costs
- $7,320
- Reserves months
- —
- Total cash needed
- —
Loan-product check · same deal, 3 products live
Conventional
25% down · 7.5% · 30yr
- Down + closing
- —
- Monthly P&I
- —
- Monthly cashflow
- —
- DSCR
- —
- Eligible?
- —
Personal DTI + credit; lowest rate.
DSCR
20% down · 8.5% · 30yr
- Down + closing
- —
- Monthly P&I
- —
- Monthly cashflow
- —
- DSCR
- —
- Eligible?
- —
No personal income docs; deal must DSCR.
Hard money
10% down · 12.0% · 12mo
- Down + closing
- —
- Monthly P&I
- —
- Monthly cashflow
- —
- DSCR
- —
- Eligible?
- —
Short-term bridge; refi at stabilization.
Rent comps 39 comps
| Address | Beds | Baths | Sqft | Rent | $/sqft | DOM | Units | Dist |
|---|---|---|---|---|---|---|---|---|
| 531 Paris St Maxwell, TX | 4.0 | 2.0 | 1667 | $1,950 | $1.17 | 2d | 1 | 0.25mi |
| 205 E Lima Dr Maxwell, TX | 4.0 | 2.0 | 1600 | $1,999 | $1.25 | 24d | 1 | 0.34mi |
| 351 Cobb Branch Dr Maxwell, TX | 3.0–4.0 | 2.0–3.0 | 1616 | $1,912 | $1.18 | 2d | 4 | 0.67mi |
| 275 Aplite Pass Maxwell, TX | 2.0–5.0 | 2.0–3.5 | 1733 | $2,420 | $1.40 | 2d | 1 | 0.68mi |
| 283 Soapstone Pass Maxwell, TX | 3.0 | 2.0 | 1440 | $1,609 | $1.12 | 17d | 1 | 0.83mi |
| 312 Soapstone Pass Maxwell, TX | 3.0 | 2.0 | 1450 | $1,600 | $1.10 | 44d | 1 | 0.85mi |
| 253 Fairlawn Way Maxwell, TX | 3.0 | 2.5 | 1919 | $2,235 | $1.16 | 24d | 1 | 0.87mi |
| 328 Mica Trl Maxwell, TX | 4.0 | 2.0 | 1627 | $1,595 | $0.98 | 44d | 1 | 0.94mi |
| 300 Geode Gln Maxwell, TX | 4.0 | 2.5 | 1712 | $1,795 | $1.05 | 44d | 1 | 0.96mi |
| 566 Gabbro Gdns Maxwell, TX | 4.0 | 2.5 | 1837 | $1,850 | $1.01 | 17d | 1 | 0.96mi |
| 192 Gabbro Gdns Maxwell, TX | 4.0 | 2.5 | 1610 | $1,699 | $1.06 | 44d | 1 | 0.97mi |
| 171 Haywood Mnr Maxwell, TX | 3.0 | 2.0 | 1533 | $1,850 | $1.21 | 5d | 1 | 0.97mi |
| 147 Gabbro Gdns Maxwell, TX | 3.0 | 2.0 | 1450 | $1,441 | $0.99 | 44d | 1 | 0.98mi |
| 230 Gabbro Gdns Maxwell, TX | 3.0 | 2.0 | 1440 | $1,500 | $1.04 | 18d | 1 | 0.98mi |
| 543 Gabbro Gdns Maxwell, TX | 4.0 | 2.0 | 1627 | $1,695 | $1.04 | 22d | 1 | 1.00mi |
| 124 Hidden Branch Cv Maxwell, TX | 3.0 | 2.5 | 1698 | $1,845 | $1.09 | 5d | 1 | 1.06mi |
| 427 Gabbro Gdns Maxwell, TX | 3.0 | 2.0 | 1402 | $1,550 | $1.11 | 44d | 1 | 1.07mi |
| 108 White Dunes Dr Maxwell, TX | 3.0 | 2.0 | 1514 | $1,800 | $1.19 | 18d | 1 | 1.09mi |
| 108 White Dunes Dr Maxwell, TX | 3.0 | 2.0 | 1514 | $1,800 | $1.19 | 5d | 1 | 1.09mi |
| 108 White Dunes Dr Maxwell, TX | 3.0 | 2.0 | 1514 | $1,800 | $1.19 | 24d | 1 | 1.09mi |
| 146 White Dunes Dr Maxwell, TX | 3.0 | 2.5 | 1698 | $1,850 | $1.09 | 12d | 1 | 1.10mi |
| 146 White Dunes Dr Maxwell, TX | 3.0 | 2.0 | 1698 | $1,850 | $1.09 | 44d | 1 | 1.11mi |
| 170 White Dunes Dr Maxwell, TX | 3.0 | 3.0 | 2122 | $1,795 | $0.85 | 5d | 1 | 1.11mi |
| 170 White Dunes Dr Maxwell, TX | 3.0 | 2.5 | 2122 | $1,795 | $0.85 | 18d | 1 | 1.11mi |
| 342 Jade St Maxwell, TX | 4.0 | 2.5 | 2072 | $1,975 | $0.95 | 44d | 1 | 1.14mi |
| 296 Agate Cliff Dr Maxwell, TX | 3.0 | 2.0 | 1421 | $1,695 | $1.19 | 12d | 1 | 1.16mi |
| 251 Tempest Trl Maxwell, TX | 3.0 | 2.0 | 1553 | $1,650 | $1.06 | 18d | 1 | 1.18mi |
| 444 Delta Crst Maxwell, TX | 3.0 | 2.5 | 1830 | $1,850 | $1.01 | 5d | 1 | 1.18mi |
| 274 Jade St Maxwell, TX | 4.0 | 2.0 | 1468 | $1,795 | $1.22 | 44d | 1 | 1.20mi |
| 151 Living Reef Dr Maxwell, TX | 3.0 | 2.5 | 1782 | $1,895 | $1.06 | 5d | 1 | 1.22mi |
| 293 Tempest Trl Maxwell, TX | 3.0 | 2.5 | 1698 | $1,825 | $1.07 | 5d | 1 | 1.22mi |
| 195 Living Reef Dr Maxwell, TX | 3.0 | 2.5 | 1782 | $1,900 | $1.07 | 5d | 1 | 1.23mi |
| 211 Living Reef Dr Maxwell, TX | 3.0 | 2.5 | 1782 | $1,840 | $1.03 | 18d | 1 | 1.23mi |
| 170 Living Reef Dr Maxwell, TX | 3.0 | 2.0 | 1500 | $1,850 | $1.23 | 44d | 1 | 1.25mi |
| 214 Kyanite Dr Maxwell, TX | 4.0 | 2.5 | 1535 | $1,650 | $1.07 | 44d | 1 | 1.32mi |
| 1413 Soapstone Pass Maxwell, TX | 4.0 | 3.0 | 1952 | $2,500 | $1.28 | 44d | 1 | 1.32mi |
| 839 Gully St Maxwell, TX | 2.0–4.0 | 2.0 | 1105 | $1,832 | $1.66 | 2d | 306 | 1.37mi |
| 704 Delta Crst Maxwell, TX | 3.0–5.0 | 2.0–3.0 | 1904 | $1,759 | $0.92 | 2d | 15 | 1.44mi |
| 1259 Delta Crst Maxwell, TX | 4.0 | 2.0 | 1522 | $1,695 | $1.11 | 18d | 1 | 1.50mi |
HOA detail
- Monthly dues
- $45 · $540/yr
Listing history 6 events
-
2026-06-18days on market $243,990 Active 8 DOM
-
2026-06-17days on market $243,990 Active 7 DOM
-
2026-06-16days on market $243,990 Active 6 DOM
-
2026-06-15days on market $243,990 Active 5 DOM
-
2026-06-13remarks 575-char remark
-
2026-06-13$243,990 Active 3 DOM
ⓘ Source: listings_history table (triggers on properties + properties_extension) + one-shot
backfill from property_details.listing_events for pre-trigger history.
Nearby sold comps map
Loading sold comps map…
Walkable amenities ~0.75 mi
Loading nearby amenities…
Taxation est. · year 1
- Rental income
- $24,054
- − Mortgage interest
- −$13,667
- − Property taxes
- −$3,660
- − Insurance
- −$1,220
- − Repairs & maintenance
- −$1,924
- − Management
- −$1,924
- − HOA
- −$540
- − Depreciation
- −$7,098
- Taxable loss
- −$5,979
- Est. tax savings @ 24.0%
- +$1,435
- After-tax cash flow
- $-336/yr
For passive investors: Depreciation is non-cash, so a rental often shows a tax loss while cash-flowing — sheltering income. Rental losses are passive: they offset passive income freely, and up to $25,000/yr can offset ordinary (W-2) income if you actively participate and your MAGI is under $100k (phasing out to $0 by $150k); unused losses carry forward. On sale, claimed depreciation is recaptured at up to 25%, and gains may owe capital-gains tax (a 1031 exchange can defer both). Figures are a year-1 estimate at your 24.0% rate — not tax advice; consult a CPA.
Schools (NCES district)
- District
- Lockhart ISD
- NCES district ID
- 4827870
- Math proficiency
- 27% ▼ -12.00%
- Reading proficiency
- 29% ▼ -2.00%
- Median HH income
- $48,868
- Composite
- 24.44/100
- National rank
- #7674
- State rank
- #657 of 826 in TX
Livability — San Marcos
- Score
- 81/100
- State rank
- #30
- US rank
- #1601
Category grades
Schools grade is shown separately in the Schools card above.
Census & demographics
- County
- Caldwell County · 25,195 people
- City population
- 88,583
- Metro
- Austin-Round Rock-Georgetown, TX
- Population (ZIP)
- 2,847
- Household income
- $81,346
- Rent vs Own
- Severe rent burden
- 89.0
Population outlook (Caldwell County) Hauer SSP2
- Today (2025)
- 46,557 people
- By 2030
- 49,673 · +6.7%
- By 2040
- 55,827 · +19.9%
- By 2050
- 61,832 · +32.8%
- By 2075
- 77,212 · +65.8%
- By 2100
- 89,225 · +91.6%
Race, ethnicity, and origin ACS 2023
- Neighborhood character
- Predominantly Hispanic (76%)
- Race & ethnicity
- Hispanic / Latino 76% Two or more races 21% White 20% Black 4%
- Hispanic origin (detail)
- Mexican 72%
- Common ancestry
- Romanian 4% Slovak 2% Lithuanian 1%
- Foreign-born
- 18% · Canada
- Languages at home
- 45% English-only · Spanish 55%
Political lean MEDSL · Caldwell
- 2024 margin
- R (+14.4) · D 42.2% · R 56.6% · Other 1.2%
- 2008→2024 swing
- -8.4pp toward R · 2008: -6.0pp · 2024: -14.4pp
- All cycles
- 2024: R+14.4 2020: R+9.1 2016: R+15.8 2012: R+11.1 2008: R+6.0
Not yet ingested
- Civics
- —
Market trends
- HPI YoY
- ▼ -1.02%
- Current HPI
- 228.3622
- Rent YoY
- ▼ -5.36%
- Metro
- Austin-Round Rock-Georgetown, TX
- State GDP YoY
- ▲ 3.95%
- F500 in state
- 110
Industry mix (Fortune 500 HQ in TX)
| Industry | F500 HQs | Revenue |
|---|---|---|
| Energy | 16 | $1,198B |
|
||
| Technology | 5 | $198B |
|
||
| Engineering / Construction | 4 | $72B |
|
||
| Energy Services | 3 | $60B |
|
||
| Utilities | 3 | $41B |
|
||
| Healthcare | 2 | $330B |
|
||
Price history
1 event — show timeline
- 2026-06-10 Listed $243,990 Unlock MLS
Cash-flow waterfall
monthlySold comps — $/sqft
last 12 mo · ≤1 miLoading sold comps…