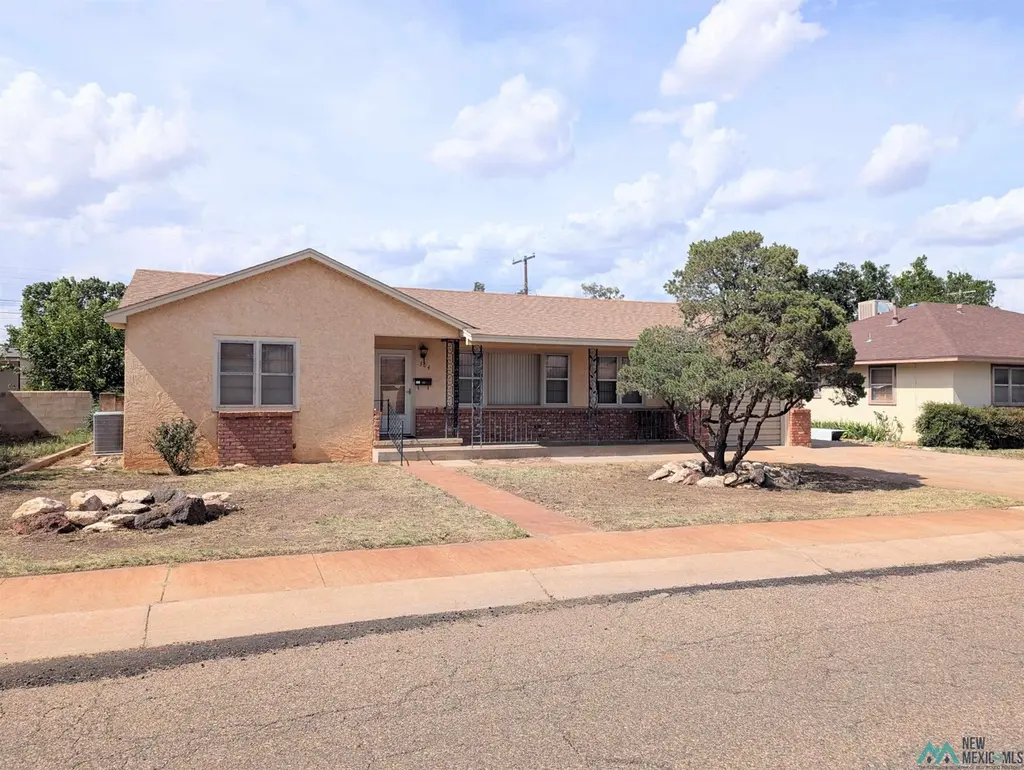
304 W Plains Ave · Clovis, NM
Flood risk 1/10 · Minimal
- FEMA flood zone
- X (unshaded)
- Chance of flooding over 30 yrs
- 0.0%
- Est. flood insurance / yr
- $507 – $1,088
Fire risk 5/10 · Moderate
- Est. fire insurance / yr
- $706 – $1,312
Heat risk 4/10 · Minor
- Hot days now (above 97°F)
- 7 days/yr
- Hot days in 30 yrs
- 20 days/yr
Wind risk 2/10 · Minimal
- Chance of severe wind over 30 yrs
- —
Air-quality risk 1/10 · Minimal
- Unhealthy air days now
- 0 days/yr
- Unhealthy air days in 30 yrs
- 0 days/yr
Risk factors via First Street. Map © Google.
Why this score? — see what drove the B- grade
The composite is a weighted blend of 9 inputs, each scored 0–100. Each bar is that input's sub-score; the figure is the points it added to the 100-point composite (weight × sub-score).
- Cash flow +30.0/30.0
- DSCR +10.0/10.0
- 1% rule +7.9/10.0
- ARV discount +7.5/15.0
- Rent growth +3.9/5.0
- Schools +3.4/10.0
- Livability +2.8/5.0
- Condition / age +2.5/5.0
- Appreciation +0.0/10.0
$119,000
🖨 Deal sheet (PDF) 📄 Offer letter ✓ Due diligence
Listing remarks
You might get lost in this rambling 2000+ square foot home! See floor plan for room placement. Features include covered front porch, living area, formal dining, bonus dining room, laundry room with washer and dryer, kitchen with refrigerator, stove, dishwasher; laundry with desk, shelving, ironing board; separate office, large den, three bedrooms with walk in closets, storage building, and single car garage. There's plenty of built in storage for linens in the bathrooms and hall, plus a built in China cabinet. Located North of Green Acres Park, Highland shopping center, Dairy Queen and Little Caesars Pizza. Come see if this budget friendly home is the one you've been searching for!
Key facts
- Covered front porch
- Bonus dining room
- Separate office
Tags
Property features AI
Exterior
- Parking: Attached garage with garage door opener; 1 covered parking space (1 total parking space)
- Utilities: Public water; Sewer connected; Electricity connected; Natural gas connected; Cable available; Natural gas available
- Home design: Single family residence; One story / single level
- Construction: Brick and stucco exterior; Shingle roof
- Exterior features: Fenced backyard; Shed(s)
Interior
- Kitchen: Dishwasher; Range (free‑standing); Range hood; Refrigerator
- Flooring: Carpet; Vinyl
- Bathrooms: 2 full bathrooms
- Heating & cooling: Central air conditioning; Electric cooling; Forced air heating; Natural gas heating
- Interior features: Ceiling fans; Walk-in closets; Window blinds
- Laundry & utility: Washer; Dryer; Water heater
Neighborhood map
What this means for you Summary
Snapshot
- This is a 3-bed/2.0-bath single-family listed at $119k.
Deal economics
- At list price, monthly cash flow is $483 ($6k/yr) — positive.
- The deal already cash-flows at list — no discount required.
- Meets the 1% rule at list price ($2k rent vs $119k).
- Recommended offer: $117k (1.5% below list) — sets the bar for market timing.
Location & tenants
- Location reads 56/100 on livability (#171 in NM) — a working-class tenant base; expect higher turnover. Strengths: cost of living A+, housing A+; Watch: health & safety C-, crime F, amenities F.
- Clovis Municipal Schools (town): math 31% / reading 49% proficiency, ranked #13 of 29 in NM (top 45%) — families likely to look elsewhere, expect single-tenant / working-renter base with shorter leases; 66% free/reduced lunch — lower-income household profile, screen leases tightly.
- Zoned schools: Highland Elementary (305 students, 100% FRL); Marshall Middle (519 students, 100% FRL); Clovis High (math 31% / reading 49%, grade F, #60 of 110 statewide, top 54%, 1,544 students, 0% FRL) — zoned schools at 67% FRL track the district average.
- Market conditions: Rents rising fast (+5.5%/yr); 473 active listings in the ZIP; 2 comparable units currently listed for rent nearby; 169 units permitted in Curry County in 2024 (0 in 5+ unit buildings).
- This rent runs 32% of the median local income ($57k/yr) — at the standard rent-burdened threshold; future hikes will face affordability resistance.
Forward outlook
- Local home prices are declining (-3.0%/yr); year-one equity from $823 of loan paydown is wiped out by about $4k of value loss. Plan a longer hold.
- Curry County population projected at -13% by 2050 — secular population decline; favor cash flow + early exit over multi-decade hold.
- At projected returns (-3.0% appreciation + 5.5% rent growth), your $33k cash investment doubles in ~6 years — after that, you're playing with house money.
Negotiation context
- It's been on market 15 days — a 2% lower offer ($117k) is reasonable based on typical stale-listing flexibility.
Risks & watch-outs
- Watch-outs: built in 1952 — expect roof / HVAC / electrical / plumbing capex.
- Climate carrying-cost: moderate wildfire risk — expect insurance premiums to compound above CPI over the hold.
Questions for the listing agent
- Built in 1952 — when were the roof, HVAC, electrical panel, plumbing, and water heater last replaced?
- Is there a deadline driving the sale (1031 exchange, divorce, estate, relocation)? That informs how much negotiation room exists.
- Schools are F-rated, which usually means shorter tenancies and higher turnover. Who's the typical renter profile here, and what's been the actual vacancy rate?
- Crime grade is F in this area — have there been break-ins, vandalism, or insurance claims at this property in the last 3 years? What carrier currently insures it and at what premium?
- What's the average days-on-market for RENTAL listings here right now (not sales)? A rising rental-DOM trend means longer vacancies and softer asking-rent achievability than the comps imply.
- What's the recent tenant-quality profile in this submarket — average credit score on applications, eviction rate, late-payment / NSF rate, and stable-employment percentage? A property-management company in the area should have these aggregated.
- How much new for-sale + rental construction is in the pipeline within 1–3 miles? Heavy new supply typically softens prices + rents 12–24 months out; constrained supply supports both.
Investment metrics
- 1% rule
- 1.29% ✓
- Cap rate
- 11.16%
- Cash-on-cash
- 17.39%
- DSCR
- 1.77
- GRM
- 6.5
CMA / ARV
No comps found within radius.
Projected returns pro-forma
-3.0% appreciation · 5.54% rent growth · sell at horizon
- IRR
- 11.4%
- Equity multiple
- 1.46×
- Total profit
- $15,434
- Equity at exit
- $17,743
- IRR
- 22.2%
- Equity multiple
- 3.11×
- Total profit
- $70,206
- Equity at exit
- $10,289
Cash invested: $33,320 (down + closing). Projections, not guarantees.
Landlord ↔ Tenant lean methodology
- Overall (STATE)
- 55 Moderately Landlord-Leaning
- State New Mexico
- 55 Moderately Landlord-Leaning · D+3
- County
- — inherits STATE
- City
- — inherits STATE
ZIP-level market 88101
- Rents YoY
- 5.5%
- Active inventory
- 473
- Price-to-rent
- 6.5×
Monthly cashflow live
- Estimated rent
- $1,529 medium interval (Pro) →
- Mortgage (P&I)
- −$624
- Tax from tax record
- −$52 /mo · $622/yr
- Insurance
- −$50
- HOA
- −$0
- Lot rent
- −$0
- Vacancy / Maint / Mgmt
- −$321
- Net cashflow
- $483
Break-even live
Sensitivity live
| Price | -10% $550 | -5% $516 | +0% $483 | +5% $449 | +10% $415 |
|---|---|---|---|---|---|
| Rent | -10% $362 | -5% $422 | +0% $483 | +5% $543 | +10% $604 |
| Rate | -1.0pp $543 | -0.5pp $513 | base $483 | +0.5pp $452 | +1.0pp $421 |
UW: 25.0% down · 7.5% · 30yr · 1.5% tax · 5.0% vac · 8.0% maint · 8.0% mgmt
Financing live
Cash to close
- Down payment
- $29,750
- Closing costs
- $3,570
- Reserves months
- —
- Total cash needed
- —
Loan-product check · same deal, 3 products live
Conventional
25% down · 7.5% · 30yr
- Down + closing
- —
- Monthly P&I
- —
- Monthly cashflow
- —
- DSCR
- —
- Eligible?
- —
Personal DTI + credit; lowest rate.
DSCR
20% down · 8.5% · 30yr
- Down + closing
- —
- Monthly P&I
- —
- Monthly cashflow
- —
- DSCR
- —
- Eligible?
- —
No personal income docs; deal must DSCR.
Hard money
10% down · 12.0% · 12mo
- Down + closing
- —
- Monthly P&I
- —
- Monthly cashflow
- —
- DSCR
- —
- Eligible?
- —
Short-term bridge; refi at stabilization.
Rent comps 2 comps
| Address | Beds | Baths | Sqft | Rent | $/sqft | DOM | Units | Dist |
|---|---|---|---|---|---|---|---|---|
| 1621 N Lea St Clovis, NM | 3.0 | 2.0 | 1650 | $1,500 | $0.91 | 46d | 1 | 1.14mi |
| 1808 Debra St Clovis, NM | 3.0 | 2.5 | 1412 | $1,400 | $0.99 | 46d | 1 | 1.40mi |
Listing history 14 events
-
2026-06-22status $119,000 Pending 15 DOM
-
2026-06-19days on market $119,000 Active 15 DOM
-
2026-06-18days on market $119,000 Active 14 DOM
-
2026-06-18status $119,000 Active 13 DOM
-
2026-06-17status $119,000 Pending 13 DOM
-
2026-06-16days on market $119,000 Active 13 DOM
-
2026-06-16price $119,000 Active 12 DOM
-
2026-06-15days on market $110,000 Active 12 DOM
-
2026-06-14days on market $110,000 Active 10 DOM
-
2026-06-12days on market $110,000 Active 9 DOM
-
2026-06-09days on market $110,000 Active 6 DOM
-
2026-06-08days on market $110,000 Active 5 DOM
-
2026-06-07remarks 690-char remark
-
2026-06-07$110,000 Active 4 DOM
ⓘ Source: listings_history table (triggers on properties + properties_extension) + one-shot
backfill from property_details.listing_events for pre-trigger history.
Tax reassessment forecast NM · Resets to sale price
- Current annual tax
- $622 · $52/mo
- Projected year-2 tax
- $952 · $79/mo
- Expected delta
- +$330/yr (+$27/mo · 53.0%)
ⓘ Screening estimate from a state-policy table — verify with the county assessor before closing.
Climate risk First Street
- Flood 1/10 Low FEMA zone X (unshaded) · 0% chance over 30 yrs
- Wildfire 5/10 Major
- Heat 4/10 Moderate 7 d/yr ≥97°F today · 20 d/yr by 30 yrs out
- Wind 2/10 Low
- Air quality 1/10 Low 0 unhealthy d/yr today · 0 by 30 yrs out
Nearby sold comps map
Loading sold comps map…
Walkable amenities ~0.75 mi
Loading nearby amenities…
Taxation est. · year 1
- Rental income
- $18,353
- − Mortgage interest
- −$6,666
- − Property taxes
- −$622
- − Insurance
- −$595
- − Repairs & maintenance
- −$1,468
- − Management
- −$1,468
- − Depreciation
- −$3,462
- Taxable income
- $4,071
- Est. tax owed @ 24.0%
- −$977
- After-tax cash flow
- $4,816/yr
For passive investors: Depreciation is non-cash, so a rental often shows a tax loss while cash-flowing — sheltering income. Rental losses are passive: they offset passive income freely, and up to $25,000/yr can offset ordinary (W-2) income if you actively participate and your MAGI is under $100k (phasing out to $0 by $150k); unused losses carry forward. On sale, claimed depreciation is recaptured at up to 25%, and gains may owe capital-gains tax (a 1031 exchange can defer both). Figures are a year-1 estimate at your 24.0% rate — not tax advice; consult a CPA.
Schools (NCES district)
- District
- Clovis Municipal Schools
- NCES district ID
- 3500570
- Math proficiency
- 31% ▲ 6.00%
- Reading proficiency
- 49% ▲ 14.00%
- Median HH income
- $40,532
- Composite
- 33.52/100
- National rank
- #5435
- State rank
- #13 of 29 in NM
Livability — Clovis
- Score
- 56/100
- State rank
- #171
- US rank
- #22374
Category grades
Schools grade is shown separately in the Schools card above.
Census & demographics
- Census place
- Clovis, NM
- County
- Curry County · 44,846 people
- City population
- 44,846
- Metro
- Clovis, NM
- Population (ZIP)
- 44,846
- Household income
- $56,587
- Rent vs Own
- Severe rent burden
- 1724.0
Population outlook (Curry County) Hauer SSP2
- Today (2025)
- 48,742 people
- By 2030
- 47,759 · -2.0%
- By 2040
- 45,444 · -6.8%
- By 2050
- 42,403 · -13.0%
- By 2075
- 33,878 · -30.5%
- By 2100
- 22,414 · -54.0%
Race, ethnicity, and origin ACS 2023
- Neighborhood character
- Diverse neighborhood (Simpson 0.60)
- Race & ethnicity
- Hispanic / Latino 47% White 42% Two or more races 14% Black 5% Asian 2% Native American 1%
- Hispanic origin (detail)
- Mexican 36%
- Common ancestry
- Slovak 2% Romanian 2% Lithuanian 1%
- Foreign-born
- 8% · Canada
- Languages at home
- 73% English-only · Spanish 25%
Political lean MEDSL · Curry
- 2024 margin
- Solid R (+42.6) · D 27.8% · R 70.4% · Other 1.8%
- 2008→2024 swing
- -8.5pp toward R · 2008: -34.1pp · 2024: -42.6pp
- All cycles
- 2024: R+42.6 2020: R+40.6 2016: R+42.4 2012: R+38.6 2008: R+34.1
Not yet ingested
- Civics
- —
Market trends
- HPI YoY
- ▼ -150.79%
- Current HPI
- 121.1877
- Rent YoY
- ▲ 5.54%
- Metro
- Clovis, NM
- State GDP YoY
- —
- F500 in state
- 0
Price history
1 event — show timeline
- 2026-06-03 Listed $110,000 NMMLS
Property tax history
+4.3%/yrLatest (2025): $622 · +3.7% YoY. Source: county tax records.
Cash-flow waterfall
monthlySold comps — $/sqft
last 12 mo · ≤1 miLoading sold comps…