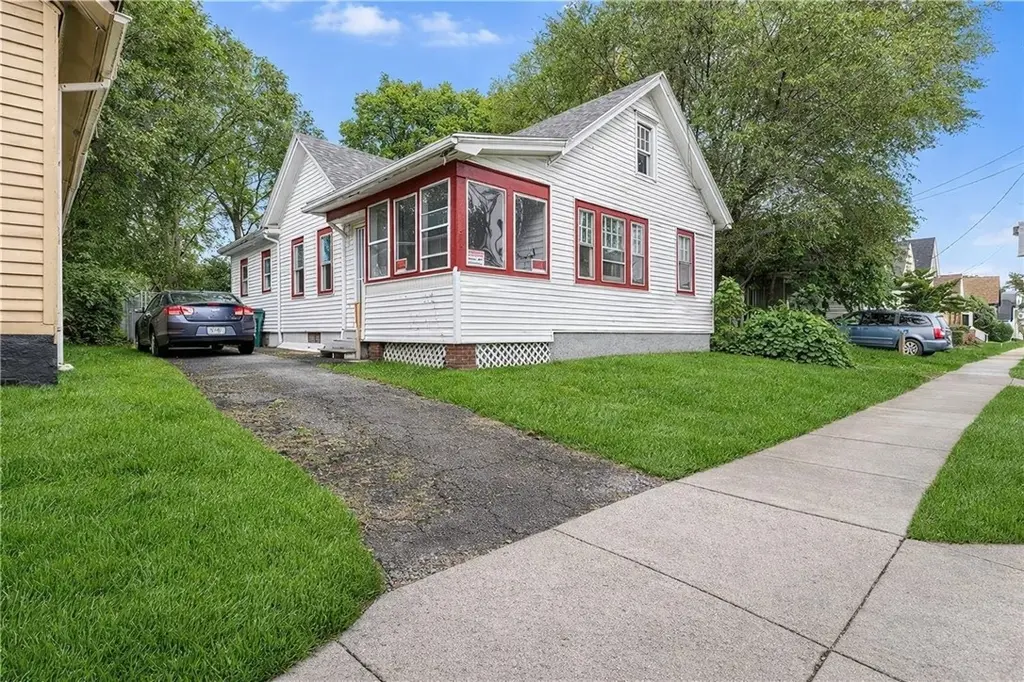
275 Clifford Ave · Rochester, NY
Flood risk 1/10 · Minimal
- FEMA flood zone
- X (unshaded)
- Chance of flooding over 30 yrs
- 0.0%
- Est. flood insurance / yr
- $473 – $860
Fire risk 1/10 · Minimal
- Est. fire insurance / yr
- $691 – $1,283
Heat risk 2/10 · Minimal
- Hot days now (above 95°F)
- 7 days/yr
- Hot days in 30 yrs
- 15 days/yr
Wind risk 1/10 · Minimal
- Chance of severe wind over 30 yrs
- —
Air-quality risk 2/10 · Minimal
- Unhealthy air days now
- 1 days/yr
- Unhealthy air days in 30 yrs
- 2 days/yr
Risk factors via First Street. Map © Google.
Why this score? — see what drove the B+ grade
The composite is a weighted blend of 9 inputs, each scored 0–100. Each bar is that input's sub-score; the figure is the points it added to the 100-point composite (weight × sub-score).
- Cash flow +30.0/30.0
- ARV discount +15.0/15.0
- 1% rule +10.0/10.0
- DSCR +10.0/10.0
- Rent growth +4.7/5.0
- Livability +3.8/5.0
- Condition / age +2.5/5.0
- Schools +1.9/10.0
- Appreciation +0.0/10.0
$60,000
🖨 Deal sheet (PDF) 📄 Offer letter ✓ Due diligence
Listing remarks
Great opportunity for the savvy investor or owner-occupant alike! Charming 3-bedroom ranch located in the heart of Rochester! This home offers easy one-floor living with spacious formal living and dining rooms. Recent improvements include a newer roof, furnace, fresh paint, and new flooring throughout. The full basement provides excellent storage space or potential for future finishing. Enjoy the fully fenced backyard (2024), low-maintenance vinyl siding, and updated mechanicals. Conveniently located near expressways, public transportation, and downtown amenities. No delayed negotiations!
Key facts
- Newer roof
- One-floor living
- New flooring
Tags
Property features AI
Exterior
- Parking: No garage
- Utilities: Electricity available and connected (circuit breakers); High-speed internet available; Public water connected; Sewer connected
- Home design: Single-story home; Resale property
- Construction: Vinyl siding; PEX plumbing; Asphalt shingle roof; Block foundation; Existing (previously built) structure
- Exterior features: Enclosed porch; Front porch; Fully fenced yard; Blacktop driveway; Near public transit; Rectangular residential lot; City street frontage
Interior
- Kitchen: Electric oven; Electric range; Refrigerator
- Bedrooms: Three main-level bedrooms
- Flooring: Luxury vinyl
- Bathrooms: One full bathroom on the main level
- Heating & cooling: Gas forced-air heating; Window air conditioning units
- Interior features: Living/dining room; Primary suite; Main-level primary bedroom; Bedroom on main level; Programmable thermostat
- Laundry & utility: Laundry in basement; Gas water heater
Neighborhood map
What this means for you Summary
Snapshot
- This is a 3-bed/1.0-bath single-family listed at $60k.
Deal economics
- At list price, monthly cash flow is $941 ($11k/yr) — positive.
- The deal already cash-flows at list — no discount required.
- Meets the 1% rule at list price ($2k rent vs $60k).
- Cap rate 25.1% vs local median 9.3% in Rochester — top-decile yield for the area; either an underpriced asset or a hidden risk that comps aren't pricing in. Stress-test before assuming the spread holds.
Location & tenants
- Location reads 76/100 on livability (#222 in NY, #3,482 nationally) — a middle-class / working-renter tenant base. Strengths: commute A+, cost of living A+, housing A+; Watch: schools D+, crime F, employment F.
- Rochester City School District (urban): math 21% / reading 26% proficiency, ranked #589 of 590 in NY (top 100%) — low school quality limits family demand, transient renter base, plan for 1-2y turnover; 82% free/reduced lunch — lower-income household profile, screen leases tightly.
- Market conditions: Rents rising fast (+8.9%/yr); 116 active listings in the ZIP; 40 comparable units currently listed for rent nearby; rentals at typical pace (median 16d on market — plan ~3-4 weeks tenant-placement turnaround); lower-income renter base — watch delinquency; 1,169 units permitted in Monroe County in 2024 (591 in 5+ unit buildings).
- At $1,698/mo this rent would consume 58% of the median local household income ($35k/yr) (locally 2756% of renters already pay >50% of income on rent) — very limited rent-growth headroom before tenants either downsize or default.
Forward outlook
- Local home prices are declining (-3.0%/yr); year-one equity from $415 of loan paydown is wiped out by about $2k of value loss. Plan a longer hold.
- Monroe County population projected to shrink 6% by 2050 — rents likely to lag national; underwrite the cash flow, not the appreciation.
- At projected returns (-3.0% appreciation + 8.0% rent growth), your $17k cash investment doubles in ~2 years — after that, you're playing with house money.
Negotiation context
- Only 6 days on market — expect competitive offers; lowballing is unlikely to land.
- 6 sale attempts since 16y ago with the ask held roughly flat each time — persistent listings suggest the price (not the market) is what's stuck; bring a comps-based counter.
Risks & watch-outs
- Watch-outs: built in 1900 — expect roof / HVAC / electrical / plumbing capex.
Questions for the listing agent
- Built in 1900 — when were the roof, HVAC, electrical panel, plumbing, and water heater last replaced?
- Is there a deadline driving the sale (1031 exchange, divorce, estate, relocation)? That informs how much negotiation room exists.
- Schools are D-rated, which usually means shorter tenancies and higher turnover. Who's the typical renter profile here, and what's been the actual vacancy rate?
- Crime grade is F in this area — have there been break-ins, vandalism, or insurance claims at this property in the last 3 years? What carrier currently insures it and at what premium?
- What's the average days-on-market for RENTAL listings here right now (not sales)? A rising rental-DOM trend means longer vacancies and softer asking-rent achievability than the comps imply.
- What's the recent tenant-quality profile in this submarket — average credit score on applications, eviction rate, late-payment / NSF rate, and stable-employment percentage? A property-management company in the area should have these aggregated.
- How much new for-sale + rental construction is in the pipeline within 1–3 miles? Heavy new supply typically softens prices + rents 12–24 months out; constrained supply supports both.
Investment metrics
- 1% rule
- 2.83% ✓
- Cap rate
- 25.11%
- Cash-on-cash
- 67.21%
- DSCR
- 3.99
- GRM
- 2.9
CMA / ARV
- ARV (median comp)
- $72,417
- List price
- $60,000
- Delta
- -17.15%
- Verdict
- UNDERPRICED
- Comps
- 20 within 1.0 mi
Show comp detail 12 sales within ~0.75 mi
| Address | Dist | Beds/Ba | Sqft | Sold | Price | $/sf | Match |
|---|---|---|---|---|---|---|---|
| 15 Princeton St | 0.20mi | 3/2.0 | 1,158 (-0%) | 3mo | $75,000 | $65 | 83 |
| 233 Avenue D | 0.38mi | 3/1.0 | 1,176 (+1%) | 1mo | $30,000 | $26 | 79 |
| 285 Avenue B | 0.28mi | 3/1.0 | 1,292 (+11%) | 1mo | $50,000 | $39 | 68 |
| 128 Clifford Ave | 0.21mi | 3/1.0 | 1,319 (+13%) | 2mo | $90,000 | $68 | 66 |
| 81 Dorbeth | 0.63mi | 3/1.0 | 1,180 (+1%) | 5mo | $122,200 | $104 | 64 |
| 9 Hoeltzer St | 0.26mi | 4/1.0 (+1) | 1,279 (+10%) | 3mo | $50,000 | $39 | 64 |
| 101 Rauber St | 0.38mi | 3/1.0 | 1,025 (-12%) | 2mo | $144,000 | $140 | 61 |
| 56 Weeger St | 0.68mi | 3/1.5 | 1,133 (-3%) | 5mo | $120,000 | $106 | 58 |
| 623 Avenue D | 0.64mi | 3/1.0 | 1,254 (+8%) | 2mo | $70,000 | $56 | 56 |
| 2 Oscar St | 0.62mi | 3/1.0 | 1,303 (+12%) | 1mo | $65,000 | $50 | 50 |
| 85 Eiffel Pl | 0.67mi | 3/2.0 | 1,323 (+14%) | 3mo | $60,000 | $45 | 40 |
| 68 Weaver St | 0.74mi | 4/1.0 (+1) | 1,300 (+12%) | 7mo | $53,500 | $41 | 35 |
Match score weights: distance 35% · size 25% · config 20% · recency 20%. Top-matched comps best support the ARV.
Projected returns pro-forma
-3.0% appreciation · 8.0% rent growth · sell at horizon
- IRR
- 72.1%
- Equity multiple
- 4.52×
- Total profit
- $59,193
- Equity at exit
- $8,946
- IRR
- 77.4%
- Equity multiple
- 11.10×
- Total profit
- $169,613
- Equity at exit
- $5,188
Cash invested: $16,800 (down + closing). Projections, not guarantees.
Landlord ↔ Tenant lean methodology
- Overall (STATE)
- 15 Strongly Tenant-Friendly
- State New York
- 15 Strongly Tenant-Friendly · D+10
- County
- — inherits STATE
- City
- — inherits STATE
ZIP-level market 14621
- Home prices YoY
- -4.0%
- Rents YoY
- 8.9%
- Active inventory
- 116
- Price-to-rent
- 2.9×
Monthly cashflow live
- Estimated rent
- $1,698 high interval (Pro) →
- Mortgage (P&I)
- −$315
- Tax from tax record
- −$61 /mo · $728/yr
- Insurance
- −$25
- HOA
- −$0
- Vacancy / Maint / Mgmt
- −$357
- Net cashflow
- $941
Break-even live
Sensitivity live
| Price | -10% $975 | -5% $958 | +0% $941 | +5% $924 | +10% $907 |
|---|---|---|---|---|---|
| Rent | -10% $807 | -5% $874 | +0% $941 | +5% $1,008 | +10% $1,075 |
| Rate | -1.0pp $971 | -0.5pp $956 | base $941 | +0.5pp $925 | +1.0pp $910 |
UW: 25.0% down · 7.5% · 30yr · 1.5% tax · 5.0% vac · 8.0% maint · 8.0% mgmt
Financing live
Cash to close
- Down payment
- $15,000
- Closing costs
- $1,800
- Reserves months
- —
- Total cash needed
- —
Loan-product check · same deal, 3 products live
Conventional
25% down · 7.5% · 30yr
- Down + closing
- —
- Monthly P&I
- —
- Monthly cashflow
- —
- DSCR
- —
- Eligible?
- —
Personal DTI + credit; lowest rate.
DSCR
20% down · 8.5% · 30yr
- Down + closing
- —
- Monthly P&I
- —
- Monthly cashflow
- —
- DSCR
- —
- Eligible?
- —
No personal income docs; deal must DSCR.
Hard money
10% down · 12.0% · 12mo
- Down + closing
- —
- Monthly P&I
- —
- Monthly cashflow
- —
- DSCR
- —
- Eligible?
- —
Short-term bridge; refi at stabilization.
Rent comps 40 comps
| Address | Beds | Baths | Sqft | Rent | $/sqft | DOM | Units | Dist |
|---|---|---|---|---|---|---|---|---|
| 76 Avenue A Unit Up Rochester, NY | 3.0 | 1.0 | 796 | $1,700 | $2.14 | 45d | 1 | 0.40mi |
| 11 Maria St Unit 1 DN Rochester, NY | 2.0 | 1.0 | 800 | $895 | $1.12 | 45d | 1 | 0.51mi |
| 28-30 Carthage Dr Unit 28 Rochester, NY | 3.0 | 1.0 | 1415 | $1,600 | $1.13 | 24d | 1 | 0.58mi |
| 89 Twin Beeches Rochester, NY | 2.0 | 1.5 | 1096 | $1,250 | $1.14 | 45d | 1 | 0.69mi |
| 84 Twin Beeches Rochester, NY | 2.0 | 1.5 | 1096 | $1,250 | $1.14 | 24d | 1 | 0.71mi |
| 52 Lorimer St Unit 03 UP Rear Rochester, NY | 2.0 | 1.0 | 700 | $1,000 | $1.43 | 24d | 1 | 0.84mi |
| 2 Jay St Unit 2 Rochester, NY | 3.0 | 1.0 | 1252 | $1,045 | $0.83 | 45d | 1 | 0.86mi |
| 493 Hollenbeck St Rochester, NY | 2.0 | 1.5 | 936 | $1,275 | $1.36 | 15d | 1 | 0.90mi |
| 239 Weyl St Rochester, NY | 3.0 | 1.0 | 1208 | $1,600 | $1.32 | 20d | 1 | 0.93mi |
| 100 Fairbanks St Rochester, NY | 2.0 | 1.0 | 1456 | $1,100 | $0.76 | 45d | 1 | 0.94mi |
| 1016 Lake Ave Unit 1 Rochester, NY | 3.0 | 1.0 | 1300 | $1,600 | $1.23 | 45d | 1 | 0.98mi |
| 39 Parkway Apt 1 Rochester, NY | 2.0 | 1.0 | 700 | $950 | $1.36 | 45d | 1 | 1.03mi |
| 254 Lexington Ave Rochester, NY | 3.0 | 1.0 | 950 | $1,350 | $1.42 | 4d | 1 | 1.07mi |
| 265 Driving Park Ave Unit 31 Rochester, NY | 2.0 | 1.0 | 810 | $1,250 | $1.54 | 45d | 1 | 1.13mi |
| 80 St Paul St Rochester, NY | 1.0–2.0 | 1.5–2.5 | 1024 | $1,935 | $1.89 | 4d | 3 | 1.20mi |
| 176 Roycroft Dr Rochester, NY | 3.0 | 1.0 | 1169 | $950 | $0.81 | 11d | 1 | 1.20mi |
| 127 Carter St #125 Rochester, NY | 2.0 | 1.0 | 1320 | $1,400 | $1.06 | 45d | 1 | 1.26mi |
| 658 Smith St Rochester, NY | 2.0 | 1.0 | 981 | $1,500 | $1.53 | 4d | 1 | 1.28mi |
| 69 Angle St Rochester, NY | 2.0 | 1.0 | 1500 | $1,500 | $1.00 | 15d | 1 | 1.28mi |
| 152 Gibbs St Rochester, NY | 1.0–2.0 | 1.0 | 950 | $1,875 | $1.97 | 15d | 3 | 1.29mi |
| 39 State St Rochester, NY | 1.0–2.0 | 1.0–2.5 | 1154 | $3,500 | $3.03 | 4d | 8 | 1.29mi |
| 194 E Main St Rochester, NY | 1.0–2.0 | 1.0–2.0 | 875 | $2,095 | $2.39 | 15d | 1 | 1.30mi |
| 14 Franklin St Rochester, NY | 2.0 | 1.0–2.0 | 1345 | $3,477 | $2.59 | 4d | 8 | 1.30mi |
| 128 Gibbs St Unit 136 Rochester, NY | 2.0 | 1.0 | 900 | $1,795 | $1.99 | 11d | 1 | 1.31mi |
| 128 Gibbs St Unit 130 Rochester, NY | 2.0 | 1.0 | 1000 | $1,875 | $1.88 | 11d | 1 | 1.31mi |
| 260 E Main St Rochester, NY | 3.0 | 1.0–2.0 | 1144 | $2,999 | $2.62 | 4d | 14 | 1.31mi |
| 25 Trust St Rochester, NY | 3.0 | 1.5 | 1003 | $1,600 | $1.60 | 4d | 1 | 1.34mi |
| 85 Cameron St Unit B Rochester, NY | 3.0 | 1.0 | 1138 | $1,650 | $1.45 | 45d | 1 | 1.34mi |
| 45 Clay Ave Rochester, NY | 3.0 | 1.0 | 1000 | $1,700 | $1.70 | 15d | 1 | 1.36mi |
| 25 Karnes St Rochester, NY | 2.0 | 1.0 | 1059 | $1,250 | $1.18 | 22d | 1 | 1.36mi |
| 183 E Main St Rochester, NY | 1.0–2.0 | 1.0 | 1142 | $2,870 | $2.51 | 11d | 28 | 1.37mi |
| 14-42 Seneca Manor Dr Rochester, NY | 1.0–2.0 | 1.0 | 800 | $1,120 | $1.40 | 45d | 1 | 1.39mi |
| 49 East Ave Apt 212 Rochester, NY | 2.0 | 2.0 | 961 | $2,572 | $2.68 | 4d | 1 | 1.40mi |
| 1097 Dewey Ave Unit B Rochester, NY | 2.0 | 1.0 | 1008 | $1,150 | $1.14 | 15d | 1 | 1.40mi |
| 13 S Fitzhugh St Rochester, NY | 1.0–2.0 | 1.5–2.0 | 890 | $2,098 | $2.36 | 11d | 2 | 1.40mi |
| 30 W Broad St Unit 307 Rochester, NY | 2.0 | 1.0 | 911 | $1,950 | $2.14 | 45d | 1 | 1.42mi |
| 55 Exchange Blvd Rochester, NY | 2.0 | 1.0–2.0 | 952 | $2,695 | $2.83 | 4d | 28 | 1.45mi |
| 65 W Broad St Unit 808 Rochester, NY | 2.0 | 1.0 | 796 | $1,679 | $2.11 | 15d | 1 | 1.46mi |
| 111 East Ave Rochester, NY | 2.0 | 1.0–2.0 | 614 | $1,900 | $3.09 | 45d | 1 | 1.47mi |
| 248 Flower City Park Rochester, NY | 3.0 | 1.0 | 1350 | $1,800 | $1.33 | 4d | 1 | 1.47mi |
Listing history 18 events
-
2026-05-06status Pending 595-char remark
-
2026-04-29$60,000 Active 595-char remark
-
2026-02-19status Pending
-
2026-02-17historical
-
2026-01-13price $89,900
-
2025-10-01$92,000 Active
-
2025-09-10historical
-
2025-09-08$99,900 Active
-
2024-03-21soldstatus $91,000
-
2024-03-18soldstatus $91,000 Closed
-
2024-01-31status Pending
-
2023-09-26price $97,000
-
2023-08-07$104,900 Active
-
2023-08-01historical
-
2023-04-17$109,900 Active
-
2010-08-10soldstatus $5,001
-
2010-06-25$5,500
-
2007-05-01soldstatus $14,000
ⓘ Source: listings_history table (triggers on properties + properties_extension) + one-shot
backfill from property_details.listing_events for pre-trigger history.
Tax reassessment forecast NY · Partial reset (capped growth)
- Current annual tax
- $728 · $61/mo
- Projected year-2 tax
- $871 · $73/mo
- Expected delta
- +$143/yr (+$12/mo · 19.7%)
ⓘ Screening estimate from a state-policy table — verify with the county assessor before closing.
Climate risk First Street
- Flood 1/10 Low FEMA zone X (unshaded) · 0% chance over 30 yrs
- Wildfire 1/10 Low
- Heat 2/10 Low 7 d/yr ≥95°F today · 15 d/yr by 30 yrs out
- Wind 1/10 Low
- Air quality 2/10 Low 1 unhealthy d/yr today · 2 by 30 yrs out
Nearby sold comps map
Loading sold comps map…
Walkable amenities ~0.75 mi
Loading nearby amenities…
Taxation est. · year 1
- Rental income
- $20,373
- − Mortgage interest
- −$3,361
- − Property taxes
- −$728
- − Insurance
- −$300
- − Repairs & maintenance
- −$1,630
- − Management
- −$1,630
- − Depreciation
- −$1,745
- Taxable income
- $10,979
- Est. tax owed @ 24.0%
- −$2,635
- After-tax cash flow
- $8,656/yr
For passive investors: Depreciation is non-cash, so a rental often shows a tax loss while cash-flowing — sheltering income. Rental losses are passive: they offset passive income freely, and up to $25,000/yr can offset ordinary (W-2) income if you actively participate and your MAGI is under $100k (phasing out to $0 by $150k); unused losses carry forward. On sale, claimed depreciation is recaptured at up to 25%, and gains may owe capital-gains tax (a 1031 exchange can defer both). Figures are a year-1 estimate at your 24.0% rate — not tax advice; consult a CPA.
Schools (NCES district)
- District
- Rochester City School District
- NCES district ID
- 3624750
- Math proficiency
- 21% ▬ 0.00%
- Reading proficiency
- 26% ▲ 4.00%
- Median HH income
- $30,923
- Composite
- 18.98/100
- National rank
- #8850
- State rank
- #589 of 590 in NY
Livability — Rochester
- Score
- 76/100
- State rank
- #222
- US rank
- #3482
Category grades
Schools grade is shown separately in the Schools card above.
Census & demographics
- Census place
- Rochester, NY
- County
- Monroe County · 674,131 people
- City population
- 432,803
- Metro
- Rochester, NY
- Population (ZIP)
- 32,381
- Household income
- $35,383
- Rent vs Own
- Severe rent burden
- 2756.0
Population outlook (Monroe County) Hauer SSP2
- Today (2025)
- 759,460 people
- By 2030
- 757,154 · -0.3%
- By 2040
- 740,644 · -2.5%
- By 2050
- 714,443 · -5.9%
- By 2075
- 645,883 · -15.0%
- By 2100
- 547,084 · -28.0%
Race, ethnicity, and origin ACS 2023
- Neighborhood character
- Diverse neighborhood (Simpson 0.66)
- Race & ethnicity
- Hispanic / Latino 40% Black 40% White 14% Two or more races 12% Asian 1%
- Hispanic origin (detail)
- Mexican 1% Puerto Rican 32% Dominican 3%
- Common ancestry
- Romanian 1% Lithuanian 1% Serbian 1%
- Foreign-born
- 8% · Canada, Jamaica
- Languages at home
- 65% English-only · Spanish 30% Other Asian/Pacific 2% French/Haitian/Cajun 1%
Political lean MEDSL · Monroe
- 2024 margin
- D (+19.1) · D 59.5% · R 40.5%
- 2008→2024 swing
- +1.4pp toward D · 2008: 17.7pp · 2024: 19.1pp
- All cycles
- 2024: D+19.1 2020: D+21.0 2016: D+14.1 2012: D+17.4 2008: D+17.7
Not yet ingested
- Civics
- —
Market trends
- HPI YoY
- ▼ -10.66%
- Current HPI
- 254.1805
- Rent YoY
- ▲ 8.88%
- Metro
- Rochester, NY
- State GDP YoY
- ▲ 2.60%
- F500 in state
- 92
Industry mix (Fortune 500 HQ in NY)
| Industry | F500 HQs | Revenue |
|---|---|---|
| Financial Services | 10 | $950B |
|
||
| Consumer Goods | 9 | $162B |
|
||
| Insurance | 4 | $225B |
|
||
| Telecommunications | 2 | $144B |
|
||
| Pharmaceuticals | 2 | $112B |
|
||
| Media / Entertainment | 2 | $69B |
|
||
Price history
+328.6% since first listed18 events — show timeline
- 2026-05-06 Pending — UNYREIS
- 2026-04-29 Listed $60,000 UNYREIS
- 2026-02-19 Pending — UNYREIS
- 2026-02-17 Listing Removed — UNYREIS
- 2026-01-13 Price Changed $89,900 UNYREIS
- 2025-10-01 Listed $92,000 UNYREIS
- 2025-09-10 Listing Removed — UNYREIS
- 2025-09-08 Listed $99,900 UNYREIS
- 2024-03-21 Sold (Public Records) $91,000 Public Records
- 2024-03-18 Sold (MLS) $91,000 UNYREIS
- 2024-01-31 Pending — UNYREIS
- 2023-09-26 Price Changed $97,000 UNYREIS
- 2023-08-07 Listed $104,900 UNYREIS
- 2023-08-01 Listing Removed — UNYREIS
- 2023-04-17 Listed $109,900 UNYREIS
- 2010-08-10 Sold (MLS) $5,001 UNYREIS
- 2010-06-25 Listed $5,500 UNYREIS
- 2007-05-01 Sold (Public Records) $14,000 Public Records
Property tax history
-1.1%/yrLatest (2025): $728 · +1.8% YoY. Source: county tax records.
Cash-flow waterfall
monthlySold comps — $/sqft
last 12 mo · ≤1 miLoading sold comps…