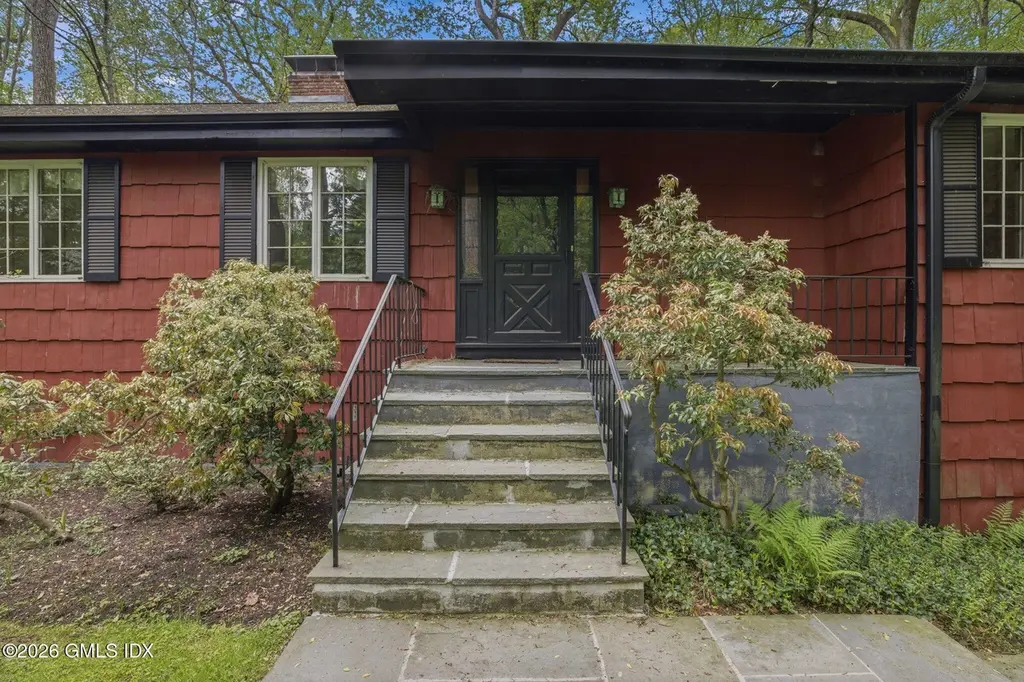
86 Dandy Dr · Cos Cob, CT
Flood risk 6/10 · Moderate
- FEMA flood zone
- X (unshaded)
- Chance of flooding over 30 yrs
- 0.72%
- Est. flood insurance / yr
- $473 – $860
Fire risk 3/10 · Minor
- Est. fire insurance / yr
- $829 – $1,539
Heat risk 5/10 · Moderate
- Hot days now (above 98°F)
- 7 days/yr
- Hot days in 30 yrs
- 14 days/yr
Wind risk 6/10 · Moderate
- Chance of severe wind over 30 yrs
- 64.0%
Air-quality risk 4/10 · Minor
- Unhealthy air days now
- 5 days/yr
- Unhealthy air days in 30 yrs
- 7 days/yr
Risk factors via First Street. Map © Google.
Why this score? — see what drove the C grade
The composite is a weighted blend of 9 inputs, each scored 0–100. Each bar is that input's sub-score; the figure is the points it added to the 100-point composite (weight × sub-score).
- ARV discount +15.0/15.0
- Cash flow +11.3/30.0
- Appreciation +9.0/10.0
- Schools +6.6/10.0
- Livability +3.7/5.0
- DSCR +3.3/10.0
- Rent growth +2.5/5.0
- Condition / age +2.5/5.0
- 1% rule +2.4/10.0
$1,995,000
🖨 Deal sheet (PDF) 📄 Offer letter ✓ Due diligence
Listing remarks
Discover charming, single-level living with incredible space! This classic ranch offers over 2,100 sq. ft. on the main floor, featuring a gracious living room with fireplace, formal dining, and a sunny, open-concept kitchen and family room, plus 4 nicely sized bedrooms. The large screened-in porch offers seamless indoor-outdoor living. Convenience is key with a dedicated laundry/powder room off the mudroom. The huge 1,420 sq. ft. walkout lower level with full bath is a blank canvas for a game room, gym, or in-law suite. Featuring quality Anderson windows, this property is priced for immediate equity--renovate or customize to create your dream home.
Key facts
- Screened-in porch
- Walkout lower level
- Full bath
Tags
Property features AI
Finance
- Other: Probate listing
Exterior
- Parking: Attached 2-car garage
- Utilities: Public water; Septic sewer; Natural gas available
- Home design: Single family residence; Built in 1965
- Construction: Cedar construction; Architectural shingle roof
- Exterior features: Screened porch; Deck; Level lot; Shed(s)
Interior
- Bathrooms: Three full bathrooms; One half bathroom (total 3.5 bathrooms)
- Heating & cooling: Central air conditioning; Natural gas heating with forced air
- Interior features: Full basement; Two fireplaces
Neighborhood map
What this means for you Summary
Snapshot
- This is a 4-bed/3.5-bath single-family listed at $2.00M.
Deal economics
- At list price, monthly cash flow is $-737 ($-9k/yr) — negative.
- To cash-flow at today's rent, offer at most $1.86M (6.5% below list).
- To meet the 1% rule (rent ≥ 1% of price), the offer needs to be $1.47M (26.4% below list).
- Recommended offer: $1.47M (26.4% below list) — sets the bar for 1% rule.
Location & tenants
- Location reads 73/100 on livability (#72 in CT) — a middle-class / working-renter tenant base. Strengths: crime A+, employment A+, health & safety B; Watch: housing D+, amenities F, commute F.
- Greenwich School District (suburban): math 64% / reading 73% proficiency, ranked #12 of 153 in CT (top 8%) — acceptable for families but not a draw, mixed tenant base, ~2y average lease; only 11% free/reduced lunch — higher-income household profile.
- Zoned schools: North Street School (math 72% / reading 82%, grade A, #28 of 553 statewide, top 7%, 387 students, 4% FRL); Central Middle School (math 60% / reading 71%, grade A-, #26 of 175 statewide, top 16%, 506 students, 18% FRL) — zoned schools at 11% FRL track the district average.
- Market conditions: 31 active listings in the ZIP; 24 comparable units currently listed for rent nearby; rentals at typical pace (median 24d on market — plan ~3-4 weeks tenant-placement turnaround); 1,151 units permitted in Western Connecticut Planning Region in 2024 (714 in 5+ unit buildings).
Forward outlook
- In year one you build about $171k of equity ($14k loan paydown + $158k appreciation (7.9% local appreciation)).
- By year 2, paydown + projected appreciation supports a ~$275k cash-out refi (75% LTV) — recoverable capital for the next deal without selling this one.
Negotiation context
- It's been on market 28 days — a 2% lower offer ($1.97M) is reasonable based on typical stale-listing flexibility.
Risks & watch-outs
- Climate carrying-cost: major flood risk; major wind risk, 64% chance of damaging wind over 30y; extreme-heat days projected 7→14/yr by 2055 (HVAC capex compounding) — expect insurance premiums to compound above CPI over the hold.
Questions for the listing agent
- What do current leases actually rent for vs. the listed asking? Can we see a recent rent roll and the last 12 months of T-12 income?
- Built in 1965 — when were the roof, HVAC, electrical panel, plumbing, and water heater last replaced?
- Is there a deadline driving the sale (1031 exchange, divorce, estate, relocation)? That informs how much negotiation room exists.
- Schools are A-rated — typically a magnet for longer-tenancy family renters. What's the average tenant stay here, and is there a school-zone premium baked into asking?
- What's the average days-on-market for RENTAL listings here right now (not sales)? A rising rental-DOM trend means longer vacancies and softer asking-rent achievability than the comps imply.
- What's the recent tenant-quality profile in this submarket — average credit score on applications, eviction rate, late-payment / NSF rate, and stable-employment percentage? A property-management company in the area should have these aggregated.
- How much new for-sale + rental construction is in the pipeline within 1–3 miles? Heavy new supply typically softens prices + rents 12–24 months out; constrained supply supports both.
Investment metrics
- 1% rule
- 0.74% ✗
- Cap rate
- 5.85%
- Cash-on-cash
- -1.58%
- DSCR
- 0.93
- GRM
- 11.3
CMA / ARV
- ARV (median comp)
- $2,508,214
- List price
- $1,995,000
- Delta
- -20.46%
- Verdict
- UNDERPRICED
- Comps
- 20 within 1.0 mi
Show comp detail 12 sales within ~0.75 mi
| Address | Dist | Beds/Ba | Sqft | Sold | Price | $/sf | Match |
|---|---|---|---|---|---|---|---|
| 3 Cat Rock Rd | 0.36mi | 4/2.5 | 3,334 (-6%) | 14mo | $2,355,000 | $706 | 58 |
| 1 Arrowhead Ln | 0.30mi | 4/3.5 | 3,120 (-12%) | 13mo | $2,460,000 | $788 | 56 |
| 225 Valley Rd | 0.34mi | 4/3.5 | 3,800 (+7%) | 21mo | $1,900,000 | $500 | 54 |
| 46 Pine Ridge Rd | 0.55mi | 4/3.5 | 3,796 (+7%) | 11mo | $3,500,000 | $922 | 53 |
| 9 Boyd Ln | 0.69mi | 4/3.5 | 3,304 (-7%) | 8mo | $2,125,000 | $643 | 50 |
| 2 Lakeview Dr | 0.71mi | 4/3.0 | 3,368 (-5%) | 10mo | $2,300,000 | $683 | 49 |
| 19 Pond Pl | 0.27mi | 5/4.0 (+1) | 3,023 (-15%) | 10mo | $2,410,000 | $797 | 47 |
| 45 Sundance Dr | 0.69mi | 3/3.0 (-1) | 3,424 (-3%) | 12mo | $960,000 | $280 | 45 |
| 24 Rippowam Rd | 0.64mi | 4/2.5 | 3,827 (+8%) | 10mo | $1,595,000 | $417 | 45 |
| 11 Jeffrey Rd | 0.69mi | 4/4.5 | 3,293 (-7%) | 18mo | $2,576,000 | $782 | 37 |
| 7 Coachlamp Ln | 0.68mi | 5/3.5 (+1) | 3,175 (-10%) | 20mo | $2,402,000 | $757 | 29 |
| 27 Grove St | 0.73mi | 5/4.5 (+1) | 3,965 (+12%) | 23mo | $2,605,000 | $657 | 18 |
Match score weights: distance 35% · size 25% · config 20% · recency 20%. Top-matched comps best support the ARV.
Projected returns pro-forma
7.9% appreciation · 3.0% rent growth · sell at horizon
- IRR
- 18.6%
- Equity multiple
- 2.36×
- Total profit
- $762,024
- Equity at exit
- $1,502,672
- IRR
- 17.5%
- Equity multiple
- 5.02×
- Total profit
- $2,244,010
- Equity at exit
- $2,970,491
Cash invested: $558,600 (down + closing). Projections, not guarantees.
Landlord ↔ Tenant lean methodology
- Overall (STATE)
- 27 Tenant-Leaning
- State Connecticut
- 27 Tenant-Leaning · D+7
- County
- — inherits STATE
- City
- — inherits STATE
ZIP-level market 06807
- Home prices YoY
- 4.3%
- Active inventory
- 31
- Price-to-rent
- 11.3×
Monthly cashflow live
- Estimated rent
- $14,677 high interval (Pro) →
- Mortgage (P&I)
- −$10,462
- Tax from tax record
- −$1,038 /mo · $12,462/yr
- Insurance
- −$831
- HOA
- −$0
- Vacancy / Maint / Mgmt
- −$3,082
- Net cashflow
- $-737
Break-even live
Sensitivity live
| Price | -10% $393 | -5% $-172 | +0% $-737 | +5% $-1,301 | +10% $-1,866 |
|---|---|---|---|---|---|
| Rent | -10% $-1,896 | -5% $-1,317 | +0% $-737 | +5% $-157 | +10% $423 |
| Rate | -1.0pp $268 | -0.5pp $-229 | base $-737 | +0.5pp $-1,254 | +1.0pp $-1,780 |
UW: 25.0% down · 7.5% · 30yr · 1.5% tax · 5.0% vac · 8.0% maint · 8.0% mgmt
Financing live
Cash to close
- Down payment
- $498,750
- Closing costs
- $59,850
- Reserves months
- —
- Total cash needed
- —
Loan-product check · same deal, 3 products live
Conventional
25% down · 7.5% · 30yr
- Down + closing
- —
- Monthly P&I
- —
- Monthly cashflow
- —
- DSCR
- —
- Eligible?
- —
Personal DTI + credit; lowest rate.
DSCR
20% down · 8.5% · 30yr
- Down + closing
- —
- Monthly P&I
- —
- Monthly cashflow
- —
- DSCR
- —
- Eligible?
- —
No personal income docs; deal must DSCR.
Hard money
10% down · 12.0% · 12mo
- Down + closing
- —
- Monthly P&I
- —
- Monthly cashflow
- —
- DSCR
- —
- Eligible?
- —
Short-term bridge; refi at stabilization.
Rent comps 24 comps
| Address | Beds | Baths | Sqft | Rent | $/sqft | DOM | Units | Dist |
|---|---|---|---|---|---|---|---|---|
| 40 Mianus View Ter Cos Cob, CT | 4.0 | 3.5 | 2895 | $14,500 | $5.01 | 12d | 1 | 0.17mi |
| 40 Mianus View Ter Cos Cob, CT | 5.0 | 3.5 | 2895 | $14,500 | $5.01 | 4d | 1 | 0.17mi |
| 15 Lancer Rd Riverside, CT | 4.0 | 2.5 | 3031 | $8,889 | $2.93 | 24d | 1 | 0.61mi |
| 41 Grove St Cos Cob, CT | 5.0 | 3.5 | 2787 | $12,000 | $4.31 | 44d | 1 | 0.71mi |
| 507 River Rd Cos Cob, CT | 5.0 | 4.5 | 4100 | $16,000 | $3.90 | 4d | 1 | 0.73mi |
| 14 Rainbow Dr Riverside, CT | 5.0 | 3.5 | 3510 | $16,000 | $4.56 | 24d | 1 | 0.76mi |
| 1 Crawford Ter Riverside, CT | 4.0 | 4.0 | 2819 | $18,000 | $6.39 | 22d | 1 | 0.84mi |
| 1 Cary Rd Riverside, CT | 4.0 | 3.5 | 3300 | $13,500 | $4.09 | 44d | 1 | 0.89mi |
| 38 Sheephill Rd Riverside, CT | 3.0 | 2.5 | 2600 | $8,200 | $3.15 | 44d | 1 | 0.91mi |
| 8 Perry Pl Riverside, CT | 4.0 | 3.0 | 2556 | $11,500 | $4.50 | 22d | 1 | 0.92mi |
| 11 Osee Pl Cos Cob, CT | 5.0 | 4.0 | 3112 | $12,000 | $3.86 | 44d | 1 | 0.93mi |
| 10 Ricki-Beth Ln Old Greenwich, CT | 5.0 | 4.5 | 4336 | $27,500 | $6.34 | 44d | 1 | 0.99mi |
| 4 Wescott Ct Riverside, CT | 4.0 | 4.5 | 3950 | $15,000 | $3.80 | 24d | 1 | 1.03mi |
| 1 Ernel Dr Riverside, CT | 5.0 | 3.5 | 2517 | $13,000 | $5.16 | 22d | 1 | 1.07mi |
| 12 Norton Ln Old Greenwich, CT | 4.0 | 3.5 | 3285 | $15,000 | $4.57 | 22d | 1 | 1.09mi |
| 34 Hassake Rd Old Greenwich, CT | 4.0 | 3.5 | 2943 | $16,000 | $5.44 | 44d | 1 | 1.20mi |
| 42 Breezemont Ave Riverside, CT | 5.0 | 5.5 | 4945 | $27,500 | $5.56 | 4d | 1 | 1.24mi |
| 25 Arnold St Old Greenwich, CT | 4.0 | 3.0 | 2490 | $10,500 | $4.22 | 24d | 1 | 1.27mi |
| 25 Buxton Ln Riverside, CT | 5.0 | 3.5 | 2780 | $12,995 | $4.67 | 24d | 1 | 1.28mi |
| 6 Halsey Dr Old Greenwich, CT | 4.0 | 3.0 | 2490 | $8,500 | $3.41 | 15d | 1 | 1.31mi |
| 82 Westover Ave Stamford, CT | 4.0 | 2.5 | 4349 | $8,750 | $2.01 | 3d | 1 | 1.37mi |
| 36 Center Dr Old Greenwich, CT | 3.0 | 2.5 | 3328 | $11,300 | $3.40 | 44d | 1 | 1.43mi |
| 10 Durkin Pl Riverside, CT | 5.0 | 4.5 | 3245 | $17,500 | $5.39 | 44d | 1 | 1.43mi |
| 30 Bayside Ter Riverside, CT | 4.0 | 3.5 | 3730 | $25,000 | $6.70 | 44d | 1 | 1.49mi |
Listing history 9 events
-
2026-06-10status $1,995,000 Pending 28 DOM
-
2026-06-09days on market $1,995,000 Active 28 DOM
-
2026-06-08days on market $1,995,000 Active 27 DOM
-
2026-06-07days on market $1,995,000 Active 26 DOM
-
2026-06-03days on market $1,995,000 Active 22 DOM
-
2026-06-03days on market $1,995,000 Active 21 DOM
-
2026-06-01days on market $1,995,000 Active 20 DOM
-
2026-05-31days on market $1,995,000 Active 19 DOM
-
2026-05-12$1,995,000 Active 656-char remark
ⓘ Source: listings_history table (triggers on properties + properties_extension) + one-shot
backfill from property_details.listing_events for pre-trigger history.
Tax reassessment forecast CT · Partial reset (capped growth)
- Current annual tax
- $12,462 · $1,038/mo
- Projected year-2 tax
- $27,578 · $2,298/mo
- Expected delta
- +$15,116/yr (+$1,260/mo · 121.3%)
ⓘ Screening estimate from a state-policy table — verify with the county assessor before closing.
Climate risk First Street
- Flood 6/10 Major FEMA zone X (unshaded) · 72% chance over 30 yrs
- Wildfire 3/10 Moderate
- Heat 5/10 Major 7 d/yr ≥98°F today · 14 d/yr by 30 yrs out
- Wind 6/10 Major 64% chance of damaging wind over 30 yrs
- Air quality 4/10 Moderate 5 unhealthy d/yr today · 7 by 30 yrs out
Nearby sold comps map
Loading sold comps map…
Walkable amenities ~0.75 mi
Loading nearby amenities…
Taxation est. · year 1
- Rental income
- $176,126
- − Mortgage interest
- −$111,751
- − Property taxes
- −$12,462
- − Insurance
- −$9,975
- − Repairs & maintenance
- −$14,090
- − Management
- −$14,090
- − Depreciation
- −$58,036
- Taxable loss
- −$44,279
- Est. tax savings @ 24.0%
- +$10,627
- After-tax cash flow
- $1,785/yr
For passive investors: Depreciation is non-cash, so a rental often shows a tax loss while cash-flowing — sheltering income. Rental losses are passive: they offset passive income freely, and up to $25,000/yr can offset ordinary (W-2) income if you actively participate and your MAGI is under $100k (phasing out to $0 by $150k); unused losses carry forward. On sale, claimed depreciation is recaptured at up to 25%, and gains may owe capital-gains tax (a 1031 exchange can defer both). Figures are a year-1 estimate at your 24.0% rate — not tax advice; consult a CPA.
Schools (NCES district)
- District
- Greenwich School District
- NCES district ID
- 0901710
- Math proficiency
- 64% ▼ -7.00%
- Reading proficiency
- 73% ▼ -5.00%
- Median HH income
- $129,257
- Composite
- 65.67/100
- National rank
- #461
- State rank
- #12 of 153 in CT
Livability — Cos Cob
- Score
- 73/100
- State rank
- #72
- US rank
- #5178
Category grades
Schools grade is shown separately in the Schools card above.
Census & demographics
- Census place
- Cos Cob, CT
- City population
- 7,667
- Population (ZIP)
- 7,667
Population outlook (Western Connecticut County) Hauer SSP2
- By 2040
- 685,031
Race, ethnicity, and origin ACS 2023
- Neighborhood character
- Diverse neighborhood (Simpson 0.58)
- Race & ethnicity
- White 63% Two or more races 15% Hispanic / Latino 13% Asian 7% Black 4%
- Hispanic origin (detail)
- Puerto Rican 6% Dominican 1%
- Common ancestry
- Romanian 4% Estonian 4% Italian 3%
- Foreign-born
- 24% · Canada, China, Jamaica
- Languages at home
- 76% English-only · Other Indo-European 9% Spanish 6% Other Asian/Pacific 5%
Political lean MEDSL · Western Connecticut
- 2024 margin
- D (+19.1) · D 58.8% · R 39.7% · Other 1.6%
- All cycles
- 2024: D+19.1
Not yet ingested
- Civics
- —
Market trends
- HPI YoY
- ▲ 7.90%
- Current HPI
- 191.0957
- Rent YoY
- —
- Metro
- —
- State GDP YoY
- ▲ 1.06%
- F500 in state
- 38
Industry mix (Fortune 500 HQ in CT)
| Industry | F500 HQs | Revenue |
|---|---|---|
| Industrial Machinery | 4 | $38B |
|
||
| Insurance | 3 | $71B |
|
||
| Financial Services | 2 | $25B |
|
||
| Transportation / Logistics | 2 | $18B |
|
||
| Healthcare | 1 | $247B |
|
||
| Telecommunications | 1 | $55B |
|
||
Price history
2 events — show timeline
- 2026-06-09 Pending — GMLS
- 2026-05-12 Listed $1,995,000 GMLS
Property tax history
+3.9%/yrLatest (2023): $12,462 · +0.9% YoY. Source: county tax records.
Cash-flow waterfall
monthlySold comps — $/sqft
last 12 mo · ≤1 miLoading sold comps…