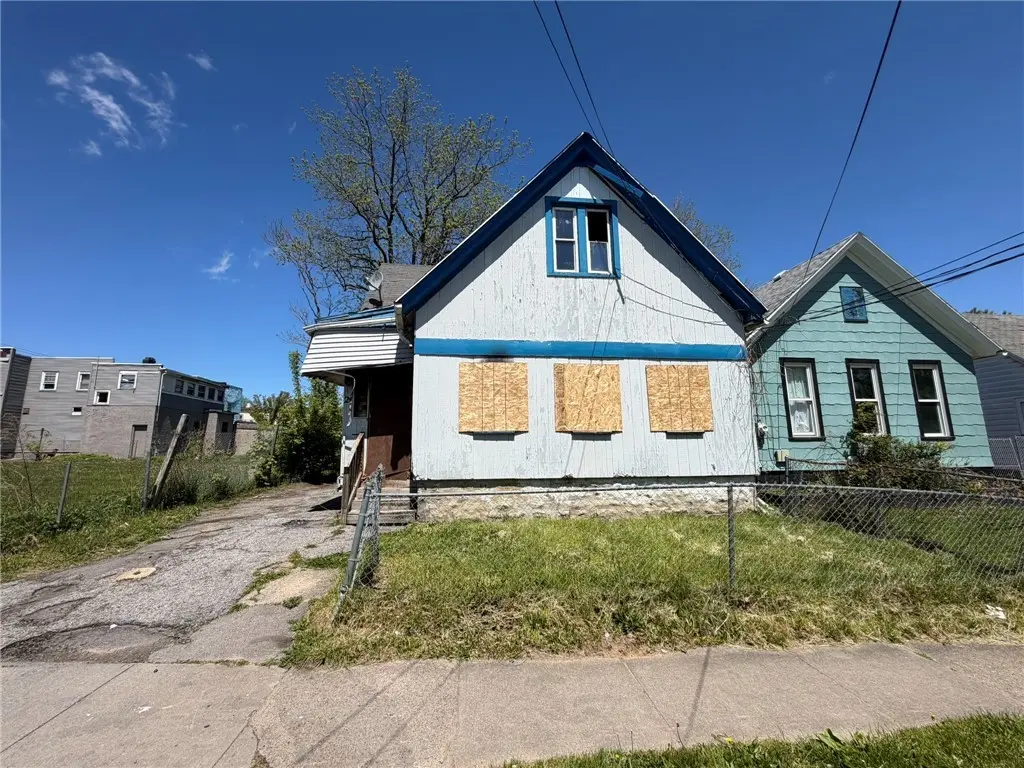
20 Eiffel Pl · Rochester, NY
Flood risk 1/10 · Minimal
- FEMA flood zone
- X (unshaded)
- Chance of flooding over 30 yrs
- 0.0%
- Est. flood insurance / yr
- $473 – $860
Fire risk 1/10 · Minimal
- Est. fire insurance / yr
- $691 – $1,283
Heat risk 2/10 · Minimal
- Hot days now (above 95°F)
- 7 days/yr
- Hot days in 30 yrs
- 15 days/yr
Wind risk 1/10 · Minimal
- Chance of severe wind over 30 yrs
- —
Air-quality risk 2/10 · Minimal
- Unhealthy air days now
- 1 days/yr
- Unhealthy air days in 30 yrs
- 2 days/yr
Risk factors via First Street. Map © Google.
Why this score? — see what drove the D+ grade
The composite is a weighted blend of 9 inputs, each scored 0–100. Each bar is that input's sub-score; the figure is the points it added to the 100-point composite (weight × sub-score).
- Cash flow +15.0/30.0
- ARV discount +7.5/15.0
- 1% rule +5.0/10.0
- DSCR +5.0/10.0
- Rent growth +4.7/5.0
- Livability +3.8/5.0
- Condition / age +2.5/5.0
- Schools +1.9/10.0
- Appreciation +0.0/10.0
$19,900
🖨 Deal sheet 📄 Offer letter ✓ Due diligence
Listing remarks
Investor special. Property is boarded up and first floor has had a fire - proceed with caution. Renovations needed. Spacious single family home ready for you. Great option for investors or owner occupant buyers looking to develop sweat equity. 4 bedrooms and a versatile layout. Don't miss this opportunity!
Key facts
- 3,852 sq ft lot
- Built 1880
- Listed 13 days
Property features AI
Exterior
- Parking: No garage
- Utilities: Electricity available and connected (circuit breakers); Public water connected; Sewer connected; High-speed internet available; Cable available
- Home design: Single-story home; Resale property
- Construction: Wood siding exterior; Asphalt roof; Stone foundation; Existing (previously built)
- Exterior features: Blacktop driveway; Fully fenced yard; Rectangular residential lot; City street frontage; Lot dimensions approximately 36 x 107
Interior
- Kitchen: Eat-in kitchen
- Bedrooms: 2 bedrooms on the main level
- Flooring: Hardwood; Laminate; Varies
- Bathrooms: 1 full bathroom (main level)
- Heating & cooling: Gas forced-air heating
- Interior features: Eat-in kitchen; Separate/formal living room; Bedroom on main level; Full basement
- Laundry & utility: Gas water heater
Neighborhood map
What this means for you Summary
Snapshot
- This is a 4-bed/1.0-bath single-family listed at $20k.
Deal economics
- At list price, monthly cash flow is $1k ($15k/yr) — positive.
- The deal already cash-flows at list — no discount required.
- Meets the 1% rule at list price ($2k rent vs $20k).
- Cap rate 81.0% vs local median 9.3% in Rochester — top-decile yield for the area; either an underpriced asset or a hidden risk that comps aren't pricing in. Stress-test before assuming the spread holds.
Location & tenants
- Location reads 76/100 on livability (#222 in NY, #3,482 nationally) — a middle-class / working-renter tenant base. Strengths: commute A+, cost of living A+, housing A+; Watch: schools D+, crime F, employment F.
- Rochester City School District (urban): math 21% / reading 26% proficiency, ranked #589 of 590 in NY (top 100%) — low school quality limits family demand, transient renter base, plan for 1-2y turnover; 82% free/reduced lunch — lower-income household profile, screen leases tightly.
- Market conditions: Rents rising fast (+8.9%/yr); 114 active listings in the ZIP; 15 comparable units currently listed for rent nearby; rentals at typical pace (median 19d on market — plan ~3-4 weeks tenant-placement turnaround); lower-income renter base — watch delinquency; 1,169 units permitted in Monroe County in 2024 (591 in 5+ unit buildings).
- At $1,731/mo this rent would consume 59% of the median local household income ($35k/yr) (locally 2756% of renters already pay >50% of income on rent) — very limited rent-growth headroom before tenants either downsize or default.
Forward outlook
- Local home prices are declining (-3.0%/yr); year-one equity from $138 of loan paydown is wiped out by about $597 of value loss. Plan a longer hold.
- Monroe County population projected to shrink 6% by 2050 — rents likely to lag national; underwrite the cash flow, not the appreciation.
- At projected returns (-3.0% appreciation + 8.0% rent growth), your $6k cash investment doubles in ~1 year — after that, you're playing with house money.
Negotiation context
- Only 13 days on market — expect competitive offers; lowballing is unlikely to land.
- 4 sale attempts since 9y ago with the ask held roughly flat each time — persistent listings suggest the price (not the market) is what's stuck; bring a comps-based counter.
Risks & watch-outs
- Watch-outs: built in 1880 — expect roof / HVAC / electrical / plumbing capex.
Questions for the listing agent
- Built in 1880 — when were the roof, HVAC, electrical panel, plumbing, and water heater last replaced?
- Is there a deadline driving the sale (1031 exchange, divorce, estate, relocation)? That informs how much negotiation room exists.
- Schools are D-rated, which usually means shorter tenancies and higher turnover. Who's the typical renter profile here, and what's been the actual vacancy rate?
- Crime grade is F in this area — have there been break-ins, vandalism, or insurance claims at this property in the last 3 years? What carrier currently insures it and at what premium?
- The area grade is low — what's the realistic commute time and amenity access for the typical tenant pool here? Any planned neighborhood developments (good or bad) we should know about?
- What's the average days-on-market for RENTAL listings here right now (not sales)? A rising rental-DOM trend means longer vacancies and softer asking-rent achievability than the comps imply.
- What's the recent tenant-quality profile in this submarket — average credit score on applications, eviction rate, late-payment / NSF rate, and stable-employment percentage? A property-management company in the area should have these aggregated.
- How much new for-sale + rental construction is in the pipeline within 1–3 miles? Heavy new supply typically softens prices + rents 12–24 months out; constrained supply supports both.
Investment metrics
- 1% rule
- 8.70% ✓
- Cap rate
- 81.05%
- Cash-on-cash
- 266.97%
- DSCR
- 12.88
- GRM
- 1.0
CMA / ARV
- ARV (median comp)
- $86,124
- List price
- $19,900
- Delta
- -76.89%
- Verdict
- UNDERPRICED
- Comps
- 20 within 1.0 mi
Show comp detail 12 sales within ~0.75 mi
| Address | Dist | Beds/Ba | Sqft | Sold | Price | $/sf | Match |
|---|---|---|---|---|---|---|---|
| 623 Avenue D | 0.04mi | 3/1.0 (-1) | 1,254 (-3%) | 2mo | $70,000 | $56 | 86 |
| 2 Oscar St | 0.37mi | 3/1.0 (-1) | 1,303 (+1%) | 1mo | $65,000 | $50 | 76 |
| 2 Bloomingdale St | 0.28mi | 3/1.0 (-1) | 1,399 (+8%) | 1mo | $45,000 | $32 | 68 |
| 285 Avenue B | 0.58mi | 3/1.0 (-1) | 1,292 (-0%) | 1mo | $50,000 | $39 | 67 |
| 1271 North St | 0.60mi | 4/1.5 | 1,276 (-1%) | 2mo | $128,900 | $101 | 66 |
| 57 Durnan St | 0.52mi | 5/1.0 (+1) | 1,374 (+6%) | 2mo | $85,000 | $62 | 59 |
| 207 Herald St | 0.71mi | 3/2.0 (-1) | 1,288 (-0%) | 1mo | $60,000 | $47 | 56 |
| 1295 North Street St | 0.61mi | 3/1.5 (-1) | 1,347 (+4%) | 2mo | $70,000 | $52 | 56 |
| 455 Clifford Ave | 0.43mi | 3/1.0 (-1) | 1,440 (+11%) | 2mo | $40,000 | $28 | 55 |
| 233 Avenue D | 0.54mi | 3/1.0 (-1) | 1,176 (-9%) | 1mo | $30,000 | $26 | 53 |
| 63 Carthage St | 0.71mi | 4/1.0 | 1,413 (+9%) | 2mo | $90,000 | $64 | 50 |
| 34 Zygment St | 0.67mi | 3/1.0 (-1) | 1,137 (-12%) | 2mo | $182,000 | $160 | 42 |
Match score weights: distance 35% · size 25% · config 20% · recency 20%. Top-matched comps best support the ARV.
Projected returns pro-forma
-3.0% appreciation · 8.0% rent growth · sell at horizon
- IRR
- —
- Equity multiple
- 16.24×
- Total profit
- $84,895
- Equity at exit
- $2,967
- IRR
- —
- Equity multiple
- 40.00×
- Total profit
- $217,299
- Equity at exit
- $1,721
Cash invested: $5,572 (down + closing). Projections, not guarantees.
Landlord ↔ Tenant lean methodology
- Overall (STATE)
- 15 Strongly Tenant-Friendly
- State New York
- 15 Strongly Tenant-Friendly · D+10
- County
- — inherits STATE
- City
- — inherits STATE
ZIP-level market 14621
- Home prices YoY
- -4.0%
- Rents YoY
- 8.9%
- Active inventory
- 114
- Price-to-rent
- 1.0×
Monthly cashflow live
- Estimated rent
- $1,731 high interval (Pro) →
- Mortgage (P&I)
- −$104
- Tax from tax record
- −$15 /mo · $179/yr
- Insurance
- −$8
- HOA
- −$0
- Vacancy / Maint / Mgmt
- −$363
- Net cashflow
- $1,240
Break-even live
UW: 25.0% down · 7.5% · 30yr · 1.5% tax · 5.0% vac · 8.0% maint · 8.0% mgmt
Financing live
Cash to close
- Down payment
- $4,975
- Closing costs
- $597
- Reserves months
- —
- Total cash needed
- —
Loan-product check · same deal, 3 products live
Conventional
25% down · 7.5% · 30yr
- Down + closing
- —
- Monthly P&I
- —
- Monthly cashflow
- —
- DSCR
- —
- Eligible?
- —
Personal DTI + credit; lowest rate.
DSCR
20% down · 8.5% · 30yr
- Down + closing
- —
- Monthly P&I
- —
- Monthly cashflow
- —
- DSCR
- —
- Eligible?
- —
No personal income docs; deal must DSCR.
Hard money
10% down · 12.0% · 12mo
- Down + closing
- —
- Monthly P&I
- —
- Monthly cashflow
- —
- DSCR
- —
- Eligible?
- —
Short-term bridge; refi at stabilization.
Rent comps 15 comps
| Address | Beds | Baths | Sqft | Rent | $/sqft | DOM | Units | Dist |
|---|---|---|---|---|---|---|---|---|
| 239 Weyl St Rochester, NY | 3.0 | 1.0 | 1208 | $1,600 | $1.32 | 19d | 1 | 0.36mi |
| 176 Roycroft Dr Rochester, NY | 3.0 | 1.0 | 1169 | $950 | $0.81 | 10d | 1 | 0.66mi |
| 25 Trust St Rochester, NY | 3.0 | 1.5 | 1003 | $1,600 | $1.60 | 3d | 1 | 0.91mi |
| 171 Mohawk St Rochester, NY | 3.0 | 2.0 | 1054 | $1,775 | $1.68 | 43d | 1 | 0.96mi |
| 28-30 Carthage Dr Unit 28 Rochester, NY | 3.0 | 1.0 | 1415 | $1,600 | $1.13 | 23d | 1 | 0.97mi |
| 207 Lux St Rochester, NY | 4.0 | 1.5 | 1728 | $2,150 | $1.24 | 10d | 1 | 1.11mi |
| 117 Northaven Ter Rochester, NY | 4.0 | 2.0 | 1460 | $1,975 | $1.35 | 10d | 1 | 1.15mi |
| 1016 Lake Ave Unit 1 Rochester, NY | 3.0 | 1.0 | 1300 | $1,600 | $1.23 | 43d | 1 | 1.24mi |
| 83 Navarre Rd Rochester, NY | 3.0 | 2.0 | 1322 | $2,250 | $1.70 | 2d | 1 | 1.29mi |
| 47 Priscilla St Rochester, NY | 4.0 | 1.5 | 1250 | $1,900 | $1.52 | 21d | 1 | 1.36mi |
| 2 Jay St Unit 2 Rochester, NY | 3.0 | 1.0 | 1252 | $1,045 | $0.83 | 43d | 1 | 1.37mi |
| 147 5th St Rochester, NY | 4.0 | 1.0 | 1289 | $1,950 | $1.51 | 21d | 1 | 1.38mi |
| 45 Clay Ave Rochester, NY | 3.0 | 1.0 | 1000 | $1,700 | $1.70 | 14d | 1 | 1.44mi |
| 52 Frances St Rochester, NY | 4.0 | 1.0 | 1256 | $1,595 | $1.27 | 43d | 1 | 1.48mi |
| 254 Lexington Ave Rochester, NY | 3.0 | 1.0 | 950 | $1,350 | $1.42 | 2d | 1 | 1.48mi |
Listing history 11 events
-
2026-05-18status Pending 307-char remark
-
2026-05-05$19,900 Active 307-char remark
-
2026-03-31historical
-
2025-12-15$29,900 Active
-
2022-09-20historical
-
2022-08-18price $36,000
-
2022-06-20$39,900 Active
-
2017-10-24soldstatus $20,900 Closed Sale or Rented
-
2017-08-28status Under Contract- Do Not Show
-
2017-07-18price $23,900
-
2017-05-03$29,900 Active
ⓘ Source: listings_history table (triggers on properties + properties_extension) + one-shot
backfill from property_details.listing_events for pre-trigger history.
Tax reassessment forecast NY · Partial reset (capped growth)
- Current annual tax
- $179 · $15/mo
- Projected year-2 tax
- $258 · $21/mo
- Expected delta
- +$79/yr (+$7/mo · 43.9%)
ⓘ Screening estimate from a state-policy table — verify with the county assessor before closing.
Climate risk First Street
- Flood 1/10 Low FEMA zone X (unshaded) · 0% chance over 30 yrs
- Wildfire 1/10 Low
- Heat 2/10 Low 7 d/yr ≥95°F today · 15 d/yr by 30 yrs out
- Wind 1/10 Low
- Air quality 2/10 Low 1 unhealthy d/yr today · 2 by 30 yrs out
Nearby sold comps map
Loading sold comps map…
Walkable amenities ~0.75 mi
Loading nearby amenities…
Taxation est. · year 1
- Rental income
- $20,768
- − Mortgage interest
- −$1,115
- − Property taxes
- −$179
- − Insurance
- −$100
- − Repairs & maintenance
- −$1,661
- − Management
- −$1,661
- − Depreciation
- −$579
- Taxable income
- $15,473
- Est. tax owed @ 24.0%
- −$3,713
- After-tax cash flow
- $11,162/yr
For passive investors: Depreciation is non-cash, so a rental often shows a tax loss while cash-flowing — sheltering income. Rental losses are passive: they offset passive income freely, and up to $25,000/yr can offset ordinary (W-2) income if you actively participate and your MAGI is under $100k (phasing out to $0 by $150k); unused losses carry forward. On sale, claimed depreciation is recaptured at up to 25%, and gains may owe capital-gains tax (a 1031 exchange can defer both). Figures are a year-1 estimate at your 24.0% rate — not tax advice; consult a CPA.
Schools (NCES district)
- District
- Rochester City School District
- NCES district ID
- 3624750
- Math proficiency
- 21% ▬ 0.00%
- Reading proficiency
- 26% ▲ 4.00%
- Median HH income
- $30,923
- Composite
- 18.98/100
- National rank
- #8850
- State rank
- #589 of 590 in NY
Livability — Rochester
- Score
- 76/100
- State rank
- #222
- US rank
- #3482
Category grades
Schools grade is shown separately in the Schools card above.
Census & demographics
- Census place
- Rochester, NY
- County
- Monroe County · 674,131 people
- City population
- 432,803
- Metro
- Rochester, NY
- Population (ZIP)
- 32,381
- Household income
- $35,383
- Rent vs Own
- Severe rent burden
- 2756.0
Population outlook (Monroe County) Hauer SSP2
- Today (2025)
- 759,460 people
- By 2030
- 757,154 · -0.3%
- By 2040
- 740,644 · -2.5%
- By 2050
- 714,443 · -5.9%
- By 2075
- 645,883 · -15.0%
- By 2100
- 547,084 · -28.0%
Race, ethnicity, and origin ACS 2023
- Neighborhood character
- Diverse neighborhood (Simpson 0.66)
- Race & ethnicity
- Hispanic / Latino 40% Black 40% White 14% Two or more races 12% Asian 1%
- Hispanic origin (detail)
- Mexican 1% Puerto Rican 32% Dominican 3%
- Common ancestry
- Romanian 1% Lithuanian 1% Serbian 1%
- Foreign-born
- 8% · Canada, Jamaica
- Languages at home
- 65% English-only · Spanish 30% Other Asian/Pacific 2% French/Haitian/Cajun 1%
Political lean MEDSL · Monroe
- 2024 margin
- D (+19.1) · D 59.5% · R 40.5%
- 2008→2024 swing
- +1.4pp toward D · 2008: 17.7pp · 2024: 19.1pp
- All cycles
- 2024: D+19.1 2020: D+21.0 2016: D+14.1 2012: D+17.4 2008: D+17.7
Not yet ingested
- Civics
- —
Market trends
- HPI YoY
- ▼ -10.66%
- Current HPI
- 254.1805
- Rent YoY
- ▲ 8.88%
- Metro
- Rochester, NY
- State GDP YoY
- ▲ 2.60%
- F500 in state
- 92
Industry mix (Fortune 500 HQ in NY)
| Industry | F500 HQs | Revenue |
|---|---|---|
| Financial Services | 10 | $950B |
|
||
| Consumer Goods | 9 | $162B |
|
||
| Insurance | 4 | $225B |
|
||
| Telecommunications | 2 | $144B |
|
||
| Pharmaceuticals | 2 | $112B |
|
||
| Media / Entertainment | 2 | $69B |
|
||
Price history
-33.4% since first listed11 events — show timeline
- 2026-05-18 Pending — UNYREIS
- 2026-05-05 Listed $19,900 UNYREIS
- 2026-03-31 Listing Removed — UNYREIS
- 2025-12-15 Listed $29,900 UNYREIS
- 2022-09-20 Listing Removed — UNYREIS
- 2022-08-18 Price Changed $36,000 UNYREIS
- 2022-06-20 Listed $39,900 UNYREIS
- 2017-10-24 Sold (MLS) $20,900 UNYREIS
- 2017-08-28 Pending — UNYREIS
- 2017-07-18 Price Changed $23,900 UNYREIS
- 2017-05-03 Listed $29,900 UNYREIS
Property tax history
-6.0%/yrLatest (2025): $179 · -49.2% YoY. Source: county tax records.
Cash-flow waterfall
monthlySold comps — $/sqft
last 12 mo · ≤1 miLoading sold comps…