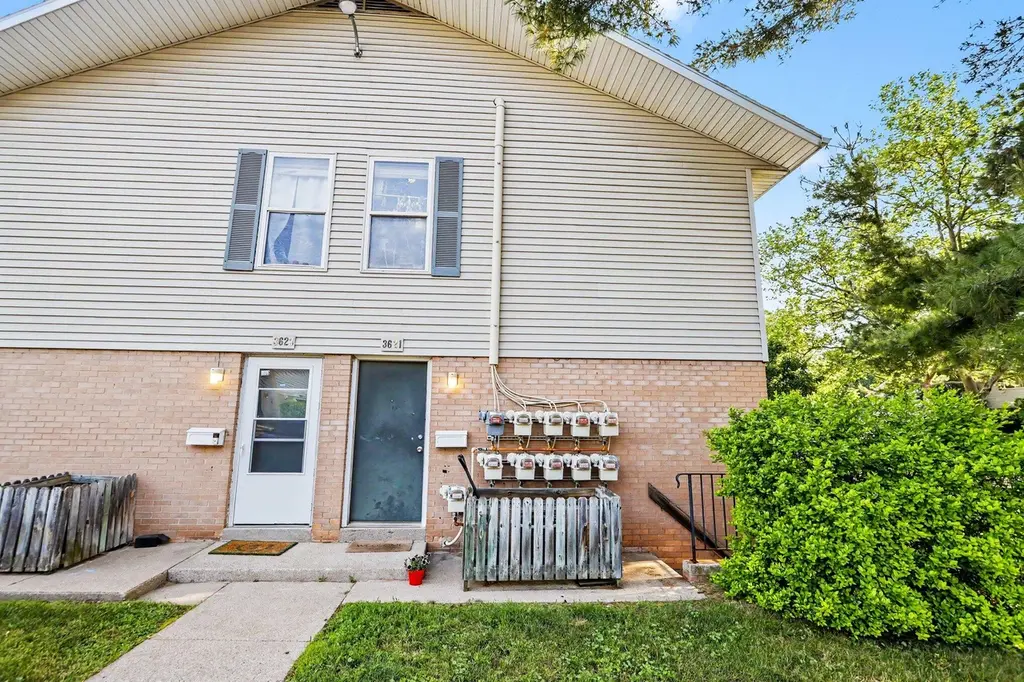
3621 Kenbrooke Ct #77 · Kalamazoo, MI
Flood risk 1/10 · Minimal
- FEMA flood zone
- X (unshaded)
- Chance of flooding over 30 yrs
- 0.0%
- Est. flood insurance / yr
- $507 – $1,088
Fire risk 1/10 · Minimal
- Est. fire insurance / yr
- $784 – $1,456
Heat risk 2/10 · Minimal
- Hot days now (above 100°F)
- 7 days/yr
- Hot days in 30 yrs
- 16 days/yr
Wind risk 2/10 · Minimal
- Chance of severe wind over 30 yrs
- —
Air-quality risk 2/10 · Minimal
- Unhealthy air days now
- 1 days/yr
- Unhealthy air days in 30 yrs
- 2 days/yr
Risk factors via First Street. Map © Google.
Why this score? — see what drove the D grade
The composite is a weighted blend of 9 inputs, each scored 0–100. Each bar is that input's sub-score; the figure is the points it added to the 100-point composite (weight × sub-score).
- Cash flow +10.5/30.0
- ARV discount +7.5/15.0
- 1% rule +6.5/10.0
- Schools +4.7/10.0
- Livability +3.8/5.0
- Rent growth +3.3/5.0
- DSCR +3.0/10.0
- Condition / age +2.2/5.0
- Appreciation +0.0/10.0
$89,900
🖨 Deal sheet 📄 Offer letter ✓ Due diligence
Listing remarks MLS
Close to WMU and K-College this condo is a great investment. End unit that features a great room space on the main floor and large upstairs bedroom with 2 closets upstairs. Sliders off the living room to a private patio. The building does have laundry facilities. Ample parking . Clubhouse and pool available to condo. Great rental or owner occupied. Walk to campus and the bus line.
Key facts
- Laundry facilities
- Clubhouse
- End unit
Tags
Property features AI
Finance
- HOA & community: Monthly association fee of $242; Association allows pets; Storage available through association
Exterior
- Utilities: Natural gas water heater
- Home design: Residential condominium; Other architectural style
- Construction: Built in 1960; Brick and vinyl siding construction
- Exterior features: Public water
Interior
- Kitchen: Range; Refrigerator
- Bathrooms: 1 full bathroom
- Heating & cooling: Forced air heating; Has cooling
- Interior features: Two total rooms; Basement (other)
Neighborhood map
What this means for you Summary
Snapshot
- This is a 1-bed/1.0-bath condo listed at $90k. Condition is rated fair.
Deal economics
- At list price, monthly cash flow is $-47 ($-559/yr) — negative.
- To cash-flow at today's rent, offer at most $83k (7.5% below list).
- Meets the 1% rule at list price ($1k rent vs $90k).
- Recommended offer: $83k (7.5% below list) — sets the bar for cash-flow.
- Cap rate 5.7% vs local median 4.1% in Kalamazoo — top-decile yield for the area; either an underpriced asset or a hidden risk that comps aren't pricing in. Stress-test before assuming the spread holds.
Location & tenants
- Location reads 76/100 on livability (#141 in MI, #3,492 nationally) — a middle-class / working-renter tenant base. Strengths: commute A+, cost of living A+, housing A+; Watch: crime F, employment D-.
- Kalamazoo Public Schools (urban): math 43% / reading 72% proficiency, ranked #71 of 540 in MI (top 13%) — acceptable for families but not a draw, mixed tenant base, ~2y average lease; 66% free/reduced lunch — lower-income household profile, screen leases tightly.
- Market conditions: Rents rising (+3.4%/yr); 105 active listings in the ZIP; 20 comparable units currently listed for rent nearby; rentals leasing fast (median 13d on market — plan ~1-2 weeks tenant-placement turnaround); lower-income renter base — watch delinquency; 339 units permitted in Kalamazoo County in 2024 (22 in 5+ unit buildings).
Forward outlook
- Local home prices are declining (-3.0%/yr); year-one equity from $622 of loan paydown is wiped out by about $3k of value loss. Plan a longer hold.
- Kalamazoo County population projected at +18% by 2050 — long-run rental-demand tailwind backs the buy-and-hold thesis.
Negotiation context
- It's been on market 15 days — a 2% lower offer ($89k) is reasonable based on typical stale-listing flexibility.
- 3 sale attempts with the ask held roughly flat each time — persistent listings suggest the price (not the market) is what's stuck; bring a comps-based counter.
Risks & watch-outs
- Watch-outs: HOA is 23% of rent.
Questions for the listing agent
- What do current leases actually rent for vs. the listed asking? Can we see a recent rent roll and the last 12 months of T-12 income?
- Have any recent inspections been done? Can we get a copy of the seller's disclosures and any deferred-maintenance estimates?
- Built in 1960 — when were the roof, HVAC, electrical panel, plumbing, and water heater last replaced?
- What does the HOA fee cover, when was the last increase, and are there any pending special assessments or reserve-fund shortfalls?
- Any open or pending special assessments — roof, HVAC, plumbing, elevator, façade? What's the per-unit balance and payoff schedule, and is the seller paying it off at close or rolling it to the buyer?
- Is there a deadline driving the sale (1031 exchange, divorce, estate, relocation)? That informs how much negotiation room exists.
- Crime grade is F in this area — have there been break-ins, vandalism, or insurance claims at this property in the last 3 years? What carrier currently insures it and at what premium?
- The area grade is low — what's the realistic commute time and amenity access for the typical tenant pool here? Any planned neighborhood developments (good or bad) we should know about?
- What's the average days-on-market for RENTAL listings here right now (not sales)? A rising rental-DOM trend means longer vacancies and softer asking-rent achievability than the comps imply.
- What's the recent tenant-quality profile in this submarket — average credit score on applications, eviction rate, late-payment / NSF rate, and stable-employment percentage? A property-management company in the area should have these aggregated.
- How much new apartment / multifamily construction is in the pipeline within 1–3 miles? Heavy new supply (>2% of stock underway) typically softens rents 12–24 months out; light construction supports rent growth.
Investment metrics
- 1% rule
- 1.15% ✓
- Cap rate
- 5.67%
- Cash-on-cash
- -2.22%
- DSCR
- 0.90
- GRM
- 7.2
CMA / ARV
No comps found within radius.
Projected returns pro-forma
-3.0% appreciation · 3.39% rent growth · sell at horizon
- IRR
- -19.1%
- Equity multiple
- 0.33×
- Total profit
- $-16,965
- Equity at exit
- $13,404
- IRR
- -10.3%
- Equity multiple
- 0.35×
- Total profit
- $-16,243
- Equity at exit
- $7,773
Cash invested: $25,172 (down + closing). Projections, not guarantees.
Landlord ↔ Tenant lean methodology
- Overall (STATE)
- 62 Landlord-Friendly
- State Michigan
- 62 Landlord-Friendly · EVEN
- County
- — inherits STATE
- City
- — inherits STATE
ZIP-level market 49006
- Rents YoY
- 3.4%
- Active inventory
- 105
- Price-to-rent
- 7.2×
Monthly cashflow live
- Estimated rent
- $1,034 high interval (Pro) →
- Mortgage (P&I)
- −$471
- Tax est. 1.5%
- −$112 /mo · $1,348/yr
- Insurance
- −$37
- HOA
- −$242
- Vacancy / Maint / Mgmt
- −$217
- Net cashflow
- $-47
Break-even live
UW: 25.0% down · 7.5% · 30yr · 1.5% tax · 5.0% vac · 8.0% maint · 8.0% mgmt
Financing live
Cash to close
- Down payment
- $22,475
- Closing costs
- $2,697
- Reserves months
- —
- Total cash needed
- —
Loan-product check · same deal, 3 products live
Conventional
25% down · 7.5% · 30yr
- Down + closing
- —
- Monthly P&I
- —
- Monthly cashflow
- —
- DSCR
- —
- Eligible?
- —
Personal DTI + credit; lowest rate.
DSCR
20% down · 8.5% · 30yr
- Down + closing
- —
- Monthly P&I
- —
- Monthly cashflow
- —
- DSCR
- —
- Eligible?
- —
No personal income docs; deal must DSCR.
Hard money
10% down · 12.0% · 12mo
- Down + closing
- —
- Monthly P&I
- —
- Monthly cashflow
- —
- DSCR
- —
- Eligible?
- —
Short-term bridge; refi at stabilization.
Rent comps 20 comps
| Address | Beds | Baths | Sqft | Rent | $/sqft | DOM | Units | Dist |
|---|---|---|---|---|---|---|---|---|
| 3409 W Michigan Ave Unit 1 Kalamazoo, MI | 2.0 | 1.5 | 884 | $985 | $1.11 | 13d | 1 | 0.12mi |
| 3614 Stadium Dr Kalamazoo, MI | 1.0–3.0 | 1.0–2.0 | 928 | $1,099 | $1.18 | 13d | 1 | 0.30mi |
| 4130 W Michigan Ave Kalamazoo, MI | 1.0–2.0 | 1.0–2.0 | 625 | $610 | $0.98 | 13d | 4 | 0.38mi |
| 1201 Greenwood Ave Unit 1 Kalamazoo, MI | 2.0 | 2.0 | 1000 | $1,200 | $1.20 | 21d | 1 | 0.46mi |
| 4346 N Hills Dr Kalamazoo, MI | 2.0–4.0 | 2.0–4.0 | 1093 | $440 | $0.40 | 21d | 1 | 0.49mi |
| 1010 Emajean St Kalamazoo, MI | 2.0–4.0 | 1.0–3.0 | 1249 | $440 | $0.35 | 21d | 1 | 0.52mi |
| 4520 Dover Hills Dr Kalamazoo, MI | 1.0–2.0 | 1.0–2.0 | 987 | $1,185 | $1.20 | 13d | 12 | 0.65mi |
| 332 S Kendall Ave Kalamazoo, MI | 1.0–2.0 | 1.0–2.0 | 780 | $975 | $1.25 | 21d | 4 | 0.91mi |
| 704 S Drake Rd Kalamazoo, MI | 1.0–3.0 | 1.0–1.5 | 887 | $870 | $0.98 | 13d | 16 | 0.99mi |
| 125 S Kendall Ave Kalamazoo, MI | 1.0–2.0 | 1.0–1.5 | 735 | $875 | $1.19 | 21d | 6 | 1.06mi |
| 1400 Concord Pl Dr Kalamazoo, MI | 2.0 | 1.0 | 557 | $876 | $1.57 | 13d | 46 | 1.18mi |
| 320 S Drake Rd Kalamazoo, MI | 2.0 | 1.0 | 950 | $1,020 | $1.07 | 21d | 1 | 1.25mi |
| 690 Dragonfly Rd Kalamazoo, MI | 1.0–3.0 | 1.0–2.0 | 969 | $765 | $0.79 | 13d | 32 | 1.25mi |
| 318 N Sage St Kalamazoo, MI | 1.0–2.0 | 1.0 | 824 | $1,025 | $1.24 | 13d | 3 | 1.33mi |
| 3420 W Main St Kalamazoo, MI | 2.0 | 1.5–2.0 | 852 | $1,085 | $1.27 | 13d | 4 | 1.34mi |
| 1800 S 11th St Kalamazoo, MI | 1.0–2.0 | 1.0 | 635 | $799 | $1.26 | 21d | 9 | 1.36mi |
| 1842 S 11th St Kalamazoo, MI | 1.0 | 1.0 | 547 | $975 | $1.78 | 13d | 1 | 1.37mi |
| 5500 W KL Ave Kalamazoo, MI | 1.0–3.0 | 1.0–2.0 | 836 | $999 | $1.19 | 13d | 1 | 1.37mi |
| 5540 W Michigan Ave Kalamazoo, MI | — | 1.0 | 950 | $600 | $0.63 | 21d | 1 | 1.41mi |
| 136 S Berkley St Kalamazoo, MI | 2.0 | 1.0 | 840 | $1,195 | $1.42 | 21d | 1 | 1.48mi |
HOA detail condo
- Monthly dues
- $242 · $2,904/yr
- Likely covers
- pool
- Assessments
- None detected in remarks — confirm with the listing agent.
Listing history 12 events
-
2026-06-18days on market $89,900 Active 15 DOM
-
2026-06-17days on market $89,900 Active 14 DOM
-
2026-06-16days on market $89,900 Active 13 DOM
-
2026-06-15days on market $89,900 Active 12 DOM
-
2026-06-14days on market $89,900 Active 10 DOM
-
2026-06-13days on market $89,900 Active 9 DOM
-
2026-06-10days on market $89,900 Active 7 DOM
-
2026-06-09days on market $89,900 Active 6 DOM
-
2026-06-08days on market $89,900 Active 5 DOM
-
2026-06-07days on market $89,900 Active 4 DOM
-
2026-06-05remarks 383-char remark
-
2026-06-05$89,900 Active 1 DOM
ⓘ Source: listings_history table (triggers on properties + properties_extension) + one-shot
backfill from property_details.listing_events for pre-trigger history.
Climate risk First Street
- Flood 1/10 Low FEMA zone X (unshaded) · 0% chance over 30 yrs
- Wildfire 1/10 Low
- Heat 2/10 Low 7 d/yr ≥100°F today · 16 d/yr by 30 yrs out
- Wind 2/10 Low
- Air quality 2/10 Low 1 unhealthy d/yr today · 2 by 30 yrs out
Nearby sold comps map
Loading sold comps map…
Walkable amenities ~0.75 mi
Loading nearby amenities…
Taxation est. · year 1
- Rental income
- $12,405
- − Mortgage interest
- −$5,036
- − Property taxes
- −$1,348
- − Insurance
- −$450
- − Repairs & maintenance
- −$992
- − Management
- −$992
- − HOA
- −$2,904
- − Depreciation
- −$2,615
- Taxable loss
- −$1,933
- Est. tax savings @ 24.0%
- +$464
- After-tax cash flow
- $-95/yr
For passive investors: Depreciation is non-cash, so a rental often shows a tax loss while cash-flowing — sheltering income. Rental losses are passive: they offset passive income freely, and up to $25,000/yr can offset ordinary (W-2) income if you actively participate and your MAGI is under $100k (phasing out to $0 by $150k); unused losses carry forward. On sale, claimed depreciation is recaptured at up to 25%, and gains may owe capital-gains tax (a 1031 exchange can defer both). Figures are a year-1 estimate at your 24.0% rate — not tax advice; consult a CPA.
Condition & rehab AI · 13 photos
This condo requires moderate updates to kitchen cabinets and exterior paint to improve its condition and value.
Repairs flagged
- Moderate kitchen cabinets — dated and worn
- Minor bathroom fixtures — standard fixtures, no visible damage
Value-add opportunities
- Both update kitchen cabinets — modernizing kitchen and increasing appeal
- Both paint exterior — enhances curb appeal and value
- Both update bathroom fixtures — modernizing bathroom and increasing appeal
Renovation cost estimate screening
| Repair item | Severity | Est. cost |
|---|---|---|
| kitchen cabinets · dated and worn | Moderate | $3,000–15,000 |
| bathroom fixtures · standard fixtures, no visible damage | Minor | $500–3,000 |
| Total estimated repair cost · 2 items | $3,500–18,000 |
Value-add ROI direction
- Both update kitchen cabinets — modernizing kitchen and increasing appeal ↑
- Both paint exterior — enhances curb appeal and value ↑
- Both update bathroom fixtures — modernizing bathroom and increasing appeal ↑
ⓘ Cost ranges are severity-bucket heuristics (US national rule-of-thumb). Get contractor quotes + a written scope before underwriting a rehab budget.
Schools (NCES district)
- District
- Kalamazoo Public Schools
- NCES district ID
- 2619950
- Math proficiency
- 43% ▲ 13.00%
- Reading proficiency
- 72% ▲ 33.00%
- Median HH income
- $35,291
- Composite
- 47.48/100
- National rank
- #2275
- State rank
- #71 of 540 in MI
Livability — Kalamazoo
- Score
- 76/100
- State rank
- #141
- US rank
- #3492
Category grades
Schools grade is shown separately in the Schools card above.
Census & demographics
- Census place
- Kalamazoo, MI
- County
- Kalamazoo County · 224,317 people
- City population
- 121,397
- Metro
- Kalamazoo-Portage, MI
- Population (ZIP)
- 26,507
- Household income
- $43,639
- Rent vs Own
- Severe rent burden
- 2581.0
Population outlook (Kalamazoo County) Hauer SSP2
- Today (2025)
- 280,982 people
- By 2030
- 292,068 · +3.9%
- By 2040
- 312,191 · +11.1%
- By 2050
- 331,196 · +17.9%
- By 2075
- 379,021 · +34.9%
- By 2100
- 396,579 · +41.1%
Race, ethnicity, and origin ACS 2023
- Neighborhood character
- Diverse neighborhood (Simpson 0.55)
- Race & ethnicity
- White 65% Black 14% Two or more races 10% Hispanic / Latino 9% Asian 4%
- Hispanic origin (detail)
- Mexican 6%
- Common ancestry
- Iranian 6% Romanian 4% Italian 3%
- Foreign-born
- 9% · Canada, South Korea, China
- Languages at home
- 89% English-only · Spanish 5% Other Indo-European 2% French/Haitian/Cajun 2%
Political lean MEDSL · Kalamazoo
- 2024 margin
- D (+17.7) · D 58.0% · R 40.3% · Other 1.7%
- 2008→2024 swing
- -1.8pp toward R · 2008: 19.5pp · 2024: 17.7pp
- All cycles
- 2024: D+17.7 2020: D+18.7 2016: D+12.8 2012: D+13.3 2008: D+19.5
Not yet ingested
- Civics
- —
Market trends
- HPI YoY
- ▼ -235.52%
- Current HPI
- 243.4367
- Rent YoY
- ▲ 3.39%
- Metro
- Kalamazoo-Portage, MI
- State GDP YoY
- ▲ 1.37%
- F500 in state
- 28
Industry mix (Fortune 500 HQ in MI)
| Industry | F500 HQs | Revenue |
|---|---|---|
| Automotive Parts | 3 | $48B |
|
||
| Automotive | 2 | $372B |
|
||
| Chemicals | 1 | $45B |
|
||
| Automotive Retail | 1 | $29B |
|
||
| Healthcare / Medical Devices | 1 | $23B |
|
||
| Automotive Technology | 1 | $20B |
|
||
Price history
+0.0% since first listed3 events — show timeline
- 2026-06-03 Listed $89,900 MiRealSource-MiMLS
- 2026-06-03 Listed $89,900 REALCOMP
- 2026-06-03 Listed $89,900 SW Michigan MLS
Cash-flow waterfall
monthlySold comps — $/sqft
last 12 mo · ≤1 miLoading sold comps…