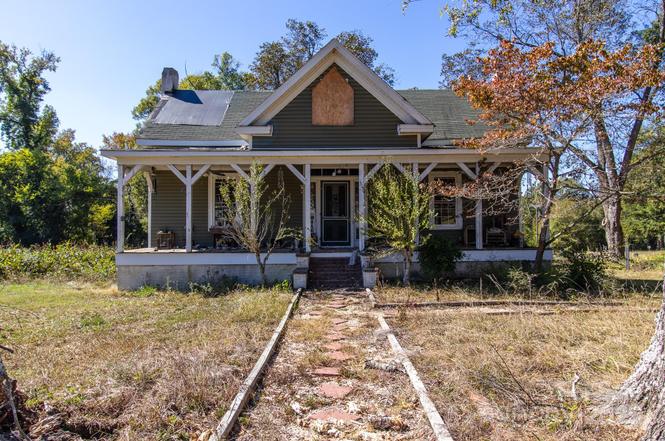
3062 Michelle Dr · Chester, SC
Flood risk 1/10 · Minimal
- FEMA flood zone
- X (unshaded)
- Chance of flooding over 30 yrs
- 0.0%
- Est. flood insurance / yr
- —
Fire risk 3/10 · Minor
- Est. fire insurance / yr
- $783 – $1,453
Heat risk 6/10 · Moderate
- Hot days now (above 106°F)
- 7 days/yr
- Hot days in 30 yrs
- 16 days/yr
Wind risk 6/10 · Moderate
- Chance of severe wind over 30 yrs
- 43.0%
Air-quality risk No data
- Unhealthy air days now
- —
- Unhealthy air days in 30 yrs
- —
Risk factors via First Street. Map © Google.
Why this score? — see what drove the B grade
The composite is a weighted blend of 9 inputs, each scored 0–100. Each bar is that input's sub-score; the figure is the points it added to the 100-point composite (weight × sub-score).
- Cash flow +30.0/30.0
- 1% rule +10.0/10.0
- DSCR +10.0/10.0
- ARV discount +7.5/15.0
- Appreciation +6.6/10.0
- Schools +2.6/10.0
- Livability +2.6/5.0
- Rent growth +2.5/5.0
- Condition / age +2.5/5.0
$100,000
🖨 Deal sheet 📄 Offer letter ✓ Due diligence
Listing remarks
Investor special or rebuild opportunity! This 4-bedroom, 3-bath home sits on 2.4 acres and includes a basement, storage shed, and an additional building once used as a store. The property was impacted by a fire in September 2024 and is ready for someone with vision to restore or rebuild to its full potential. Well and septic are already installed on the property. Conveniently located approximately 10 minutes from Chester and just 15 minutes from I-77, this property offers peaceful rural living with easy access to nearby towns. Home is SOLD AS IS!! * * * * Seller is extremely motivated and welcomes all offers * * * * *
Key facts
- Well and septic
- Storage shed
- Additional building
Tags
Property features AI
Finance
- HOA & community: No HOA
Exterior
- Parking: Driveway
- Utilities: Well water (and other - see remarks); Septic system installed
- Home design: Single family residence; Residential property; Two levels; Basement entry level; Site built
- Construction: Vinyl exterior; Basement foundation
- Exterior features: Located on a publicly maintained dirt/gravel road; Lot approximately 2.407 acres
Interior
- Kitchen: Dishwasher; Gas range
- Bedrooms: 4 bedrooms (2 on main level, 2 on upper level)
- Bathrooms: 3 full bathrooms
- Heating & cooling: Natural gas heating; Central air conditioning
- Interior features: Unfinished basement; Fireplace; Room count: 4
- Laundry & utility: Laundry room; Washer/Dryer included
Neighborhood map
What this means for you Summary
Snapshot
- This is a 4-bed/3.0-bath single-family listed at $100k.
Deal economics
- At list price, monthly cash flow is $734 ($9k/yr) — positive.
- The deal already cash-flows at list — no discount required.
- Meets the 1% rule at list price ($2k rent vs $100k).
- Recommended offer: $88k (12.0% below list) — sets the bar for market timing.
- Cap rate 15.1% vs local median 2.7% in Chester — top-decile yield for the area; either an underpriced asset or a hidden risk that comps aren't pricing in. Stress-test before assuming the spread holds.
Location & tenants
- Location reads 52/100 on livability (#344 in SC) — a working-class tenant base; expect higher turnover. Strengths: cost of living A+, housing B; Watch: schools F, crime F, amenities F.
- Fairfield 01 (rural): math 26% / reading 38% proficiency, ranked #53 of 80 in SC (top 66%) — families likely to look elsewhere, expect single-tenant / working-renter base with shorter leases; 80% free/reduced lunch — lower-income household profile, screen leases tightly.
- Market conditions: 17 active listings in the ZIP; 91 units permitted in Fairfield County in 2024 (0 in 5+ unit buildings).
Forward outlook
- In year one you build about $4k of equity ($691 loan paydown + $3k appreciation (3.2% local appreciation)).
- Fairfield County population projected at -32% by 2050 — secular population decline; favor cash flow + early exit over multi-decade hold.
- At projected returns (3.2% appreciation + 3.0% rent growth), your $28k cash investment doubles in ~3 years — after that, you're playing with house money.
- By year 9, paydown + projected appreciation supports a ~$33k cash-out refi (75% LTV) — recoverable capital for the next deal without selling this one.
Negotiation context
- It's been on market 245 days — a 12% lower offer ($88k) is reasonable based on typical stale-listing flexibility.
Risks & watch-outs
- Watch-outs: built in 1904 — expect roof / HVAC / electrical / plumbing capex.
- Climate carrying-cost: major wind risk, 43% chance of damaging wind over 30y; extreme-heat days projected 7→16/yr by 2055 (HVAC capex compounding) — expect insurance premiums to compound above CPI over the hold.
Questions for the listing agent
- It's been on market 245 days. Have you received any prior offers? Is the seller open to a 12% concession, seller financing, or rate buy-down credit?
- Built in 1904 — when were the roof, HVAC, electrical panel, plumbing, and water heater last replaced?
- Why hasn't it sold? Are there any deal-killer items the seller is aware of (foundation, flood, title, zoning, code violations)?
- Is there a deadline driving the sale (1031 exchange, divorce, estate, relocation)? That informs how much negotiation room exists.
- Schools are F-rated, which usually means shorter tenancies and higher turnover. Who's the typical renter profile here, and what's been the actual vacancy rate?
- Crime grade is F in this area — have there been break-ins, vandalism, or insurance claims at this property in the last 3 years? What carrier currently insures it and at what premium?
- What's the average days-on-market for RENTAL listings here right now (not sales)? A rising rental-DOM trend means longer vacancies and softer asking-rent achievability than the comps imply.
- What's the recent tenant-quality profile in this submarket — average credit score on applications, eviction rate, late-payment / NSF rate, and stable-employment percentage? A property-management company in the area should have these aggregated.
- How much new for-sale + rental construction is in the pipeline within 1–3 miles? Heavy new supply typically softens prices + rents 12–24 months out; constrained supply supports both.
Investment metrics
- 1% rule
- 1.68% ✓
- Cap rate
- 15.10%
- Cash-on-cash
- 31.44%
- DSCR
- 2.40
- GRM
- 4.9
CMA / ARV
No comps found within radius.
Projected returns pro-forma
3.17% appreciation · 3.0% rent growth · sell at horizon
- IRR
- 37.5%
- Equity multiple
- 3.13×
- Total profit
- $59,643
- Equity at exit
- $45,925
- IRR
- 37.4%
- Equity multiple
- 6.20×
- Total profit
- $145,697
- Equity at exit
- $71,531
Cash invested: $28,000 (down + closing). Projections, not guarantees.
Landlord ↔ Tenant lean methodology
- Overall (STATE)
- 90 Strongly Landlord-Friendly
- State South Carolina
- 90 Strongly Landlord-Friendly · R+6
- County
- — inherits STATE
- City
- — inherits STATE
ZIP-level market 29014
- Home prices YoY
- 0.9%
- Active inventory
- 17
- Price-to-rent
- 4.9×
Monthly cashflow live
- Estimated rent
- $1,684 medium interval (Pro) →
- Mortgage (P&I)
- −$524
- Tax from tax record
- −$31 /mo · $367/yr
- Insurance
- −$42
- HOA
- −$0
- Vacancy / Maint / Mgmt
- −$354
- Net cashflow
- $734
Break-even live
UW: 25.0% down · 7.5% · 30yr · 1.5% tax · 5.0% vac · 8.0% maint · 8.0% mgmt
Financing live
Cash to close
- Down payment
- $25,000
- Closing costs
- $3,000
- Reserves months
- —
- Total cash needed
- —
Loan-product check · same deal, 3 products live
Conventional
25% down · 7.5% · 30yr
- Down + closing
- —
- Monthly P&I
- —
- Monthly cashflow
- —
- DSCR
- —
- Eligible?
- —
Personal DTI + credit; lowest rate.
DSCR
20% down · 8.5% · 30yr
- Down + closing
- —
- Monthly P&I
- —
- Monthly cashflow
- —
- DSCR
- —
- Eligible?
- —
No personal income docs; deal must DSCR.
Hard money
10% down · 12.0% · 12mo
- Down + closing
- —
- Monthly P&I
- —
- Monthly cashflow
- —
- DSCR
- —
- Eligible?
- —
Short-term bridge; refi at stabilization.
Listing history 17 events
-
2026-06-18days on market $100,000 Active 245 DOM
-
2026-06-17days on market $100,000 Active 244 DOM
-
2026-06-16days on market $100,000 Active 243 DOM
-
2026-06-15days on market $100,000 Active 242 DOM
-
2026-06-14days on market $100,000 Active 240 DOM
-
2026-06-13days on market $100,000 Active 239 DOM
-
2026-06-10days on market $100,000 Active 237 DOM
-
2026-06-09days on market $100,000 Active 236 DOM
-
2026-06-08days on market $100,000 Active 235 DOM
-
2026-06-07days on market $100,000 Active 234 DOM
-
2026-06-03days on market $100,000 Active 230 DOM
-
2026-06-03days on market $100,000 Active 229 DOM
-
2026-06-01days on market $100,000 Active 228 DOM
-
2026-05-31days on market $100,000 Active 227 DOM
-
2026-01-14price $100,000
-
2026-01-09price $60,000
-
2025-10-17$150,000 Active
ⓘ Source: listings_history table (triggers on properties + properties_extension) + one-shot
backfill from property_details.listing_events for pre-trigger history.
Tax reassessment forecast SC · Resets to sale price
- Current annual tax
- $367 · $31/mo
- Projected year-2 tax
- $570 · $48/mo
- Expected delta
- +$203/yr (+$17/mo · 55.1%)
ⓘ Screening estimate from a state-policy table — verify with the county assessor before closing.
Climate risk First Street
- Flood 1/10 Low FEMA zone X (unshaded) · 0% chance over 30 yrs
- Wildfire 3/10 Moderate
- Heat 6/10 Major 7 d/yr ≥106°F today · 16 d/yr by 30 yrs out
- Wind 6/10 Major 43% chance of damaging wind over 30 yrs
Nearby sold comps map
Loading sold comps map…
Walkable amenities ~0.75 mi
Loading nearby amenities…
Taxation est. · year 1
- Rental income
- $20,208
- − Mortgage interest
- −$5,602
- − Property taxes
- −$367
- − Insurance
- −$500
- − Repairs & maintenance
- −$1,617
- − Management
- −$1,617
- − Depreciation
- −$2,909
- Taxable income
- $7,596
- Est. tax owed @ 24.0%
- −$1,823
- After-tax cash flow
- $6,981/yr
For passive investors: Depreciation is non-cash, so a rental often shows a tax loss while cash-flowing — sheltering income. Rental losses are passive: they offset passive income freely, and up to $25,000/yr can offset ordinary (W-2) income if you actively participate and your MAGI is under $100k (phasing out to $0 by $150k); unused losses carry forward. On sale, claimed depreciation is recaptured at up to 25%, and gains may owe capital-gains tax (a 1031 exchange can defer both). Figures are a year-1 estimate at your 24.0% rate — not tax advice; consult a CPA.
Schools (NCES district)
- District
- Fairfield 01
- NCES district ID
- 4502100
- Math proficiency
- 26% ▼ -10.00%
- Reading proficiency
- 38% ▲ 4.00%
- Median HH income
- $34,836
- Composite
- 26.37/100
- National rank
- #7232
- State rank
- #53 of 80 in SC
Livability — Chester
- Score
- 52/100
- State rank
- #344
- US rank
- #24754
Category grades
Schools grade is shown separately in the Schools card above.
Census & demographics
- Population (ZIP)
- 1,229
Population outlook (Fairfield County) Hauer SSP2
- Today (2025)
- 21,017 people
- By 2030
- 19,778 · -5.9%
- By 2040
- 16,973 · -19.2%
- By 2050
- 14,251 · -32.2%
- By 2075
- 9,195 · -56.2%
- By 2100
- 5,722 · -72.8%
Race, ethnicity, and origin ACS 2023
- Neighborhood character
- Predominantly White (81%)
- Race & ethnicity
- White 81% Black 18% Two or more races 2%
- Common ancestry
- Serbian 12%
- Languages at home
- 99% English-only · German/W. Germanic 1%
Political lean MEDSL · Fairfield
- 2024 margin
- D (+13.2) · D 56.0% · R 42.7% · Other 1.3%
- 2008→2024 swing
- -18.4pp toward R · 2008: 31.7pp · 2024: 13.2pp
- All cycles
- 2024: D+13.2 2020: D+22.7 2016: D+25.9 2012: D+31.6 2008: D+31.7
Not yet ingested
- Civics
- —
Market trends
- HPI YoY
- ▲ 3.17%
- Current HPI
- 358.1915
- Rent YoY
- —
- Metro
- —
- State GDP YoY
- ▲ 4.51%
- F500 in state
- 2
Industry mix (Fortune 500 HQ in SC)
| Industry | F500 HQs | Revenue |
|---|---|---|
| Packaging | 1 | $7B |
|
||
Price history
-33.3% since first listed3 events — show timeline
- 2026-01-14 Price Changed $100,000 CANOPYMLS as Distributed by MLS Grid
- 2026-01-09 Price Changed $60,000 CANOPYMLS as Distributed by MLS Grid
- 2025-10-17 Listed $150,000 CANOPYMLS as Distributed by MLS Grid
Property tax history
-3.7%/yrLatest (2025): $367 · +9.3% YoY. Source: county tax records.
Cash-flow waterfall
monthlySold comps — $/sqft
last 12 mo · ≤1 miLoading sold comps…