75 Atterbury Blvd · Hudson, OH
Flood risk 6/10 · Moderate
- FEMA flood zone
- X (unshaded)
- Chance of flooding over 30 yrs
- 0.27%
- Est. flood insurance / yr
- $507 – $1,088
Fire risk 1/10 · Minimal
- Est. fire insurance / yr
- $713 – $1,323
Heat risk 3/10 · Minor
- Hot days now (above 96°F)
- 7 days/yr
- Hot days in 30 yrs
- 17 days/yr
Wind risk 1/10 · Minimal
- Chance of severe wind over 30 yrs
- —
Air-quality risk 3/10 · Minor
- Unhealthy air days now
- 2 days/yr
- Unhealthy air days in 30 yrs
- 4 days/yr
Risk factors via First Street. Map © Google.
Why this score? — see what drove the B- grade
The composite is a weighted blend of 9 inputs, each scored 0–100. Each bar is that input's sub-score; the figure is the points it added to the 100-point composite (weight × sub-score).
- Cash flow +23.0/30.0
- 1% rule +10.0/10.0
- Schools +7.9/10.0
- ARV discount +7.5/15.0
- DSCR +7.4/10.0
- Livability +4.4/5.0
- Rent growth +2.5/5.0
- Condition / age +2.5/5.0
- Appreciation +0.0/10.0
$129,997
🖨 Deal sheet 📄 Offer letter ✓ Due diligence
Listing remarks
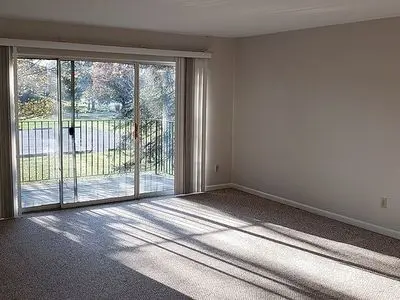
Awesome condo available at Versailles in Hudson! Newly updated and clean 1 bedroom condo with large open rooms and walk in closet. Walking distance to downtown shops/restaurants and next to The Brew Kettle and Chipotle. Wont last long! All utilities included. 12 month lease.
Key facts
- Next to chipotle
- Walk in closet
- Large open rooms
Tags
Neighborhood map
What this means for you Summary
Snapshot
- This is a 1-bed/1.0-bath condo listed at $130k.
Deal economics
- At list price, monthly cash flow is $231 ($3k/yr) — positive.
- The deal already cash-flows at list — no discount required.
- Meets the 1% rule at list price ($2k rent vs $130k).
- Recommended offer: $126k (3.0% below list) — sets the bar for market timing.
- Cap rate 8.4% vs local median 2.6% in Hudson — top-decile yield for the area; either an underpriced asset or a hidden risk that comps aren't pricing in. Stress-test before assuming the spread holds.
Location & tenants
- Location reads 88/100 on livability (#20 in OH, #196 nationally) — a professional / high-income tenant draw. Strengths: schools A+, crime A+, amenities A+; Watch: commute F, cost of living F.
- Hudson City (suburban): math 84% / reading 88% proficiency, ranked #4 of 656 in OH (top 1%) — strong family-tenant draw, lease renewals of 3-5y typical; only 4% free/reduced lunch — higher-income household profile.
- Market conditions: 95 active listings in the ZIP; 2 comparable units currently listed for rent nearby; high-income renter base; 1,114 units permitted in Summit County in 2024 (397 in 5+ unit buildings).
- This rent is only 14% of the median local income ($169k/yr) — well below the 30% rent-burden line; pricing power to push rent on renewal without tenant pushback.
Forward outlook
- Local home prices are declining (-3.0%/yr); year-one equity from $899 of loan paydown is wiped out by about $4k of value loss. Plan a longer hold.
- Summit County population projected to shrink 6% by 2050 — rents likely to lag national; underwrite the cash flow, not the appreciation.
Negotiation context
- It's been on market 34 days — a 3% lower offer ($126k) is reasonable based on typical stale-listing flexibility.
- 6 sale attempts since 24y ago with the ask held roughly flat each time — persistent listings suggest the price (not the market) is what's stuck; bring a comps-based counter.
- Current owner paid $64k; list at $130k implies a 102% gain — meaningful room to come down on a strong offer.
Risks & watch-outs
- Watch-outs: HOA is 23% of rent.
- Climate carrying-cost: major flood risk — expect insurance premiums to compound above CPI over the hold.
Questions for the listing agent
- It's been on market 34 days. Have you received any prior offers? Is the seller open to a 3% concession, seller financing, or rate buy-down credit?
- Built in 1970 — when were the roof, HVAC, electrical panel, plumbing, and water heater last replaced?
- What does the HOA fee cover, when was the last increase, and are there any pending special assessments or reserve-fund shortfalls?
- Any open or pending special assessments — roof, HVAC, plumbing, elevator, façade? What's the per-unit balance and payoff schedule, and is the seller paying it off at close or rolling it to the buyer?
- Is there a deadline driving the sale (1031 exchange, divorce, estate, relocation)? That informs how much negotiation room exists.
- Schools are A-rated — typically a magnet for longer-tenancy family renters. What's the average tenant stay here, and is there a school-zone premium baked into asking?
- What's the average days-on-market for RENTAL listings here right now (not sales)? A rising rental-DOM trend means longer vacancies and softer asking-rent achievability than the comps imply.
- What's the recent tenant-quality profile in this submarket — average credit score on applications, eviction rate, late-payment / NSF rate, and stable-employment percentage? A property-management company in the area should have these aggregated.
- How much new apartment / multifamily construction is in the pipeline within 1–3 miles? Heavy new supply (>2% of stock underway) typically softens rents 12–24 months out; light construction supports rent growth.
Investment metrics
- 1% rule
- 1.52% ✓
- Cap rate
- 8.43%
- Cash-on-cash
- 7.61%
- DSCR
- 1.34
- GRM
- 5.5
CMA / ARV
No comps found within radius.
Projected returns pro-forma
-3.0% appreciation · 3.0% rent growth · sell at horizon
- IRR
- -4.4%
- Equity multiple
- 0.83×
- Total profit
- $-6,061
- Equity at exit
- $19,383
- IRR
- 5.5%
- Equity multiple
- 1.41×
- Total profit
- $14,855
- Equity at exit
- $11,240
Cash invested: $36,399 (down + closing). Projections, not guarantees.
Landlord ↔ Tenant lean methodology
- Overall (STATE)
- 73 Landlord-Friendly
- State Ohio
- 73 Landlord-Friendly · R+6
- County
- — inherits STATE
- City
- — inherits STATE
ZIP-level market 44236
- Active inventory
- 95
- Price-to-rent
- 5.5×
Monthly cashflow live
- Estimated rent
- $1,972 medium interval (Pro) →
- Mortgage (P&I)
- −$682
- Tax from tax record
- −$140 /mo · $1,679/yr
- Insurance
- −$54
- HOA est. from 2 same-building comps
- −$451
- Vacancy / Maint / Mgmt
- −$414
- Net cashflow
- $231
Break-even live
UW: 25.0% down · 7.5% · 30yr · 1.5% tax · 5.0% vac · 8.0% maint · 8.0% mgmt
Financing live
Cash to close
- Down payment
- $32,499
- Closing costs
- $3,900
- Reserves months
- —
- Total cash needed
- —
Loan-product check · same deal, 3 products live
Conventional
25% down · 7.5% · 30yr
- Down + closing
- —
- Monthly P&I
- —
- Monthly cashflow
- —
- DSCR
- —
- Eligible?
- —
Personal DTI + credit; lowest rate.
DSCR
20% down · 8.5% · 30yr
- Down + closing
- —
- Monthly P&I
- —
- Monthly cashflow
- —
- DSCR
- —
- Eligible?
- —
No personal income docs; deal must DSCR.
Hard money
10% down · 12.0% · 12mo
- Down + closing
- —
- Monthly P&I
- —
- Monthly cashflow
- —
- DSCR
- —
- Eligible?
- —
Short-term bridge; refi at stabilization.
Rent comps 2 comps
| Address | Beds | Baths | Sqft | Rent | $/sqft | DOM | Units | Dist |
|---|---|---|---|---|---|---|---|---|
| 77 Atterbury Blvd Hudson, OH | 2.0 | 2.0 | 1126 | $1,920 | $1.70 | 14d | 2 | 0.09mi |
| 77 Atterbury Blvd #208 Hudson, OH | 2.0 | 2.0 | 1060 | $1,990 | $1.88 | 23d | 1 | 0.10mi |
HOA detail condo
- Monthly dues
- $0 · $0/yr
- Assessments
- None detected in remarks — confirm with the listing agent.
Listing history 29 events
-
2026-06-15days on market $129,997 Active 34 DOM
-
2026-06-14days on market $129,997 Active 32 DOM
-
2026-06-10days on market $129,997 Active 29 DOM
-
2026-06-09days on market $129,997 Active 28 DOM
-
2026-06-08days on market $129,997 Active 27 DOM
-
2026-06-07days on market $129,997 Active 26 DOM
-
2026-06-03days on market $129,997 Active 22 DOM
-
2026-06-02days on market $129,997 Active 21 DOM
-
2026-06-01days on market $129,997 Active 20 DOM
-
2026-05-31days on market $129,997 Active 19 DOM
-
2026-05-31days on market $129,997 Active 18 DOM
-
2026-05-13price $129,997
-
2026-05-12$134,997 Active
-
2017-05-01soldstatus $64,500
-
2013-06-24soldstatus $48,500
-
2009-03-19historical
-
2008-10-16$69,711
-
2008-10-14soldstatus $65,000
-
2008-10-01historical
-
2008-09-29$69,711
-
2006-11-01soldstatus $54,000
-
2006-07-06$59,900
-
2003-10-18historical
-
2003-04-18$88,900
-
2002-09-04historical
-
2002-06-04$68,900
-
1999-05-26soldstatus $56,000
-
1997-07-21soldstatus $51,500
-
1996-11-25soldstatus $51,500
ⓘ Source: listings_history table (triggers on properties + properties_extension) + one-shot
backfill from property_details.listing_events for pre-trigger history.
Tax reassessment forecast OH · Partial reset (capped growth)
- Current annual tax
- $1,679 · $140/mo
- Projected year-2 tax
- $1,854 · $154/mo
- Expected delta
- +$174/yr (+$15/mo · 10.4%)
ⓘ Screening estimate from a state-policy table — verify with the county assessor before closing.
Climate risk First Street
- Flood 6/10 Major FEMA zone X (unshaded) · 27% chance over 30 yrs
- Wildfire 1/10 Low
- Heat 3/10 Moderate 7 d/yr ≥96°F today · 17 d/yr by 30 yrs out
- Wind 1/10 Low
- Air quality 3/10 Moderate 2 unhealthy d/yr today · 4 by 30 yrs out
Nearby sold comps map
Loading sold comps map…
Walkable amenities ~0.75 mi
Loading nearby amenities…
Taxation est. · year 1
- Rental income
- $23,662
- − Mortgage interest
- −$7,282
- − Property taxes
- −$1,679
- − Insurance
- −$650
- − Repairs & maintenance
- −$1,893
- − Management
- −$1,893
- − HOA
- −$5,412
- − Depreciation
- −$3,782
- Taxable income
- $1,072
- Est. tax owed @ 24.0%
- −$257
- After-tax cash flow
- $2,514/yr
For passive investors: Depreciation is non-cash, so a rental often shows a tax loss while cash-flowing — sheltering income. Rental losses are passive: they offset passive income freely, and up to $25,000/yr can offset ordinary (W-2) income if you actively participate and your MAGI is under $100k (phasing out to $0 by $150k); unused losses carry forward. On sale, claimed depreciation is recaptured at up to 25%, and gains may owe capital-gains tax (a 1031 exchange can defer both). Figures are a year-1 estimate at your 24.0% rate — not tax advice; consult a CPA.
Schools (NCES district)
- District
- Hudson City
- NCES district ID
- 3905002
- Math proficiency
- 84% ▼ -7.00%
- Reading proficiency
- 88% ▼ -1.00%
- Median HH income
- $114,390
- Composite
- 78.78/100
- National rank
- #68
- State rank
- #4 of 656 in OH
Livability — Hudson
- Score
- 88/100
- State rank
- #20
- US rank
- #196
Category grades
Schools grade is shown separately in the Schools card above.
Census & demographics
- Census place
- Hudson, OH
- County
- Summit County · 440,783 people
- City population
- 25,941
- Metro
- Akron, OH
- Population (ZIP)
- 25,941
- Household income
- $168,595
- Rent vs Own
- Severe rent burden
- 276.0
Population outlook (Summit County) Hauer SSP2
- Today (2025)
- 546,583 people
- By 2030
- 544,028 · -0.5%
- By 2040
- 531,363 · -2.8%
- By 2050
- 514,923 · -5.8%
- By 2075
- 481,765 · -11.9%
- By 2100
- 432,265 · -20.9%
Race, ethnicity, and origin ACS 2023
- Neighborhood character
- Predominantly White (88%)
- Race & ethnicity
- White 88% Two or more races 4% Black 4% Asian 3% Hispanic / Latino 2%
- Common ancestry
- Romanian 7% Slovak 3% Lithuanian 3%
- Foreign-born
- 6% · Canada, China, South Korea
- Languages at home
- 93% English-only · Other Indo-European 1% Chinese 1% Spanish 1%
Political lean MEDSL · Summit
- 2024 margin
- Lean D (+7.0) · D 53.0% · R 46.0%
- 2008→2024 swing
- -9.6pp toward R · 2008: 16.6pp · 2024: 7.0pp
- All cycles
- 2024: D+7.0 2020: D+9.6 2016: D+8.2 2012: D+14.8 2008: D+16.6
Not yet ingested
- Civics
- —
Market trends
- HPI YoY
- ▼ -238.26%
- Current HPI
- 218.638
- Rent YoY
- —
- Metro
- Akron, OH
- State GDP YoY
- ▲ 1.98%
- F500 in state
- 48
Industry mix (Fortune 500 HQ in OH)
| Industry | F500 HQs | Revenue |
|---|---|---|
| Insurance | 3 | $145B |
|
||
| Industrial Machinery | 3 | $49B |
|
||
| Financial Services | 3 | $24B |
|
||
| Consumer Goods | 2 | $93B |
|
||
| Aerospace / Defense | 2 | $47B |
|
||
| Utilities | 2 | $33B |
|
||
Price history
+152.4% since first listed18 events — show timeline
- 2026-05-13 Price Changed $129,997 FSBO.com
- 2026-05-12 Listed $134,997 FSBO.com
- 2017-05-01 Sold (Public Records) $64,500 Public Records
- 2013-06-24 Sold (Public Records) $48,500 Public Records
- 2009-03-19 Listing Removed — MLSNOW
- 2008-10-16 Listed $69,711 MLSNOW
- 2008-10-14 Sold (Public Records) $65,000 Public Records
- 2008-10-01 Listing Removed — MLSNOW
- 2008-09-29 Listed $69,711 MLSNOW
- 2006-11-01 Sold (MLS) $54,000 MLSNOW
- 2006-07-06 Listed $59,900 MLSNOW
- 2003-10-18 Listing Removed — MLSNOW
- 2003-04-18 Listed $88,900 MLSNOW
- 2002-09-04 Listing Removed — MLSNOW
- 2002-06-04 Listed $68,900 MLSNOW
- 1999-05-26 Sold (Public Records) $56,000 Public Records
- 1997-07-21 Sold (Public Records) $51,500 Public Records
- 1996-11-25 Sold (Public Records) $51,500 Public Records
Property tax history
+2.5%/yrLatest (2025): $1,679 · -1.7% YoY. Source: county tax records.
Cash-flow waterfall
monthlySold comps — $/sqft
last 12 mo · ≤1 miLoading sold comps…