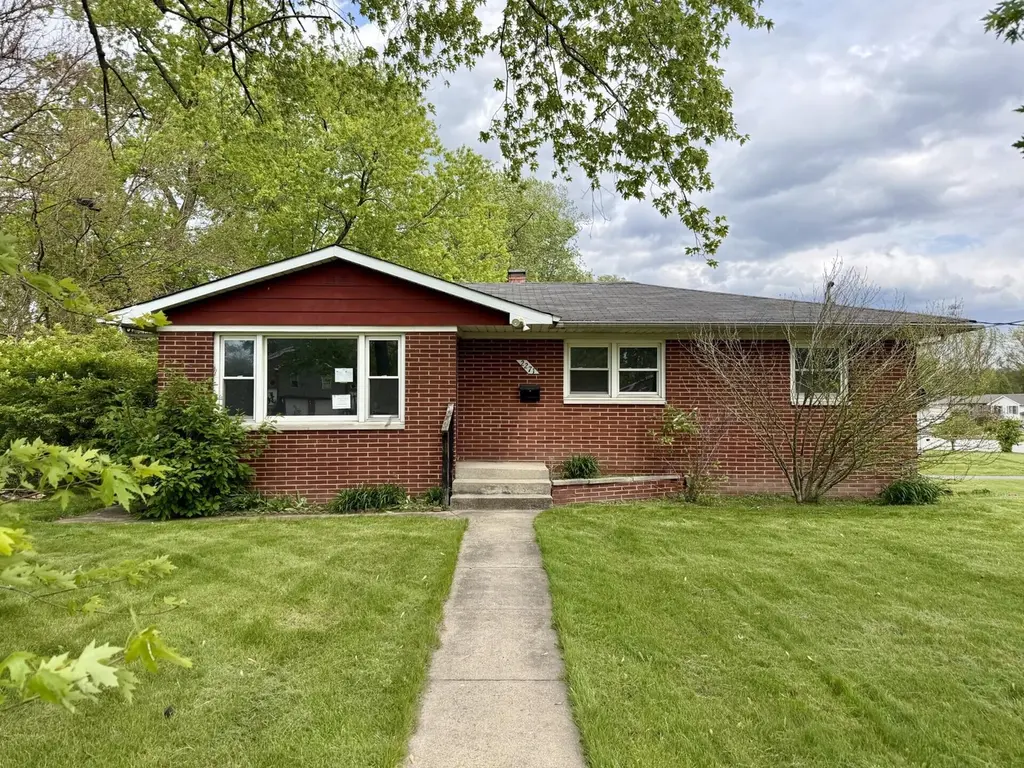
2271 Hamstrom Rd · Portage, IN
Flood risk 3/10 · Minor
- FEMA flood zone
- X (unshaded)
- Chance of flooding over 30 yrs
- 0.2%
- Est. flood insurance / yr
- $473 – $860
Fire risk 1/10 · Minimal
- Est. fire insurance / yr
- $717 – $1,331
Heat risk 2/10 · Minimal
- Hot days now (above 101°F)
- 7 days/yr
- Hot days in 30 yrs
- 15 days/yr
Wind risk 2/10 · Minimal
- Chance of severe wind over 30 yrs
- 0.0%
Air-quality risk 4/10 · Minor
- Unhealthy air days now
- 5 days/yr
- Unhealthy air days in 30 yrs
- 6 days/yr
Risk factors via First Street. Map © Google.
Why this score? — see what drove the C- grade
The composite is a weighted blend of 9 inputs, each scored 0–100. Each bar is that input's sub-score; the figure is the points it added to the 100-point composite (weight × sub-score).
- Cash flow +16.9/30.0
- ARV discount +15.0/15.0
- DSCR +5.3/10.0
- 1% rule +4.1/10.0
- Rent growth +3.6/5.0
- Livability +3.6/5.0
- Schools +2.7/10.0
- Condition / age +2.5/5.0
- Appreciation +0.0/10.0
$198,000
🖨 Deal sheet 📄 Offer letter ✓ Due diligence
Listing remarks MLS
OFFERING $5,000 TOWARDS BUYERS CLOSING COSTS! This charming ALL BRICK ranch home is ready for its new owner! This home sits on a large lot and is conveniently located near the highway making commuting a breeze and also near Founders Square for all the fun activities. This property features hardwood floors, 3 bedrooms, 2.5 bathrooms, and a mostly finished walk-out basement with plenty of entertaining and living space!
Key facts
- Spacious back yard
- Brick home
- Walk-out basement
Tags
Property features AI
Exterior
- Utilities: Public water; Public sewer
- Home design: One level; Built in 1960
- Construction: Brick construction
- Exterior features: Patio; Neighborhood view
Interior
- Kitchen: Microwave; Range
- Bedrooms: Primary bedroom; Bedroom 2; Bedroom 3
- Bathrooms: 2 full bathrooms; 1 half bathroom
- Heating & cooling: Central air conditioning; Natural gas heating
- Interior features: No additional interior features specified; Bonus room; Great room; Living room
- Laundry & utility: Basement with walk-out access
Neighborhood map
What this means for you Summary
Snapshot
- This is a 3-bed/1.5-bath single-family listed at $198k.
Deal economics
- At list price, monthly cash flow is $132 ($2k/yr) — positive.
- The deal already cash-flows at list — no discount required.
- To meet the 1% rule (rent ≥ 1% of price), the offer needs to be $180k (9.0% below list).
- Recommended offer: $180k (9.0% below list) — sets the bar for 1% rule.
- Cap rate 7.1% vs local median 4.0% in Portage — top-decile yield for the area; either an underpriced asset or a hidden risk that comps aren't pricing in. Stress-test before assuming the spread holds.
Location & tenants
- Location reads 72/100 on livability (#111 in IN) — a middle-class / working-renter tenant base. Strengths: cost of living A+, housing A+, health & safety A; Watch: schools D, amenities F, commute F.
- Portage Township Schools (suburban): math 26% / reading 36% proficiency, ranked #221 of 301 in IN (top 73%) — families likely to look elsewhere, expect single-tenant / working-renter base with shorter leases.
- Market conditions: Rents rising fast (+4.3%/yr); 311 active listings in the ZIP; 7 comparable units currently listed for rent nearby; rentals at typical pace (median 25d on market — plan ~3-4 weeks tenant-placement turnaround); solid renter incomes; 542 units permitted in Porter County in 2024 (0 in 5+ unit buildings).
Forward outlook
- Local home prices are declining (-3.0%/yr); year-one equity from $1k of loan paydown is wiped out by about $6k of value loss. Plan a longer hold.
- Porter County population projected at +6% by 2050 — modest demand growth; plan on rents tracking national, not racing it.
Negotiation context
- It's been on market 20 days — a 2% lower offer ($195k) is reasonable based on typical stale-listing flexibility.
- 8 sale attempts since 27y ago with the ask held roughly flat each time — persistent listings suggest the price (not the market) is what's stuck; bring a comps-based counter.
Questions for the listing agent
- Built in 1960 — when were the roof, HVAC, electrical panel, plumbing, and water heater last replaced?
- Is there a deadline driving the sale (1031 exchange, divorce, estate, relocation)? That informs how much negotiation room exists.
- Schools are D-rated, which usually means shorter tenancies and higher turnover. Who's the typical renter profile here, and what's been the actual vacancy rate?
- What's the average days-on-market for RENTAL listings here right now (not sales)? A rising rental-DOM trend means longer vacancies and softer asking-rent achievability than the comps imply.
- What's the recent tenant-quality profile in this submarket — average credit score on applications, eviction rate, late-payment / NSF rate, and stable-employment percentage? A property-management company in the area should have these aggregated.
- How much new for-sale + rental construction is in the pipeline within 1–3 miles? Heavy new supply typically softens prices + rents 12–24 months out; constrained supply supports both.
Investment metrics
- 1% rule
- 0.91% ✗
- Cap rate
- 7.09%
- Cash-on-cash
- 2.86%
- DSCR
- 1.13
- GRM
- 9.2
CMA / ARV
- ARV (on-the-fly)
- $241,569
- Comps found
- 12
Show comp detail 12 sales within ~0.75 mi
| Address | Dist | Beds/Ba | Sqft | Sold | Price | $/sf | Match |
|---|---|---|---|---|---|---|---|
| 2200 Hamstrom Rd | 0.14mi | 3/1.0 | 1,152 (-1%) | 12mo | $258,000 | $224 | 79 |
| 2161 Hamstrom Rd | 0.21mi | 3/2.0 | 1,202 (+3%) | 7mo | $250,000 | $208 | 77 |
| 2334 Venus St | 0.28mi | 3/2.0 | 1,107 (-5%) | 1mo | $229,900 | $208 | 76 |
| 6467 Portage Ave | 0.20mi | 3/1.0 | 1,280 (+10%) | 1mo | $240,000 | $188 | 72 |
| 6362 Monument Ave | 0.29mi | 3/2.0 | 1,245 (+7%) | 3mo | $250,000 | $201 | 71 |
| 6281 Old Porter Rd | 0.56mi | 3/1.0 | 1,176 (+1%) | 8mo | $140,000 | $119 | 64 |
| 2020 Center St | 0.51mi | 3/1.0 | 1,232 (+6%) | 11mo | $228,000 | $185 | 56 |
| 6676 Lakewood Ave | 0.65mi | 3/1.5 | 1,120 (-4%) | 10mo | $190,000 | $170 | 55 |
| 6458 Monument Ave | 0.36mi | 3/2.0 | 1,324 (+14%) | 10mo | $256,000 | $193 | 51 |
| 6603 Lakewood Ave | 0.53mi | 3/1.5 | 1,008 (-14%) | 9mo | $250,111 | $248 | 45 |
| 6665 Lakewood Ave | 0.65mi | 3/1.5 | 1,008 (-14%) | 5mo | $247,000 | $245 | 43 |
| 2591 Hamstrom Rd | 0.65mi | 3/1.0 | 1,012 (-13%) | 9mo | $209,000 | $207 | 38 |
Match score weights: distance 35% · size 25% · config 20% · recency 20%. Top-matched comps best support the ARV.
Projected returns pro-forma
-3.0% appreciation · 4.29% rent growth · sell at horizon
- IRR
- -10.4%
- Equity multiple
- 0.62×
- Total profit
- $-21,315
- Equity at exit
- $29,522
- IRR
- 0.5%
- Equity multiple
- 1.04×
- Total profit
- $2,174
- Equity at exit
- $17,119
Cash invested: $55,440 (down + closing). Projections, not guarantees.
Landlord ↔ Tenant lean methodology
- Overall (STATE)
- 90 Strongly Landlord-Friendly
- State Indiana
- 90 Strongly Landlord-Friendly · R+11
- County
- — inherits STATE
- City
- — inherits STATE
ZIP-level market 46368
- Rents YoY
- 4.3%
- Active inventory
- 311
- Price-to-rent
- 9.2×
Monthly cashflow live
- Estimated rent
- $1,801 high interval (Pro) →
- Mortgage (P&I)
- −$1,038
- Tax from tax record
- −$170 /mo · $2,036/yr
- Insurance
- −$82
- HOA
- −$0
- Vacancy / Maint / Mgmt
- −$378
- Net cashflow
- $132
Break-even live
UW: 25.0% down · 7.5% · 30yr · 1.5% tax · 5.0% vac · 8.0% maint · 8.0% mgmt
Financing live
Cash to close
- Down payment
- $49,500
- Closing costs
- $5,940
- Reserves months
- —
- Total cash needed
- —
Loan-product check · same deal, 3 products live
Conventional
25% down · 7.5% · 30yr
- Down + closing
- —
- Monthly P&I
- —
- Monthly cashflow
- —
- DSCR
- —
- Eligible?
- —
Personal DTI + credit; lowest rate.
DSCR
20% down · 8.5% · 30yr
- Down + closing
- —
- Monthly P&I
- —
- Monthly cashflow
- —
- DSCR
- —
- Eligible?
- —
No personal income docs; deal must DSCR.
Hard money
10% down · 12.0% · 12mo
- Down + closing
- —
- Monthly P&I
- —
- Monthly cashflow
- —
- DSCR
- —
- Eligible?
- —
Short-term bridge; refi at stabilization.
Rent comps 7 comps
| Address | Beds | Baths | Sqft | Rent | $/sqft | DOM | Units | Dist |
|---|---|---|---|---|---|---|---|---|
| 2540 Promenade Way Portage, IN | 2.0 | 2.0 | 1329 | $2,299 | $1.73 | 43d | 1 | 0.59mi |
| 6055 Canden Ave Portage, IN | 1.0–2.0 | 1.0–2.0 | 975 | $1,400 | $1.44 | 1d | 5 | 0.84mi |
| 6021 Canden Ave Portage, IN | 2.0 | 1.0 | 1000 | $1,350 | $1.35 | 24d | 1 | 0.86mi |
| 6021 Canden Ave Portage, IN | 2.0 | 1.0 | 1000 | $1,250 | $1.25 | 12d | 1 | 0.86mi |
| 2299 McCool Rd Portage, IN | 3.0 | 1.5 | 1375 | $1,650 | $1.20 | 1d | 1 | 1.26mi |
| 5750 Blossom Ave Portage, IN | 3.0 | 2.0 | 1232 | $2,500 | $2.03 | 24d | 1 | 1.32mi |
| 6967 Eisenhower Ave Unit 6967 Portage, IN | 3.0 | 2.0 | 1200 | $1,800 | $1.50 | 43d | 1 | 1.41mi |
Listing history 14 events
-
2026-06-18days on market $198,000 Active 20 DOM
-
2026-06-17days on market $198,000 Active 19 DOM
-
2026-06-16days on market $198,000 Active 18 DOM
-
2026-06-15days on market $198,000 Active 17 DOM
-
2026-06-13days on market $198,000 Active 15 DOM
-
2026-06-13days on market $198,000 Active 14 DOM
-
2026-06-09days on market $198,000 Active 11 DOM
-
2026-06-08days on market $198,000 Active 10 DOM
-
2026-06-07days on market $198,000 Active 9 DOM
-
2026-06-04days on market $198,000 Active 6 DOM
-
2026-06-03days on market $198,000 Active 5 DOM
-
2026-06-02days on market $198,000 Active 4 DOM
-
2026-06-01days on market $198,000 Active 3 DOM
-
2026-05-31days on market $198,000 Active 2 DOM
ⓘ Source: listings_history table (triggers on properties + properties_extension) + one-shot
backfill from property_details.listing_events for pre-trigger history.
Tax reassessment forecast IN · Partial reset (capped growth)
- Current annual tax
- $2,036 · $170/mo
- Projected year-2 tax
- $2,036 · $170/mo
- Expected delta
- $0/yr ($0/mo · 0.0%)
ⓘ Screening estimate from a state-policy table — verify with the county assessor before closing.
Climate risk First Street
- Flood 3/10 Moderate FEMA zone X (unshaded) · 20% chance over 30 yrs
- Wildfire 1/10 Low
- Heat 2/10 Low 7 d/yr ≥101°F today · 15 d/yr by 30 yrs out
- Wind 2/10 Low 0% chance of damaging wind over 30 yrs
- Air quality 4/10 Moderate 5 unhealthy d/yr today · 6 by 30 yrs out
Nearby sold comps map
Loading sold comps map…
Walkable amenities ~0.75 mi
Loading nearby amenities…
Taxation est. · year 1
- Rental income
- $21,611
- − Mortgage interest
- −$11,091
- − Property taxes
- −$2,036
- − Insurance
- −$990
- − Repairs & maintenance
- −$1,729
- − Management
- −$1,729
- − Depreciation
- −$5,760
- Taxable loss
- −$1,724
- Est. tax savings @ 24.0%
- +$414
- After-tax cash flow
- $2,001/yr
For passive investors: Depreciation is non-cash, so a rental often shows a tax loss while cash-flowing — sheltering income. Rental losses are passive: they offset passive income freely, and up to $25,000/yr can offset ordinary (W-2) income if you actively participate and your MAGI is under $100k (phasing out to $0 by $150k); unused losses carry forward. On sale, claimed depreciation is recaptured at up to 25%, and gains may owe capital-gains tax (a 1031 exchange can defer both). Figures are a year-1 estimate at your 24.0% rate — not tax advice; consult a CPA.
Schools (NCES district)
- District
- Portage Township Schools
- NCES district ID
- 1809150
- Math proficiency
- 26% ▼ -15.00%
- Reading proficiency
- 36% ▼ -10.00%
- Median HH income
- $53,880
- Composite
- 27.37/100
- National rank
- #6978
- State rank
- #221 of 301 in IN
Livability — Portage
- Score
- 72/100
- State rank
- #111
- US rank
- #5725
Category grades
Schools grade is shown separately in the Schools card above.
Census & demographics
- Census place
- Portage, IN
- County
- Porter County · 151,647 people
- City population
- 40,301
- Metro
- Chicago-Naperville-Elgin, IL-IN-WI
- Population (ZIP)
- 40,301
- Household income
- $76,368
- Rent vs Own
- Severe rent burden
- 856.0
Population outlook (Porter County) Hauer SSP2
- Today (2025)
- 177,804 people
- By 2030
- 181,552 · +2.1%
- By 2040
- 185,830 · +4.5%
- By 2050
- 187,498 · +5.5%
- By 2075
- 189,585 · +6.6%
- By 2100
- 183,722 · +3.3%
Race, ethnicity, and origin ACS 2023
- Neighborhood character
- Predominantly White (67%)
- Race & ethnicity
- White 67% Hispanic / Latino 18% Two or more races 10% Black 10% Asian 1%
- Hispanic origin (detail)
- Mexican 13% Puerto Rican 4%
- Common ancestry
- Romanian 6% Slovak 2% Iranian 1%
- Foreign-born
- 3% · Canada
- Languages at home
- 92% English-only · Spanish 6%
Political lean MEDSL · Porter
- 2024 margin
- R (+10.5) · D 43.8% · R 54.3% · Other 1.8%
- 2008→2024 swing
- -17.7pp toward R · 2008: 7.2pp · 2024: -10.5pp
- All cycles
- 2024: R+10.5 2020: R+6.1 2016: R+6.8 2012: D+3.8 2008: D+7.2
Not yet ingested
- Civics
- —
Market trends
- HPI YoY
- ▼ -195.94%
- Current HPI
- 181.3254
- Rent YoY
- ▲ 4.29%
- Metro
- Chicago-Naperville-Elgin, IL-IN-WI
- State GDP YoY
- ▲ 2.90%
- F500 in state
- 18
Industry mix (Fortune 500 HQ in IN)
| Industry | F500 HQs | Revenue |
|---|---|---|
| Industrial Machinery | 2 | $37B |
|
||
| Healthcare | 1 | $177B |
|
||
| Pharmaceuticals | 1 | $45B |
|
||
| Metals / Steel | 1 | $18B |
|
||
| Agriculture | 1 | $17B |
|
||
| Packaging | 1 | $12B |
|
||
Price history
+98.2% since first listed16 events — show timeline
- 2026-05-29 Listed $198,000 NIRA MLS as Distributed by MLS Grid
- 2023-11-06 Sold (MLS) $205,000 NIRA MLS as Distributed by MLS Grid
- 2023-10-31 Pending — NIRA MLS as Distributed by MLS Grid
- 2023-10-05 Contingent — NIRA MLS as Distributed by MLS Grid
- 2023-09-29 Price Changed $215,000 NIRA MLS as Distributed by MLS Grid
- 2023-09-15 Listed $220,000 NIRA MLS as Distributed by MLS Grid
- 2017-10-13 Sold (MLS) $110,000 NIRA MLS as Distributed by MLS Grid
- 2017-08-18 Listed $118,000 NIRA MLS as Distributed by MLS Grid
- 2013-03-02 Listing Removed — NIRA MLS as Distributed by MLS Grid
- 2012-10-12 Listed $107,800 NIRA MLS as Distributed by MLS Grid
- 2012-02-23 Listing Removed — NIRA MLS as Distributed by MLS Grid
- 2011-03-28 Listed $120,000 NIRA MLS as Distributed by MLS Grid
- 2007-12-31 Listed $104,900 NIRA MLS as Distributed by MLS Grid
- 2007-12-27 Listing Removed — NIRA MLS as Distributed by MLS Grid
- 2007-10-29 Listed $104,900 NIRA MLS as Distributed by MLS Grid
- 1999-07-09 Listed $99,900 NIRA MLS as Distributed by MLS Grid
Property tax history
-4.4%/yrLatest (2024): $2,036 · -0.9% YoY. Source: county tax records.
Cash-flow waterfall
monthlySold comps — $/sqft
last 12 mo · ≤1 miLoading sold comps…