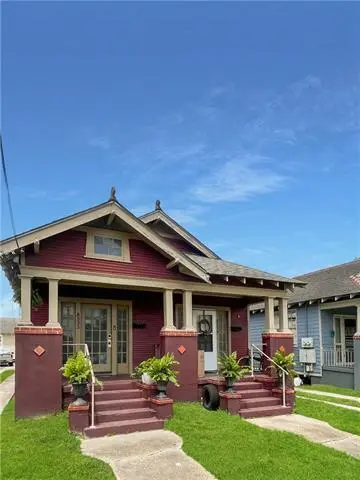
8533-35 Forshey St · New Orleans, LA
Flood risk 8/10 · Major
- FEMA flood zone
- X (shaded)
- Chance of flooding over 30 yrs
- 0.6%
- Est. flood insurance / yr
- $507 – $1,088
Fire risk 1/10 · Minimal
- Est. fire insurance / yr
- $1,269 – $2,357
Heat risk 10/10 · Severe
- Hot days now (above 108°F)
- 7 days/yr
- Hot days in 30 yrs
- 21 days/yr
Wind risk 10/10 · Severe
- Chance of severe wind over 30 yrs
- 99.0%
Air-quality risk 4/10 · Minor
- Unhealthy air days now
- 4 days/yr
- Unhealthy air days in 30 yrs
- 4 days/yr
Risk factors via First Street. Map © Google.
Why this score? — see what drove the C+ grade
The composite is a weighted blend of 9 inputs, each scored 0–100. Each bar is that input's sub-score; the figure is the points it added to the 100-point composite (weight × sub-score).
- Cash flow +20.9/30.0
- ARV discount +15.0/15.0
- DSCR +6.6/10.0
- 1% rule +5.5/10.0
- Livability +4.0/5.0
- Condition / age +4.0/5.0
- Rent growth +2.7/5.0
- Schools +1.6/10.0
- Appreciation +0.0/10.0
$229,000
🖨 Deal sheet (PDF) 📄 Offer letter ✓ Due diligence
Listing remarks MLS
Excellent investment opportunity in a high-demand New Orleans location, just four blocks from South Carrollton Avenue. This thoughtfully renovated duplex blends historic character with modern updates and features two classic shotgun-style units, each offering 2 bedrooms and 1 bathroom, updated kitchen and baths, central HVAC, and off-street parking. The property is fully leased, generating $2,200 in monthly rental income, with tenants responsible for their own utilities--minimizing operating expenses. Convenient access to I-10, public transportation, and nearby shopping enhances long-term rental appeal. Whether you're seeking a dependable income-producing property or looking to expand your portfolio, this duplex is available individually or as part of a seven-property package--all situated on the same square. 48 notice required for showings. Shown to pre-approved buyers.
Key facts
- Updated baths
- Modern updates
- Historic character
Tags
Neighborhood map
What this means for you Summary
Snapshot
- This is a 8-bed/4.0-bath single-family listed at $229k. Condition is rated good.
Deal economics
- At list price, monthly cash flow is $250 ($3k/yr) — positive.
- The deal already cash-flows at list — no discount required.
- Meets the 1% rule at list price ($2k rent vs $229k).
- Recommended offer: $202k (12.0% below list) — sets the bar for market timing.
- Cap rate 8.0% vs local median 4.4% in New Orleans — top-decile yield for the area; either an underpriced asset or a hidden risk that comps aren't pricing in. Stress-test before assuming the spread holds.
Location & tenants
- Location reads 81/100 on livability (#3 in LA, #1,383 nationally) — a professional / high-income tenant draw. Strengths: amenities A+, commute A+, health & safety A+; Watch: crime C-, employment D.
- Orleans Parish (urban): math 11% / reading 27% proficiency, ranked #69 of 98 in LA (top 70%) — low school quality limits family demand, transient renter base, plan for 1-2y turnover; 68% free/reduced lunch — lower-income household profile, screen leases tightly.
- Market conditions: Rents flat; 277 active listings in the ZIP; 710 units permitted in Orleans Parish in 2024 (244 in 5+ unit buildings).
- At $2,404/mo this rent would consume 45% of the median local household income ($64k/yr) (locally 2237% of renters already pay >50% of income on rent) — very limited rent-growth headroom before tenants either downsize or default.
Forward outlook
- Local home prices are declining (-3.0%/yr); year-one equity from $2k of loan paydown is wiped out by about $7k of value loss. Plan a longer hold.
- Orleans County population projected at +61% by 2050 — long-run rental-demand tailwind backs the buy-and-hold thesis.
Negotiation context
- It's been on market 139 days — a 12% lower offer ($202k) is reasonable based on typical stale-listing flexibility.
- 5 sale attempts with the ask held roughly flat each time — persistent listings suggest the price (not the market) is what's stuck; bring a comps-based counter.
Risks & watch-outs
- Watch-outs: flood insurance adds $66/mo.
- Climate carrying-cost: severe flood risk; severe wind risk, 99% chance of damaging wind over 30y; extreme-heat days projected 7→21/yr by 2055 (HVAC capex compounding) — expect insurance premiums to compound above CPI over the hold.
Questions for the listing agent
- It's been on market 139 days. Have you received any prior offers? Is the seller open to a 12% concession, seller financing, or rate buy-down credit?
- What's the actual annual flood-insurance premium (NFIP or private), and is the property in a SFHA with mandatory coverage?
- Why hasn't it sold? Are there any deal-killer items the seller is aware of (foundation, flood, title, zoning, code violations)?
- Is there a deadline driving the sale (1031 exchange, divorce, estate, relocation)? That informs how much negotiation room exists.
- What's the average days-on-market for RENTAL listings here right now (not sales)? A rising rental-DOM trend means longer vacancies and softer asking-rent achievability than the comps imply.
- What's the recent tenant-quality profile in this submarket — average credit score on applications, eviction rate, late-payment / NSF rate, and stable-employment percentage? A property-management company in the area should have these aggregated.
- How much new for-sale + rental construction is in the pipeline within 1–3 miles? Heavy new supply typically softens prices + rents 12–24 months out; constrained supply supports both.
Investment metrics
- 1% rule
- 1.05% ✓
- Cap rate
- 7.95%
- Cash-on-cash
- 5.92%
- DSCR
- 1.26
- GRM
- 7.9
CMA / ARV
- ARV (median comp)
- $297,905
- List price
- $229,000
- Delta
- -23.13%
- Verdict
- UNDERPRICED
- Comps
- 20 within 1.0 mi
Projected returns pro-forma
-3.0% appreciation · 0.97% rent growth · sell at horizon
- IRR
- -11.4%
- Equity multiple
- 0.60×
- Total profit
- $-25,920
- Equity at exit
- $34,145
- IRR
- -5.5%
- Equity multiple
- 0.68×
- Total profit
- $-20,713
- Equity at exit
- $19,800
Cash invested: $64,120 (down + closing). Projections, not guarantees.
Landlord ↔ Tenant lean methodology
- Overall (STATE)
- 90 Strongly Landlord-Friendly
- State Louisiana
- 90 Strongly Landlord-Friendly · R+12
- County
- — inherits STATE
- City
- — inherits STATE
ZIP-level market 70118
- Rents YoY
- 1.0%
- Active inventory
- 277
- Price-to-rent
- 7.9×
Monthly cashflow live
- Estimated rent
- $2,404 medium interval (Pro) →
- Mortgage (P&I)
- −$1,201
- Tax est. 1.5%
- −$286 /mo · $3,435/yr
- Insurance
- −$95
- Flood insurance flood zone
- −$66 /mo · $798/yr
- HOA
- −$0
- Vacancy / Maint / Mgmt
- −$505
- Net cashflow
- $250
Break-even live
Sensitivity live
| Price | -10% $408 | -5% $329 | +0% $250 | +5% $171 | +10% $92 |
|---|---|---|---|---|---|
| Rent | -10% $60 | -5% $155 | +0% $250 | +5% $345 | +10% $440 |
| Rate | -1.0pp $365 | -0.5pp $308 | base $250 | +0.5pp $191 | +1.0pp $130 |
UW: 25.0% down · 7.5% · 30yr · 1.5% tax · 5.0% vac · 8.0% maint · 8.0% mgmt
Financing live
Cash to close
- Down payment
- $57,250
- Closing costs
- $6,870
- Reserves months
- —
- Total cash needed
- —
Loan-product check · same deal, 3 products live
Conventional
25% down · 7.5% · 30yr
- Down + closing
- —
- Monthly P&I
- —
- Monthly cashflow
- —
- DSCR
- —
- Eligible?
- —
Personal DTI + credit; lowest rate.
DSCR
20% down · 8.5% · 30yr
- Down + closing
- —
- Monthly P&I
- —
- Monthly cashflow
- —
- DSCR
- —
- Eligible?
- —
No personal income docs; deal must DSCR.
Hard money
10% down · 12.0% · 12mo
- Down + closing
- —
- Monthly P&I
- —
- Monthly cashflow
- —
- DSCR
- —
- Eligible?
- —
Short-term bridge; refi at stabilization.
Listing history 22 events
-
2026-06-21days on market $229,000 Active 139 DOM
-
2026-06-18days on market $229,000 Active 136 DOM
-
2026-06-17days on market $229,000 Active 135 DOM
-
2026-06-16days on market $229,000 Active 134 DOM
-
2026-06-15days on market $229,000 Active 133 DOM
-
2026-06-13days on market $229,000 Active 131 DOM
-
2026-06-10days on market $229,000 Active 128 DOM
-
2026-06-09days on market $229,000 Active 127 DOM
-
2026-06-08days on market $229,000 Active 126 DOM
-
2026-06-07days on market $229,000 Active 125 DOM
-
2026-06-05days on market $229,000 Active 122 DOM
-
2026-06-03days on market $229,000 Active 121 DOM
-
2026-06-02days on market $229,000 Active 120 DOM
-
2026-06-01days on market $229,000 Active 119 DOM
-
2026-05-31days on market $229,000 Active 118 DOM
-
2026-02-02$229,000 Active 883-char remark
Show marketing remark (883 chars)
Excellent investment opportunity in a high-demand New Orleans location, just four blocks from South Carrollton Avenue. This thoughtfully renovated duplex blends historic character with modern updates and features two classic shotgun-style units, each offering 2 bedrooms and 1 bathroom, updated kitchen and baths, central HVAC, and off-street parking. The property is fully leased, generating $2,200 in monthly rental income, with tenants responsible for their own utilities--minimizing operating expenses. Convenient access to I-10, public transportation, and nearby shopping enhances long-term rental appeal. Whether you're seeking a dependable income-producing property or looking to expand your portfolio, this duplex is available individually or as part of a seven-property package--all situated on the same square. 48 notice required for showings. Shown to pre-approved buyers.
-
2025-06-02$229,000 Active
-
2025-05-01$880,000 Active
-
2025-03-14$229,000 Active
-
2025-01-12historical $1,150
-
2025-01-09$1,150
-
2023-08-06historical
ⓘ Source: listings_history table (triggers on properties + properties_extension) + one-shot
backfill from property_details.listing_events for pre-trigger history.
Climate risk First Street
- Flood 8/10 Severe FEMA zone X (shaded) · 60% chance over 30 yrs
- Wildfire 1/10 Low
- Heat 10/10 Extreme 7 d/yr ≥108°F today · 21 d/yr by 30 yrs out
- Wind 10/10 Extreme 99% chance of damaging wind over 30 yrs
- Air quality 4/10 Moderate 4 unhealthy d/yr today · 4 by 30 yrs out
Nearby sold comps map
Loading sold comps map…
Walkable amenities ~0.75 mi
Loading nearby amenities…
Taxation est. · year 1
- Rental income
- $28,846
- − Mortgage interest
- −$12,828
- − Property taxes
- −$3,435
- − Insurance
- −$1,942
- − Repairs & maintenance
- −$2,308
- − Management
- −$2,308
- − Depreciation
- −$6,662
- Taxable loss
- −$636
- Est. tax savings @ 24.0%
- +$153
- After-tax cash flow
- $3,153/yr
For passive investors: Depreciation is non-cash, so a rental often shows a tax loss while cash-flowing — sheltering income. Rental losses are passive: they offset passive income freely, and up to $25,000/yr can offset ordinary (W-2) income if you actively participate and your MAGI is under $100k (phasing out to $0 by $150k); unused losses carry forward. On sale, claimed depreciation is recaptured at up to 25%, and gains may owe capital-gains tax (a 1031 exchange can defer both). Figures are a year-1 estimate at your 24.0% rate — not tax advice; consult a CPA.
Condition & rehab AI · 8 photos
This thoughtfully renovated duplex in a high-demand location is in good condition with minimal repairs needed. Painting and landscaping improvements can further enhance its value for both resale and rental.
Value-add opportunities
- Both Painting the exterior and interior walls — Fresh paint can enhance the curb appeal and interior aesthetics, making the property more attractive to potential buyers and renters.
- Both Landscaping improvements — Well-maintained landscaping can improve the curb appeal and add value to the property.
Renovation cost estimate screening
Value-add ROI direction
- Both Painting the exterior and interior walls — Fresh paint can enhance the curb appeal and interior aesthetics, making the property more attractive to potential buyers and renters. ↑
- Both Landscaping improvements — Well-maintained landscaping can improve the curb appeal and add value to the property. ↑
ⓘ Cost ranges are severity-bucket heuristics (US national rule-of-thumb). Get contractor quotes + a written scope before underwriting a rehab budget.
Schools (NCES district)
- District
- Orleans Parish
- NCES district ID
- 2201170
- Math proficiency
- 11% ▼ -52.00%
- Reading proficiency
- 27% ▼ -46.00%
- Median HH income
- $37,011
- Composite
- 15.78/100
- National rank
- #9271
- State rank
- #69 of 98 in LA
Livability — New Orleans
- Score
- 81/100
- State rank
- #3
- US rank
- #1383
Category grades
Schools grade is shown separately in the Schools card above.
Census & demographics
- Census place
- New Orleans, LA
- County
- Orleans Parish · 338,817 people
- City population
- 338,817
- Metro
- New Orleans-Metairie, LA
- Population (ZIP)
- 36,072
- Household income
- $63,750
- Rent vs Own
- Severe rent burden
- 2237.0
Population outlook (Orleans County) Hauer SSP2
- Today (2025)
- 513,025 people
- By 2030
- 575,781 · +12.2%
- By 2040
- 700,174 · +36.5%
- By 2050
- 826,541 · +61.1%
- By 2075
- 1,123,374 · +119.0%
- By 2100
- 1,355,609 · +164.2%
Race, ethnicity, and origin ACS 2023
- Neighborhood character
- Diverse neighborhood (Simpson 0.65)
- Race & ethnicity
- White 47% Black 34% Hispanic / Latino 11% Two or more races 11% Asian 4%
- Hispanic origin (detail)
- Mexican 2%
- Common ancestry
- Lithuanian 8% Italian 2% Romanian 2%
- Foreign-born
- 9% · Canada, China
- Languages at home
- 86% English-only · Spanish 7% French/Haitian/Cajun 2% Other Indo-European 2%
Political lean MEDSL · Orleans
- 2024 margin
- Solid D (+67.0) · D 82.2% · R 15.2% · Other 2.7%
- 2008→2024 swing
- +6.7pp toward D · 2008: 60.3pp · 2024: 67.0pp
- All cycles
- 2024: D+67.0 2020: D+68.2 2016: D+66.2 2012: D+62.5 2008: D+60.3
Not yet ingested
- Civics
- —
Market trends
- HPI YoY
- ▼ -210.46%
- Current HPI
- 282.9629
- Rent YoY
- ▲ 0.97%
- Metro
- New Orleans-Metairie, LA
- State GDP YoY
- ▲ 3.29%
- F500 in state
- 10
Industry mix (Fortune 500 HQ in LA)
| Industry | F500 HQs | Revenue |
|---|---|---|
| Telecommunications | 2 | $23B |
|
||
| Utilities | 1 | $12B |
|
||
| Wholesale / Distribution | 1 | $5B |
|
||
| Advertising | 1 | $2B |
|
||
Price history
+19813.0% since first listed7 events — show timeline
- 2026-02-02 Listed $229,000 AcadianaMLS
- 2025-06-02 Listed $229,000 AcadianaMLS
- 2025-05-01 Listed $880,000 AcadianaMLS
- 2025-03-14 Listed $229,000 AcadianaMLS
- 2025-01-12 Rental Removed $1,150 BUILDIUM
- 2025-01-09 Listed for Rent $1,150 BUILDIUM
- 2023-08-06 Rental Removed — BUILDIUM
Cash-flow waterfall
monthlySold comps — $/sqft
last 12 mo · ≤1 miLoading sold comps…