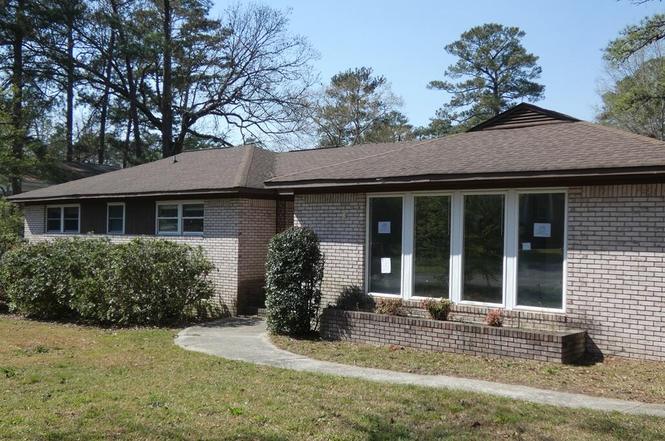
7711 Castleton Ln · Woodfield, SC
Flood risk 1/10 · Minimal
- FEMA flood zone
- X (unshaded)
- Chance of flooding over 30 yrs
- 0.0%
- Est. flood insurance / yr
- $507 – $1,088
Fire risk 3/10 · Minor
- Est. fire insurance / yr
- $783 – $1,453
Heat risk 7/10 · Major
- Hot days now (above 108°F)
- 7 days/yr
- Hot days in 30 yrs
- 16 days/yr
Wind risk 6/10 · Moderate
- Chance of severe wind over 30 yrs
- 70.0%
Air-quality risk 3/10 · Minor
- Unhealthy air days now
- 3 days/yr
- Unhealthy air days in 30 yrs
- 3 days/yr
Risk factors via First Street. Map © Google.
Why this score? — see what drove the F grade
The composite is a weighted blend of 9 inputs, each scored 0–100. Each bar is that input's sub-score; the figure is the points it added to the 100-point composite (weight × sub-score).
- ARV discount +7.5/15.0
- Cash flow +6.7/30.0
- 1% rule +4.2/10.0
- Schools +3.6/10.0
- Livability +3.2/5.0
- Rent growth +2.6/5.0
- Condition / age +2.5/5.0
- DSCR +1.0/10.0
- Appreciation +0.0/10.0
$212,500
🖨 Deal sheet (PDF) 📄 Offer letter ✓ Due diligence
Listing remarks
This Charming 4 Bedroom, 2 Bath Brick Ranch In The Desirable Windsor Lake Park Subdivision Offers 2,129 Square Feet Of Comfortable Living Space And The Perfect Blend Of Modern Convenience And Classic Charm. Located In An Established Neighborhood Known For Its Friendly Neighbors And Mature Surroundings, This Home Is Full Of Potential. Inside, You Will Find A Formal Foyer That Welcomes You Into A Spacious Family Room Featuring A Cozy Fireplace, Custom Built-In Desk And Bookshelves Along With French Doors That Add Character And Natural Light. The Primary Suite Offers Double Sinks And Ample Space For Everyday Comfort. Step Outside to A Fenced Backyard, Ideal for Children, Pets, Gardening, Or En
Key facts
- Formal foyer
- Custom built-in desk
- Cozy fireplace
Tags
Property features AI
Exterior
- Parking: Attached carport; 2 carport spaces
- Utilities: Public water; Public sewer; Electricity available; Cable available
- Home design: Single-family house; One story; Entry level features not specified; Facing direction not specified
- Construction: Brick construction; Shingle roof; Crawl space foundation; Built as a house (year built not provided)
- Exterior features: Deck; Wood fencing; Paved road access; Publicly maintained road
Interior
- Kitchen: Cooktop; Dishwasher; Exhaust fan; Oven
- Flooring: Carpet; Slate; Vinyl
- Bathrooms: 2 full bathrooms
- Heating & cooling: Heat pump heating; Heat pump cooling
- Interior features: Eat-in kitchen; Entrance foyer; Fireplace (other type)
Neighborhood map
What this means for you Summary
Snapshot
- This is a 4-bed/2.0-bath single-family listed at $212k.
Deal economics
- At list price, monthly cash flow is $-337 ($-4k/yr) — negative.
- To cash-flow at today's rent, offer at most $163k (23.2% below list).
- To meet the 1% rule (rent ≥ 1% of price), the offer needs to be $196k (7.9% below list).
- Recommended offer: $163k (23.2% below list) — sets the bar for cash-flow.
Location & tenants
- Location reads 63/100 on livability (#165 in SC) — a middle-class / working-renter tenant base. Strengths: cost of living A+, housing A+; Watch: employment D+, crime D-, amenities F.
- Richland 02 (suburban): math 35% / reading 47% proficiency, ranked #29 of 80 in SC (top 36%) — families likely to look elsewhere, expect single-tenant / working-renter base with shorter leases.
- Zoned schools: L. W. Conder Elementary (math 18% / reading 19%, grade F, #506 of 597 statewide, top 85%, 462 students, 100% FRL); Dent Middle (math 25% / reading 42%, grade F, #113 of 229 statewide, top 50%, 1,018 students, 100% FRL); Richland Northeast High (math 42% / reading 82%, grade B-, #99 of 196 statewide, top 53%, 1,359 students, 70% FRL) — zoned schools average 90% FRL vs 38% district-wide (52 pts higher); higher-poverty schools than district average — tighter screening recommended.
- Market conditions: Rents flat; 341 active listings in the ZIP; 7 comparable units currently listed for rent nearby; rentals at typical pace (median 25d on market — plan ~3-4 weeks tenant-placement turnaround); 3,472 units permitted in Richland County in 2024 (1,096 in 5+ unit buildings).
- This rent runs 38% of the median local income ($62k/yr) — at the standard rent-burdened threshold; future hikes will face affordability resistance.
Forward outlook
- Local home prices are declining (-3.0%/yr); year-one equity from $1k of loan paydown is wiped out by about $6k of value loss. Plan a longer hold.
- Richland County population projected at +30% by 2050 — long-run rental-demand tailwind backs the buy-and-hold thesis.
Negotiation context
- Only 4 days on market — expect competitive offers; lowballing is unlikely to land.
- 3 sale attempts since 3y ago with the ask held roughly flat each time — persistent listings suggest the price (not the market) is what's stuck; bring a comps-based counter.
Risks & watch-outs
- Watch-outs: property tax is 3.8% of price.
- Climate carrying-cost: major wind risk, 70% chance of damaging wind over 30y; extreme-heat days projected 7→16/yr by 2055 (HVAC capex compounding) — expect insurance premiums to compound above CPI over the hold.
Questions for the listing agent
- What do current leases actually rent for vs. the listed asking? Can we see a recent rent roll and the last 12 months of T-12 income?
- Built in 1968 — when were the roof, HVAC, electrical panel, plumbing, and water heater last replaced?
- Property tax is high relative to price — has the assessment been appealed recently, and will the sale trigger a re-assessment?
- Is there a deadline driving the sale (1031 exchange, divorce, estate, relocation)? That informs how much negotiation room exists.
- Schools are D-rated, which usually means shorter tenancies and higher turnover. Who's the typical renter profile here, and what's been the actual vacancy rate?
- Crime grade is D in this area — have there been break-ins, vandalism, or insurance claims at this property in the last 3 years? What carrier currently insures it and at what premium?
- The area grade is low — what's the realistic commute time and amenity access for the typical tenant pool here? Any planned neighborhood developments (good or bad) we should know about?
- What's the average days-on-market for RENTAL listings here right now (not sales)? A rising rental-DOM trend means longer vacancies and softer asking-rent achievability than the comps imply.
- What's the recent tenant-quality profile in this submarket — average credit score on applications, eviction rate, late-payment / NSF rate, and stable-employment percentage? A property-management company in the area should have these aggregated.
- How much new for-sale + rental construction is in the pipeline within 1–3 miles? Heavy new supply typically softens prices + rents 12–24 months out; constrained supply supports both.
Investment metrics
- 1% rule
- 0.92% ✗
- Cap rate
- 4.39%
- Cash-on-cash
- -6.80%
- DSCR
- 0.70
- GRM
- 9.0
CMA / ARV
No comps found within radius.
Projected returns pro-forma
-3.0% appreciation · 0.21% rent growth · sell at horizon
- IRR
- -32.2%
- Equity multiple
- -0.02×
- Total profit
- $-60,962
- Equity at exit
- $31,684
- IRR
- -65.3%
- Equity multiple
- -0.69×
- Total profit
- $-100,314
- Equity at exit
- $18,373
Cash invested: $59,500 (down + closing). Projections, not guarantees.
Landlord ↔ Tenant lean methodology
- Overall (STATE)
- 90 Strongly Landlord-Friendly
- State South Carolina
- 90 Strongly Landlord-Friendly · R+6
- County
- — inherits STATE
- City
- — inherits STATE
ZIP-level market 29223
- Rents YoY
- 0.2%
- Active inventory
- 341
- Price-to-rent
- 9.0×
Monthly cashflow live
- Estimated rent
- $1,957 high interval (Pro) →
- Mortgage (P&I)
- −$1,114
- Tax from tax record
- −$680 /mo · $8,163/yr
- Insurance
- −$89
- HOA
- −$0
- Vacancy / Maint / Mgmt
- −$411
- Net cashflow
- $-337
Break-even live
Sensitivity live
| Price | -10% $-217 | -5% $-277 | +0% $-337 | +5% $-397 | +10% $-457 |
|---|---|---|---|---|---|
| Rent | -10% $-492 | -5% $-414 | +0% $-337 | +5% $-260 | +10% $-182 |
| Rate | -1.0pp $-230 | -0.5pp $-283 | base $-337 | +0.5pp $-392 | +1.0pp $-448 |
UW: 25.0% down · 7.5% · 30yr · 1.5% tax · 5.0% vac · 8.0% maint · 8.0% mgmt
Financing live
Cash to close
- Down payment
- $53,125
- Closing costs
- $6,375
- Reserves months
- —
- Total cash needed
- —
Loan-product check · same deal, 3 products live
Conventional
25% down · 7.5% · 30yr
- Down + closing
- —
- Monthly P&I
- —
- Monthly cashflow
- —
- DSCR
- —
- Eligible?
- —
Personal DTI + credit; lowest rate.
DSCR
20% down · 8.5% · 30yr
- Down + closing
- —
- Monthly P&I
- —
- Monthly cashflow
- —
- DSCR
- —
- Eligible?
- —
No personal income docs; deal must DSCR.
Hard money
10% down · 12.0% · 12mo
- Down + closing
- —
- Monthly P&I
- —
- Monthly cashflow
- —
- DSCR
- —
- Eligible?
- —
Short-term bridge; refi at stabilization.
Rent comps 7 comps
| Address | Beds | Baths | Sqft | Rent | $/sqft | DOM | Units | Dist |
|---|---|---|---|---|---|---|---|---|
| 300 Meredith Sq Columbia, SC | 2.0–3.0 | 2.0–2.5 | 1258 | $1,499 | $1.19 | 25d | 1 | 0.50mi |
| 6905 Cleaton Rd Columbia, SC | 3.0 | 2.5–3.0 | 1546 | $1,925 | $1.25 | 25d | 3 | 0.98mi |
| 117 Greenfield Rd Columbia, SC | 3.0 | 2.0 | 2055 | $1,981 | $0.96 | 25d | 1 | 0.99mi |
| 1725 Cheltenham Ln Columbia, SC | 3.0 | 2.0 | 1444 | $1,675 | $1.16 | 25d | 1 | 1.20mi |
| 6837 N Trenholm Rd Columbia, SC | 1.0–3.0 | 1.0–2.0 | 1105 | $1,985 | $1.80 | 5d | 30 | 1.21mi |
| 1741 Springfield Ave Columbia, SC | 3.0 | 1.0 | 1582 | $930 | $0.59 | 13d | 1 | 1.28mi |
| 1659 Legrand Rd Columbia, SC | 2.0–3.0 | 2.0–2.5 | 1450 | $2,500 | $1.72 | 5d | 12 | 1.40mi |
Listing history 3 events
-
2026-06-22days on market $212,500 Active 4 DOM
-
2026-06-18remarks 699-char remark
-
2026-06-18$212,500 Active 1 DOM
ⓘ Source: listings_history table (triggers on properties + properties_extension) + one-shot
backfill from property_details.listing_events for pre-trigger history.
Tax reassessment forecast SC · Resets to sale price
- Current annual tax
- $8,163 · $680/mo
- Projected year-2 tax
- $8,163 · $680/mo
- Expected delta
- $0/yr ($0/mo · -0.0%)
ⓘ Screening estimate from a state-policy table — verify with the county assessor before closing.
Climate risk First Street
- Flood 1/10 Low FEMA zone X (unshaded) · 0% chance over 30 yrs
- Wildfire 3/10 Moderate
- Heat 7/10 Severe 7 d/yr ≥108°F today · 16 d/yr by 30 yrs out
- Wind 6/10 Major 70% chance of damaging wind over 30 yrs
- Air quality 3/10 Moderate 3 unhealthy d/yr today · 3 by 30 yrs out
Nearby sold comps map
Loading sold comps map…
Walkable amenities ~0.75 mi
Loading nearby amenities…
Taxation est. · year 1
- Rental income
- $23,485
- − Mortgage interest
- −$11,903
- − Property taxes
- −$8,163
- − Insurance
- −$1,062
- − Repairs & maintenance
- −$1,879
- − Management
- −$1,879
- − Depreciation
- −$6,182
- Taxable loss
- −$7,583
- Est. tax savings @ 24.0%
- +$1,820
- After-tax cash flow
- $-2,225/yr
For passive investors: Depreciation is non-cash, so a rental often shows a tax loss while cash-flowing — sheltering income. Rental losses are passive: they offset passive income freely, and up to $25,000/yr can offset ordinary (W-2) income if you actively participate and your MAGI is under $100k (phasing out to $0 by $150k); unused losses carry forward. On sale, claimed depreciation is recaptured at up to 25%, and gains may owe capital-gains tax (a 1031 exchange can defer both). Figures are a year-1 estimate at your 24.0% rate — not tax advice; consult a CPA.
Schools (NCES district)
- District
- Richland 02
- NCES district ID
- 4503390
- Math proficiency
- 35% ▼ -15.00%
- Reading proficiency
- 47% ▼ -5.00%
- Median HH income
- $59,684
- Composite
- 36.2/100
- National rank
- #4730
- State rank
- #29 of 80 in SC
Livability — Woodfield
- Score
- 63/100
- State rank
- #165
- US rank
- #15019
Category grades
Schools grade is shown separately in the Schools card above.
Census & demographics
- Census place
- Woodfield, SC
- County
- Richland County · 389,530 people
- Metro
- Columbia, SC
- Population (ZIP)
- 53,074
- Household income
- $62,408
- Rent vs Own
- Severe rent burden
- 2857.0
Population outlook (Richland County) Hauer SSP2
- Today (2025)
- 459,667 people
- By 2030
- 487,524 · +6.1%
- By 2040
- 542,035 · +17.9%
- By 2050
- 595,371 · +29.5%
- By 2075
- 732,998 · +59.5%
- By 2100
- 820,415 · +78.5%
Race, ethnicity, and origin ACS 2023
- Neighborhood character
- Diverse neighborhood (Simpson 0.60)
- Race & ethnicity
- Black 57% White 23% Hispanic / Latino 11% Two or more races 6% Asian 4%
- Hispanic origin (detail)
- Mexican 5% Puerto Rican 2%
- Common ancestry
- Slovak 1% Serbian 1% Italian 1%
- Foreign-born
- 10% · Canada, South Korea
- Languages at home
- 86% English-only · Spanish 8% Other Indo-European 2% Korean 1%
Political lean MEDSL · Richland
- 2024 margin
- Solid D (+34.6) · D 66.4% · R 31.8% · Other 1.8%
- 2008→2024 swing
- +5.7pp toward D · 2008: 28.9pp · 2024: 34.6pp
- All cycles
- 2024: D+34.6 2020: D+38.3 2016: D+32.9 2012: D+33.3 2008: D+28.9
Not yet ingested
- Civics
- —
Market trends
- HPI YoY
- ▼ -135.96%
- Current HPI
- 195.3158
- Rent YoY
- ▲ 0.21%
- Metro
- Columbia, SC
- State GDP YoY
- ▲ 4.51%
- F500 in state
- 2
Industry mix (Fortune 500 HQ in SC)
| Industry | F500 HQs | Revenue |
|---|---|---|
| Packaging | 1 | $7B |
|
||
Price history
+113.6% since first listed9 events — show timeline
- 2026-06-17 Listed $212,500 SBOR
- 2023-07-07 Sold (Public Records) $240,000 Public Records
- 2023-06-08 Pending — Consolidated MLS
- 2023-05-24 Contingent — Consolidated MLS
- 2023-05-19 Listed $225,000 Consolidated MLS
- 2023-03-17 Sold (Public Records) $179,800 Public Records
- 2023-02-09 Listed $225,000 Consolidated MLS
- 2007-01-02 Sold (Public Records) $150,000 Public Records
- 1998-08-03 Sold (Public Records) $99,500 Public Records
Property tax history
+17.0%/yrLatest (2025): $8,163 · +2.2% YoY. Source: county tax records.
Cash-flow waterfall
monthlySold comps — $/sqft
last 12 mo · ≤1 miLoading sold comps…