460 Eastwood · Lexington-Fayette, KY
Flood risk 1/10 · Minimal
- FEMA flood zone
- X (unshaded)
- Chance of flooding over 30 yrs
- 0.0%
- Est. flood insurance / yr
- $507 – $1,088
Fire risk 4/10 · Minor
- Est. fire insurance / yr
- $839 – $1,559
Heat risk 4/10 · Minor
- Hot days now (above 102°F)
- 7 days/yr
- Hot days in 30 yrs
- 19 days/yr
Wind risk 3/10 · Minor
- Chance of severe wind over 30 yrs
- 5.0%
Air-quality risk 1/10 · Minimal
- Unhealthy air days now
- 0 days/yr
- Unhealthy air days in 30 yrs
- 0 days/yr
Risk factors via First Street. Map © Google.
Why this score? — see what drove the B grade
The composite is a weighted blend of 9 inputs, each scored 0–100. Each bar is that input's sub-score; the figure is the points it added to the 100-point composite (weight × sub-score).
- Cash flow +30.0/30.0
- 1% rule +10.0/10.0
- DSCR +10.0/10.0
- ARV discount +7.5/15.0
- Condition / age +4.0/5.0
- Schools +3.3/10.0
- Rent growth +3.2/5.0
- Livability +2.5/5.0
- Appreciation +0.0/10.0
$70,995
🖨 Deal sheet 📄 Offer letter ✓ Due diligence
Listing remarks
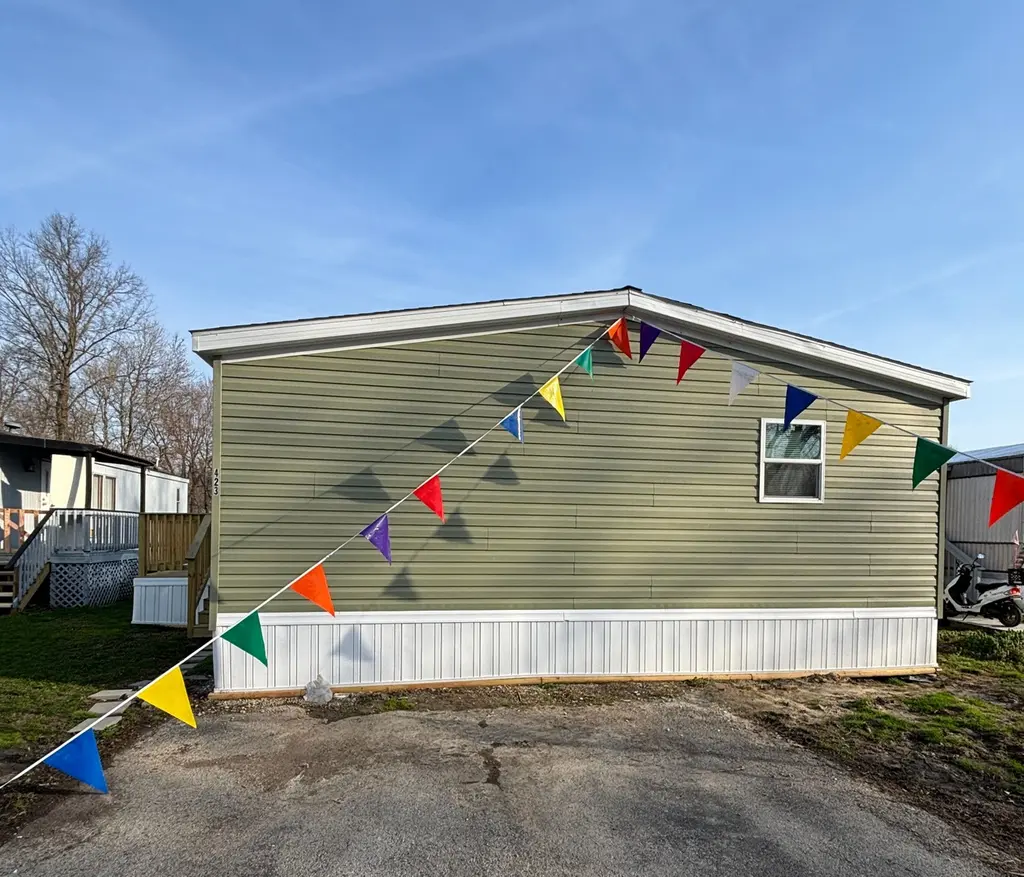
2026 Champion Prime Vertex - 3 Bed, 2 Bath - $70,995 Built for modern, low maintenance living, this brand new single width Vertex model features a well balanced 16x66' layout with an open living space, contemporary kitchen, and three comfortable bedrooms. The bright interior, clean finishes, and efficient design make this home both practical and inviting from day one. Great location and peaceful community with very nice amenities. Contact us today! Financing assistance available! Less than 10% down payment!!
Key facts
- Built 2026
- Listed 42 days
Property features AI
Finance
- Other: Address: 460 Eastwood, Richmond, KY 40475; Listing status: Active
- Financial info: List price $70,995
- HOA & community: Monthly association fee of $467
Exterior
- Home design: Single-family property (spec home)
- Construction: Built as Vertex (Adams Pointe) plan
- Exterior features: Living area approximately 1,056
Interior
- Bedrooms: 3 bedrooms
- Bathrooms: 2 full bathrooms
- Interior features: Spec home (Vertex plan from Adams Pointe)
Neighborhood map
What this means for you Summary
Snapshot
- This is a 3-bed/2.0-bath manufactured listed at $71k. Condition is rated good.
Deal economics
- At list price, monthly cash flow is $280 ($3k/yr) — positive.
- The deal already cash-flows at list — no discount required.
- Meets the 1% rule at list price ($2k rent vs $71k).
- Recommended offer: $69k (3.0% below list) — sets the bar for market timing.
- Cap rate 11.0% vs local median 3.8% in Lexington-Fayette — top-decile yield for the area; either an underpriced asset or a hidden risk that comps aren't pricing in. Stress-test before assuming the spread holds.
Location & tenants
- Location reads: area grade B — affects rentability + tenant quality, not the cash-flow math above.
- Madison County (town): math 31% / reading 47% proficiency, ranked #35 of 165 in KY (top 21%) — families likely to look elsewhere, expect single-tenant / working-renter base with shorter leases.
- Market conditions: Rents rising (+2.8%/yr); 487 active listings in the ZIP; 1 comparable units currently listed for rent nearby; 453 units permitted in Madison County in 2024 (64 in 5+ unit buildings).
Forward outlook
- Local home prices are declining (-3.0%/yr); year-one equity from $491 of loan paydown is wiped out by about $2k of value loss. Plan a longer hold.
- Madison County population projected at +28% by 2050 — long-run rental-demand tailwind backs the buy-and-hold thesis.
- At projected returns (-3.0% appreciation + 2.8% rent growth), your $20k cash investment doubles in ~8 years — after that, you're playing with house money.
Negotiation context
- It's been on market 42 days — a 3% lower offer ($69k) is reasonable based on typical stale-listing flexibility.
Risks & watch-outs
- Watch-outs: HOA is 30% of rent.
Questions for the listing agent
- It's been on market 42 days. Have you received any prior offers? Is the seller open to a 3% concession, seller financing, or rate buy-down credit?
- What does the HOA fee cover, when was the last increase, and are there any pending special assessments or reserve-fund shortfalls?
- Is there a deadline driving the sale (1031 exchange, divorce, estate, relocation)? That informs how much negotiation room exists.
- What's the average days-on-market for RENTAL listings here right now (not sales)? A rising rental-DOM trend means longer vacancies and softer asking-rent achievability than the comps imply.
- What's the recent tenant-quality profile in this submarket — average credit score on applications, eviction rate, late-payment / NSF rate, and stable-employment percentage? A property-management company in the area should have these aggregated.
- How much new for-sale + rental construction is in the pipeline within 1–3 miles? Heavy new supply typically softens prices + rents 12–24 months out; constrained supply supports both.
Investment metrics
- 1% rule
- 2.21% ✓
- Cap rate
- 11.03%
- Cash-on-cash
- 16.92%
- DSCR
- 1.75
- GRM
- 3.8
CMA / ARV
No comps found within radius.
Projected returns pro-forma
-3.0% appreciation · 2.82% rent growth · sell at horizon
- IRR
- 8.2%
- Equity multiple
- 1.32×
- Total profit
- $6,376
- Equity at exit
- $10,586
- IRR
- 17.4%
- Equity multiple
- 2.44×
- Total profit
- $28,644
- Equity at exit
- $6,138
Cash invested: $19,879 (down + closing). Projections, not guarantees.
Landlord ↔ Tenant lean methodology
- Overall (STATE)
- 83 Strongly Landlord-Friendly
- State Kentucky
- 83 Strongly Landlord-Friendly · R+16
- County
- — inherits STATE
- City
- — inherits STATE
ZIP-level market 40475
- Home prices YoY
- -22.7%
- Rents YoY
- 2.8%
- Active inventory
- 487
- Price-to-rent
- 3.8×
Monthly cashflow live
- Estimated rent
- $1,567 medium interval (Pro) →
- Mortgage (P&I)
- −$372
- Tax est. 1.5%
- −$89 /mo · $1,065/yr
- Insurance
- −$30
- HOA
- −$467
- Vacancy / Maint / Mgmt
- −$329
- Net cashflow
- $280
Break-even live
UW: 25.0% down · 7.5% · 30yr · 1.5% tax · 5.0% vac · 8.0% maint · 8.0% mgmt
Financing live
Cash to close
- Down payment
- $17,749
- Closing costs
- $2,130
- Reserves months
- —
- Total cash needed
- —
Loan-product check · same deal, 3 products live
Conventional
25% down · 7.5% · 30yr
- Down + closing
- —
- Monthly P&I
- —
- Monthly cashflow
- —
- DSCR
- —
- Eligible?
- —
Personal DTI + credit; lowest rate.
DSCR
20% down · 8.5% · 30yr
- Down + closing
- —
- Monthly P&I
- —
- Monthly cashflow
- —
- DSCR
- —
- Eligible?
- —
No personal income docs; deal must DSCR.
Hard money
10% down · 12.0% · 12mo
- Down + closing
- —
- Monthly P&I
- —
- Monthly cashflow
- —
- DSCR
- —
- Eligible?
- —
Short-term bridge; refi at stabilization.
Rent comps 1 comps
| Address | Beds | Baths | Sqft | Rent | $/sqft | DOM | Units | Dist |
|---|---|---|---|---|---|---|---|---|
| 100 Foxborough Way Richmond, KY | 1.0–3.0 | 1.0–2.0 | 1200 | $2,100 | $1.75 | 14d | 1 | 0.48mi |
HOA detail
- Monthly dues
- $467 · $5,604/yr
Listing history 16 events
-
2026-06-18days on market $70,995 Active 42 DOM
-
2026-06-17days on market $70,995 Active 41 DOM
-
2026-06-16days on market $70,995 Active 40 DOM
-
2026-06-15days on market $70,995 Active 39 DOM
-
2026-06-14days on market $70,995 Active 37 DOM
-
2026-06-10days on market $70,995 Active 34 DOM
-
2026-06-09days on market $70,995 Active 33 DOM
-
2026-06-08days on market $70,995 Active 32 DOM
-
2026-06-07days on market $70,995 Active 31 DOM
-
2026-06-05days on market $70,995 Active 28 DOM
-
2026-06-03days on market $70,995 Active 27 DOM
-
2026-06-02days on market $70,995 Active 26 DOM
-
2026-06-01days on market $70,995 Active 25 DOM
-
2026-05-31days on market $70,995 Active 24 DOM
-
2026-05-31days on market $70,995 Active 23 DOM
-
2026-05-08$70,995 Active 515-char remark
ⓘ Source: listings_history table (triggers on properties + properties_extension) + one-shot
backfill from property_details.listing_events for pre-trigger history.
Climate risk First Street
- Flood 1/10 Low FEMA zone X (unshaded) · 0% chance over 30 yrs
- Wildfire 4/10 Moderate
- Heat 4/10 Moderate 7 d/yr ≥102°F today · 19 d/yr by 30 yrs out
- Wind 3/10 Moderate 5% chance of damaging wind over 30 yrs
- Air quality 1/10 Low 0 unhealthy d/yr today · 0 by 30 yrs out
Nearby sold comps map
Loading sold comps map…
Walkable amenities ~0.75 mi
Loading nearby amenities…
Taxation est. · year 1
- Rental income
- $18,804
- − Mortgage interest
- −$3,977
- − Property taxes
- −$1,065
- − Insurance
- −$355
- − Repairs & maintenance
- −$1,504
- − Management
- −$1,504
- − HOA
- −$5,604
- − Depreciation
- −$2,065
- Taxable income
- $2,729
- Est. tax owed @ 24.0%
- −$655
- After-tax cash flow
- $2,709/yr
For passive investors: Depreciation is non-cash, so a rental often shows a tax loss while cash-flowing — sheltering income. Rental losses are passive: they offset passive income freely, and up to $25,000/yr can offset ordinary (W-2) income if you actively participate and your MAGI is under $100k (phasing out to $0 by $150k); unused losses carry forward. On sale, claimed depreciation is recaptured at up to 25%, and gains may owe capital-gains tax (a 1031 exchange can defer both). Figures are a year-1 estimate at your 24.0% rate — not tax advice; consult a CPA.
Condition & rehab AI · 12 photos
This modern single-width mobile home is in excellent condition with a good layout and neutral color scheme. It is move-in ready and would benefit from some exterior and interior painting, landscaping, and smart home features to further increase its value.
Value-add opportunities
- Both Painting the exterior and interior walls — Fresh paint can enhance curb appeal and interior aesthetics
- Both Landscaping improvements — A well-maintained yard can increase both resale and rental value
- Both Adding smart home features — Smart home features can increase both resale and rental value by making the home more modern and convenient
Renovation cost estimate screening
Value-add ROI direction
- Both Painting the exterior and interior walls — Fresh paint can enhance curb appeal and interior aesthetics ↑
- Both Landscaping improvements — A well-maintained yard can increase both resale and rental value ↑
- Both Adding smart home features — Smart home features can increase both resale and rental value by making the home more modern and convenient ↑
ⓘ Cost ranges are severity-bucket heuristics (US national rule-of-thumb). Get contractor quotes + a written scope before underwriting a rehab budget.
Schools (NCES district)
- District
- Madison County
- NCES district ID
- 2103720
- Math proficiency
- 31% ▼ -16.00%
- Reading proficiency
- 47% ▼ -14.00%
- Median HH income
- $43,590
- Composite
- 32.99/100
- National rank
- #5580
- State rank
- #35 of 165 in KY
Livability — Lexington-Fayette
No livability data for this city. (Only ~50 U.S. cities are tracked.)
Census & demographics
- County
- Madison County · 93,568 people
- City population
- 321,882
- Metro
- Richmond-Berea, KY
- Population (ZIP)
- 65,961
- Household income
- $63,050
- Rent vs Own
- Severe rent burden
- 2031.0
Population outlook (Madison County) Hauer SSP2
- Today (2025)
- 99,241 people
- By 2030
- 104,927 · +5.7%
- By 2040
- 116,079 · +17.0%
- By 2050
- 127,293 · +28.3%
- By 2075
- 155,644 · +56.8%
- By 2100
- 176,488 · +77.8%
Race, ethnicity, and origin ACS 2023
- Neighborhood character
- Predominantly White (87%)
- Race & ethnicity
- White 87% Two or more races 5% Black 4% Hispanic / Latino 3%
- Common ancestry
- Slovak 2% Italian 2% Serbian 1%
- Foreign-born
- 3% · Canada
- Languages at home
- 96% English-only · Spanish 3%
Political lean MEDSL · Madison
- 2024 margin
- Solid R (+30.9) · D 33.6% · R 64.5% · Other 1.9%
- 2008→2024 swing
- -8.4pp toward R · 2008: -22.4pp · 2024: -30.9pp
- All cycles
- 2024: R+30.9 2020: R+26.8 2016: R+31.2 2012: R+28.9 2008: R+22.4
Not yet ingested
- Civics
- —
Market trends
- HPI YoY
- ▼ -72.04%
- Current HPI
- 245.8489
- Rent YoY
- ▲ 2.82%
- Metro
- Richmond-Berea, KY
- State GDP YoY
- ▲ 1.81%
- F500 in state
- 4
Industry mix (Fortune 500 HQ in KY)
| Industry | F500 HQs | Revenue |
|---|---|---|
| Healthcare | 1 | $118B |
|
||
| Food / Beverage | 1 | $7B |
|
||
Cash-flow waterfall
monthlySold comps — $/sqft
last 12 mo · ≤1 miLoading sold comps…