2546 NW 52nd St · Boca Raton, FL
Flood risk 1/10 · Minimal
- FEMA flood zone
- X (unshaded)
- Chance of flooding over 30 yrs
- 0.0%
- Est. flood insurance / yr
- $507 – $1,088
Fire risk 1/10 · Minimal
- Est. fire insurance / yr
- $947 – $1,759
Heat risk 9/10 · Severe
- Hot days now (above 106°F)
- 7 days/yr
- Hot days in 30 yrs
- 26 days/yr
Wind risk 10/10 · Severe
- Chance of severe wind over 30 yrs
- 99.0%
Air-quality risk 3/10 · Minor
- Unhealthy air days now
- 2 days/yr
- Unhealthy air days in 30 yrs
- 3 days/yr
Risk factors via First Street. Map © Google.
Why this score? — see what drove the D grade
The composite is a weighted blend of 9 inputs, each scored 0–100. Each bar is that input's sub-score; the figure is the points it added to the 100-point composite (weight × sub-score).
- Appreciation +10.0/10.0
- ARV discount +7.5/15.0
- Cash flow +7.3/30.0
- Schools +4.3/10.0
- Livability +3.9/5.0
- Rent growth +3.1/5.0
- 1% rule +2.7/10.0
- Condition / age +2.5/5.0
- DSCR +1.5/10.0
$699,000
🖨 Deal sheet (PDF) 📄 Offer letter ✓ Due diligence
Listing remarks
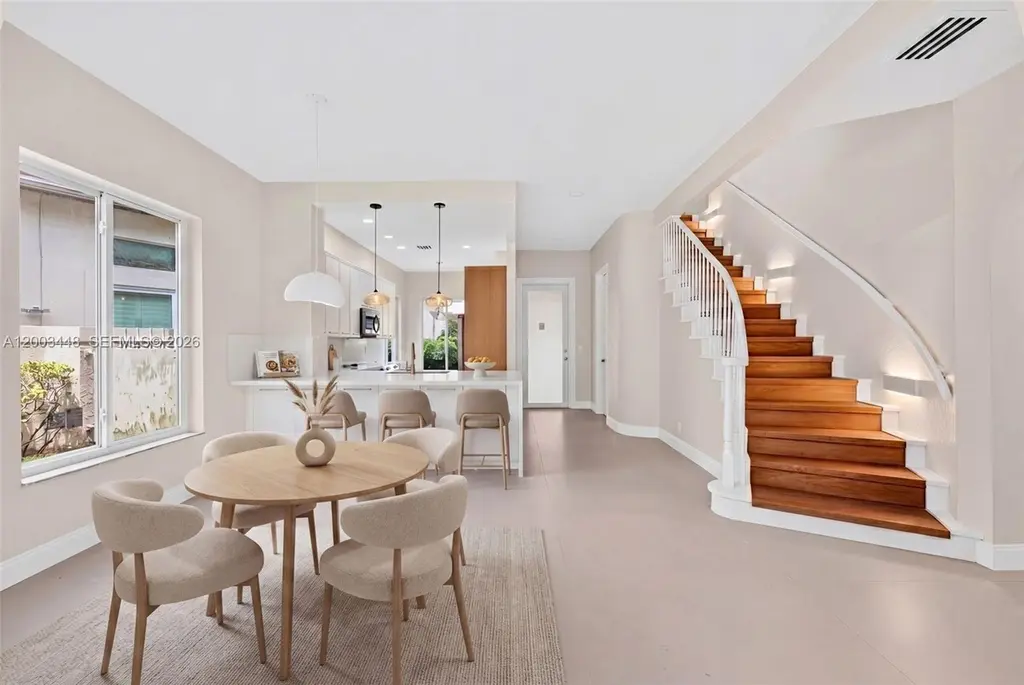
Privately set on a corner homesite, this two-story home offers added space and a quiet setting. Primary master suite on the first floor with an updated bathroom and custom closets. Screened patio with a fully fenced yard and a two-car garage. 2026 impact windows and doors, 2020 roof, 2026 hot water heater. Interior features updated flooring throughout and a well-appointed kitchen and baths with upgraded cabinetry, marble and quartz surfaces, and modern fixtures, lighting, and mirrors. Fresh interior paint. HOA covers exterior insurance and maintenance including roof, gutters, garage door, landscaping, sprinklers, and basic cable.
Key facts
- Screened patio
- Primary master suite
- Corner homesite
Tags
Property features AI
Finance
- Financial info: Pets allowed (dogs OK)
- HOA & community: Monthly association fee; Club membership available; Clubhouse; Fitness center; Golf amenities and golf course community; Game room; Maintained community; Pickleball courts; Community pool; Sauna; Street lights; Sidewalks; Tennis courts; Gated
Exterior
- Parking: Covered parking; Driveway; Paver block driveway; Garage door opener; 2-car garage
- Security: Gated community; Security guard
- Utilities: Cable available; Public water; Public sewer
- Home design: Faces north
- Construction: Block construction; Barrel roof
- Exterior features: Balcony; Enclosed porch; Fenced yard; Security/high-impact doors; Screened porch
Interior
- Kitchen: Dishwasher; Electric range; Disposal; Icemaker; Microwave; Refrigerator
- Bedrooms: Main-level primary bedroom
- Flooring: Ceramic tile; Hardwood; Tile; Wood
- Bathrooms: 2 full bathrooms; 1 half bathroom
- Heating & cooling: Central heating (electric); Central air conditioning (electric); Ceiling fans
- Interior features: Impact glass windows; Accessibility features; Bedroom on main level; Breakfast area; Closet cabinetry; Dining area; Separate formal dining room; Dual sinks; Entrance foyer; First-floor entry; Kitchen/dining combo; Main-level primary bedroom; Vaulted ceilings; Walk-in closets
- Laundry & utility: Washer; Dryer; Electric water heater
Neighborhood map
What this means for you Summary
Snapshot
- This is a 3-bed/2.5-bath single-family listed at $699k.
Deal economics
- At list price, monthly cash flow is $-931 ($-11k/yr) — negative.
- To cash-flow at today's rent, offer at most $535k (23.5% below list).
- To meet the 1% rule (rent ≥ 1% of price), the offer needs to be $537k (23.2% below list).
- Recommended offer: $535k (23.5% below list) — sets the bar for cash-flow.
- Cap rate 4.7% vs local median 2.7% in Boca Raton — top-decile yield for the area; either an underpriced asset or a hidden risk that comps aren't pricing in. Stress-test before assuming the spread holds.
Location & tenants
- Location reads 77/100 on livability (#192 in FL, #3,070 nationally) — a middle-class / working-renter tenant base. Strengths: employment A+, health & safety A+, crime B+; Watch: amenities D, cost of living F.
- Palm Beach (suburban): math 46% / reading 53% proficiency, ranked #34 of 73 in FL (top 47%) — families likely to look elsewhere, expect single-tenant / working-renter base with shorter leases.
- Zoned schools: Calusa Elementary School (math 83% / reading 85%, grade A+, #55 of 2,144 statewide, top 3%, 867 students, 17% FRL); Omni Middle School (math 66% / reading 66%, grade A-, #93 of 571 statewide, top 16%, 1,128 students, 29% FRL); Spanish River Community High School (math 64% / reading 74%, grade B, #63 of 667 statewide, top 10%, 2,578 students, 25% FRL) — zoned schools average 24% FRL vs 52% district-wide (28 pts lower); this property's tenant base skews higher-income than the district average.
- Zoned-school proficiency averages 73% at this address vs 50% district-wide (+24 pts) — the actual schools serving this property are materially stronger than the Palm Beach average implies; a family-tenant draw the district grade alone would hide.
- Market conditions: Rents rising (+2.3%/yr); 330 active listings in the ZIP; 39 comparable units currently listed for rent nearby; rentals at typical pace (median 24d on market — plan ~3-4 weeks tenant-placement turnaround); high-income renter base; 3,974 units permitted in Palm Beach County in 2024 (1,012 in 5+ unit buildings).
Forward outlook
- In year one you build about $75k of equity ($5k loan paydown + $70k appreciation (10.0% local appreciation)).
- Palm Beach County population projected at +30% by 2050 — long-run rental-demand tailwind backs the buy-and-hold thesis.
- By year 2, paydown + projected appreciation supports a ~$120k cash-out refi (75% LTV) — recoverable capital for the next deal without selling this one.
Negotiation context
- It's been on market 65 days — a 6% lower offer ($657k) is reasonable based on typical stale-listing flexibility.
- 14 sale attempts since 27y ago with the ask held roughly flat each time — persistent listings suggest the price (not the market) is what's stuck; bring a comps-based counter.
- Current owner paid $400k; list at $699k implies a 75% gain — meaningful room to come down on a strong offer.
Risks & watch-outs
- Climate carrying-cost: severe wind risk, 99% chance of damaging wind over 30y; extreme-heat days projected 7→26/yr by 2055 (HVAC capex compounding) — expect insurance premiums to compound above CPI over the hold.
Questions for the listing agent
- What do current leases actually rent for vs. the listed asking? Can we see a recent rent roll and the last 12 months of T-12 income?
- It's been on market 65 days. Have you received any prior offers? Is the seller open to a 24% concession, seller financing, or rate buy-down credit?
- What does the HOA fee cover, when was the last increase, and are there any pending special assessments or reserve-fund shortfalls?
- Why hasn't it sold? Are there any deal-killer items the seller is aware of (foundation, flood, title, zoning, code violations)?
- Is there a deadline driving the sale (1031 exchange, divorce, estate, relocation)? That informs how much negotiation room exists.
- Schools are A-rated — typically a magnet for longer-tenancy family renters. What's the average tenant stay here, and is there a school-zone premium baked into asking?
- The area grade is low — what's the realistic commute time and amenity access for the typical tenant pool here? Any planned neighborhood developments (good or bad) we should know about?
- What's the average days-on-market for RENTAL listings here right now (not sales)? A rising rental-DOM trend means longer vacancies and softer asking-rent achievability than the comps imply.
- What's the recent tenant-quality profile in this submarket — average credit score on applications, eviction rate, late-payment / NSF rate, and stable-employment percentage? A property-management company in the area should have these aggregated.
- How much new for-sale + rental construction is in the pipeline within 1–3 miles? Heavy new supply typically softens prices + rents 12–24 months out; constrained supply supports both.
Investment metrics
- 1% rule
- 0.77% ✗
- Cap rate
- 4.69%
- Cash-on-cash
- -5.71%
- DSCR
- 0.75
- GRM
- 10.9
CMA / ARV
No comps found within radius.
Projected returns pro-forma
10.0% appreciation · 2.31% rent growth · sell at horizon
- IRR
- 20.0%
- Equity multiple
- 2.62×
- Total profit
- $317,986
- Equity at exit
- $629,715
- IRR
- 18.2%
- Equity multiple
- 5.99×
- Total profit
- $976,324
- Equity at exit
- $1,358,003
Cash invested: $195,720 (down + closing). Projections, not guarantees.
Landlord ↔ Tenant lean methodology
- Overall (STATE)
- 87 Strongly Landlord-Friendly
- State Florida
- 87 Strongly Landlord-Friendly · R+3
- County
- — inherits STATE
- City
- — inherits STATE
ZIP-level market 33496
- Home prices YoY
- 3.5%
- Rents YoY
- 2.3%
- Active inventory
- 330
- Price-to-rent
- 10.9×
Monthly cashflow live
- Estimated rent
- $5,365 high interval (Pro) →
- Mortgage (P&I)
- −$3,666
- Tax from tax record
- −$438 /mo · $5,252/yr
- Insurance
- −$291
- HOA
- −$775
- Vacancy / Maint / Mgmt
- −$1,127
- Net cashflow
- $-931
Break-even live
Sensitivity live
| Price | -10% $-535 | -5% $-733 | +0% $-931 | +5% $-1,129 | +10% $-1,327 |
|---|---|---|---|---|---|
| Rent | -10% $-1,355 | -5% $-1,143 | +0% $-931 | +5% $-719 | +10% $-507 |
| Rate | -1.0pp $-579 | -0.5pp $-753 | base $-931 | +0.5pp $-1,112 | +1.0pp $-1,296 |
UW: 25.0% down · 7.5% · 30yr · 1.5% tax · 5.0% vac · 8.0% maint · 8.0% mgmt
Financing live
Cash to close
- Down payment
- $174,750
- Closing costs
- $20,970
- Reserves months
- —
- Total cash needed
- —
Loan-product check · same deal, 3 products live
Conventional
25% down · 7.5% · 30yr
- Down + closing
- —
- Monthly P&I
- —
- Monthly cashflow
- —
- DSCR
- —
- Eligible?
- —
Personal DTI + credit; lowest rate.
DSCR
20% down · 8.5% · 30yr
- Down + closing
- —
- Monthly P&I
- —
- Monthly cashflow
- —
- DSCR
- —
- Eligible?
- —
No personal income docs; deal must DSCR.
Hard money
10% down · 12.0% · 12mo
- Down + closing
- —
- Monthly P&I
- —
- Monthly cashflow
- —
- DSCR
- —
- Eligible?
- —
Short-term bridge; refi at stabilization.
Rent comps 39 comps
| Address | Beds | Baths | Sqft | Rent | $/sqft | DOM | Units | Dist |
|---|---|---|---|---|---|---|---|---|
| 2771 NW 49th St Boca Raton, FL | 4.0 | 3.0 | 2596 | $6,195 | $2.39 | 19d | 1 | 0.24mi |
| 2683 NW 45th St Boca Raton, FL | 4.0 | 2.5 | 2371 | $6,750 | $2.85 | 7d | 1 | 0.34mi |
| 2431 NW 59th St #404 Boca Raton, FL | 3.0 | 2.5 | 1957 | $10,000 | $5.11 | 26d | 1 | 0.38mi |
| 5801 NW 24th Ave #1001 Boca Raton, FL | 3.0 | 2.5 | 1957 | $13,000 | $6.64 | 18d | 1 | 0.52mi |
| 2598 NW 36th St Boca Raton, FL | 3.0 | 2.0 | 1800 | $4,900 | $2.72 | 26d | 1 | 0.86mi |
| 2464 NW 66th Dr Boca Raton, FL | 3.0 | 3.5 | 2568 | $10,000 | $3.89 | 26d | 1 | 0.88mi |
| 2237 NW 53rd St Boca Raton, FL | 3.0 | 3.5 | 2305 | $25,000 | $10.85 | 26d | 1 | 0.88mi |
| 3509 NW 26th Ct Boca Raton, FL | 3.0 | 3.0 | 1804 | $5,100 | $2.83 | 19d | 1 | 0.89mi |
| 2485 NW 66th Dr Boca Raton, FL | 3.0 | 2.5 | 2472 | $9,500 | $3.84 | 26d | 1 | 0.89mi |
| 2485 NW 66th Dr Boca Raton, FL | 3.0 | 2.5 | 2472 | $9,500 | $3.84 | 12d | 1 | 0.89mi |
| 3509 NW 25th Way Boca Raton, FL | 3.0 | 2.0 | 1427 | $5,200 | $3.64 | 26d | 1 | 0.90mi |
| 2218 NW 52nd St Boca Raton, FL | 2.0 | 2.5 | 1482 | $13,000 | $8.77 | 26d | 1 | 0.92mi |
| 19550 Sawgrass Dr #2102 Boca Raton, FL | 2.0 | 2.0 | 1460 | $5,500 | $3.77 | 26d | 1 | 0.97mi |
| 3374 NW 28th Ter Boca Raton, FL | 3.0 | 2.5 | 2268 | $5,450 | $2.40 | 26d | 1 | 0.97mi |
| 3289 NW 25th Way Unit 3289 Boca Raton, FL | 3.0 | 2.0 | 1622 | $4,500 | $2.77 | 18d | 1 | 0.98mi |
| 3289 NW 25th Way Boca Raton, FL | 3.0 | 2.0 | 1622 | $4,500 | $2.77 | 26d | 1 | 0.98mi |
| 2093 NW 52nd St Unit 2093 Boca Raton, FL | 3.0 | 2.5 | 1835 | $13,000 | $7.08 | 26d | 1 | 1.01mi |
| 3113 Clint Moore Rd #103 Boca Raton, FL | 3.0 | 2.0 | 1268 | $3,100 | $2.44 | 9d | 1 | 1.03mi |
| 3113 Clint Moore Rd #103 Boca Raton, FL | 3.0 | 2.0 | 1268 | $3,200 | $2.52 | 22d | 1 | 1.03mi |
| 3153 Clint Moore Rd #108 Boca Raton, FL | 2.0 | 2.0 | 1303 | $2,600 | $2.00 | 26d | 1 | 1.04mi |
| 3151 Clint Moore Rd #103 Boca Raton, FL | 3.0 | 2.0 | 1497 | $3,145 | $2.10 | 26d | 1 | 1.05mi |
| 3143 Clint Moore Rd #105 Boca Raton, FL | 3.0 | 2.0 | 1497 | $3,250 | $2.17 | 26d | 1 | 1.05mi |
| 2034 NW 52nd St Boca Raton, FL | 2.0 | 2.5 | 1527 | $12,000 | $7.86 | 26d | 1 | 1.06mi |
| 2011 NW 53rd St Boca Raton, FL | 3.0 | 2.5 | 2461 | $11,000 | $4.47 | 14d | 1 | 1.09mi |
| 5555 N Military Trl Boca Raton, FL | 2.0–3.0 | 2.0–3.0 | 1282 | $5,069 | $3.95 | 3d | 21 | 1.11mi |
| 3068 NW 25th Way Boca Raton, FL | 4.0 | 2.5 | 1695 | $5,200 | $3.07 | 9d | 1 | 1.14mi |
| 3068 NW 25th Way Boca Raton, FL | 4.0 | 2.5 | 1695 | $5,200 | $3.07 | 0d | 1 | 1.14mi |
| 3048 NW 25th Way Boca Raton, FL | 4.0 | 2.0 | 2000 | $4,300 | $2.15 | 12d | 1 | 1.15mi |
| 3210 NW 23rd Ter Boca Raton, FL | 3.0 | 2.0 | 1742 | $6,300 | $3.62 | 26d | 1 | 1.16mi |
| 7067 Rain Forest Dr Boca Raton, FL | 2.0 | 2.0 | 1271 | $3,000 | $2.36 | 26d | 1 | 1.17mi |
| 2411 NW 31st St Boca Raton, FL | 3.0 | 2.0 | 1777 | $5,800 | $3.26 | 1d | 1 | 1.17mi |
| 2411 NW 31st St Boca Raton, FL | 3.0 | 2.0 | 1777 | $5,800 | $3.26 | 26d | 1 | 1.17mi |
| 3299 Clint Moore Rd Boca Raton, FL | 2.0 | 2.0 | 1261 | $2,300 | $1.82 | 19d | 1 | 1.20mi |
| 3299 Clint Moore Rd Boca Raton, FL | 2.0 | 2.0 | 1261 | $2,348 | $1.86 | 24d | 2 | 1.20mi |
| 3299 Clint Moore Rd #202 Boca Raton, FL | 2.0 | 2.0 | 1261 | $2,300 | $1.82 | 7d | 1 | 1.20mi |
| 6503 N Military Trl Boca Raton, FL | 1.0–2.0 | 1.0–2.0 | 1155 | $3,211 | $2.78 | 1d | 51 | 1.28mi |
| 5500 N Military Trl Boca Raton, FL | 1.0–3.0 | 1.0–2.0 | 1053 | $5,619 | $5.33 | 1d | 26 | 1.28mi |
| 6797 Willow Wood Dr #6034 Boca Raton, FL | 2.0 | 2.0 | 1260 | $4,900 | $3.89 | 26d | 1 | 1.45mi |
| 6805 Willow Wood Dr #5042 Boca Raton, FL | 2.0 | 2.0 | 1260 | $5,500 | $4.37 | 24d | 1 | 1.45mi |
HOA detail
- Monthly dues
- $775 · $9,300/yr
- Likely covers
- watercablelandscaping
Listing history 50 events
-
2026-06-21days on market $699,000 Active 65 DOM
-
2026-06-18days on market $699,000 Active 62 DOM
-
2026-06-17days on market $699,000 Active 61 DOM
-
2026-06-16days on market $699,000 Active 60 DOM
-
2026-06-15days on market $699,000 Active 59 DOM
-
2026-06-13days on market $699,000 Active 57 DOM
-
2026-06-09days on market $699,000 Active 53 DOM
-
2026-06-08days on market $699,000 Active 52 DOM
-
2026-06-07days on market $699,000 Active 51 DOM
-
2026-06-04days on market $699,000 Active 48 DOM
-
2026-06-03days on market $699,000 Active 47 DOM
-
2026-06-02days on market $699,000 Active 46 DOM
-
2026-06-01days on market $699,000 Active 45 DOM
-
2026-05-31days on market $699,000 Active 44 DOM
-
2026-04-17$699,000 Active
-
2025-12-11soldstatus $400,000
-
2015-08-11historical
-
2015-05-26price $239,900
-
2015-05-06price $264,900
-
2015-05-01$279,000 Active
-
2015-02-01historical
-
2015-01-31historical Contingent
-
2015-01-12$279,999 Active
-
2014-12-02historical
-
2014-10-22soldstatus $147,000 Closed
-
2014-09-04status Pending
-
2014-09-04historical
-
2014-08-28historical Contingent
-
2014-06-07$162,900 Active
-
2014-01-30historical
-
2013-12-20price $150,000
-
2013-12-02$137,000 Active
-
2013-11-26historical
-
2013-10-04price $137,000
-
2013-09-24status Active
-
2013-09-22historical
-
2013-09-21historical
-
2013-09-19status Pending
-
2013-09-19price $150,000 Active
-
2013-09-19status Active
-
2013-09-06status Pending
-
2013-07-29price $147,500
-
2013-05-15status Back On Market
-
2013-02-04historical
-
2012-07-25$159,000
-
2006-11-01$550,000
-
2004-09-28soldstatus $349,000
-
2004-09-23soldstatus $349,000
-
2004-07-20historical
-
2004-06-03$359,000
ⓘ Source: listings_history table (triggers on properties + properties_extension) + one-shot
backfill from property_details.listing_events for pre-trigger history.
Tax reassessment forecast FL · Resets to sale price
- Current annual tax
- $5,252 · $438/mo
- Projected year-2 tax
- $5,802 · $483/mo
- Expected delta
- +$550/yr (+$46/mo · 10.5%)
ⓘ Screening estimate from a state-policy table — verify with the county assessor before closing.
Climate risk First Street
- Flood 1/10 Low FEMA zone X (unshaded) · 0% chance over 30 yrs
- Wildfire 1/10 Low
- Heat 9/10 Extreme 7 d/yr ≥106°F today · 26 d/yr by 30 yrs out
- Wind 10/10 Extreme 99% chance of damaging wind over 30 yrs
- Air quality 3/10 Moderate 2 unhealthy d/yr today · 3 by 30 yrs out
Nearby sold comps map
Loading sold comps map…
Walkable amenities ~0.75 mi
Loading nearby amenities…
Taxation est. · year 1
- Rental income
- $64,383
- − Mortgage interest
- −$39,155
- − Property taxes
- −$5,252
- − Insurance
- −$3,495
- − Repairs & maintenance
- −$5,151
- − Management
- −$5,151
- − HOA
- −$9,300
- − Depreciation
- −$20,335
- Taxable loss
- −$23,455
- Est. tax savings @ 24.0%
- +$5,629
- After-tax cash flow
- $-5,543/yr
For passive investors: Depreciation is non-cash, so a rental often shows a tax loss while cash-flowing — sheltering income. Rental losses are passive: they offset passive income freely, and up to $25,000/yr can offset ordinary (W-2) income if you actively participate and your MAGI is under $100k (phasing out to $0 by $150k); unused losses carry forward. On sale, claimed depreciation is recaptured at up to 25%, and gains may owe capital-gains tax (a 1031 exchange can defer both). Figures are a year-1 estimate at your 24.0% rate — not tax advice; consult a CPA.
Schools (NCES district)
- District
- Palm Beach
- NCES district ID
- 1201500
- Math proficiency
- 46% ▼ -16.00%
- Reading proficiency
- 53% ▼ -4.00%
- Median HH income
- $53,943
- Composite
- 42.72/100
- National rank
- #3160
- State rank
- #34 of 73 in FL
Livability — Boca Raton
- Score
- 77/100
- State rank
- #192
- US rank
- #3070
Category grades
Schools grade is shown separately in the Schools card above.
Census & demographics
- Census place
- Boca Raton, FL
- County
- Palm Beach County · 1,438,312 people
- City population
- 250,102
- Metro
- Miami-Fort Lauderdale-Pompano Beach, FL
- Population (ZIP)
- 26,579
- Household income
- $114,885
- Rent vs Own
- Severe rent burden
- 464.0
Population outlook (Palm Beach County) Hauer SSP2
- Today (2025)
- 1,637,487 people
- By 2030
- 1,743,255 · +6.5%
- By 2040
- 1,948,712 · +19.0%
- By 2050
- 2,132,979 · +30.3%
- By 2075
- 2,530,027 · +54.5%
- By 2100
- 2,706,979 · +65.3%
Race, ethnicity, and origin ACS 2023
- Neighborhood character
- Predominantly White (79%)
- Race & ethnicity
- White 79% Hispanic / Latino 11% Two or more races 8% Asian 5% Black 2%
- Hispanic origin (detail)
- Puerto Rican 3%
- Common ancestry
- Scotch-Irish 13% Romanian 9% Italian 3%
- Foreign-born
- 24% · Canada, Jamaica, Dominican Republic
- Languages at home
- 75% English-only · Spanish 9% Other Indo-European 5% Russian/Polish/Slavic 4%
Political lean MEDSL · Palm Beach
- 2024 margin
- Toss-up / Even · D 50.0% · R 49.2%
- 2008→2024 swing
- -22.1pp toward R · 2008: 22.9pp · 2024: 0.8pp
- All cycles
- 2024: D+0.8 2020: D+12.8 2016: D+15.3 2012: D+17.0 2008: D+22.9
Not yet ingested
- Civics
- —
Market trends
- HPI YoY
- ▲ 10.48%
- Current HPI
- 313.9058
- Rent YoY
- ▲ 2.31%
- Metro
- Miami-Fort Lauderdale-Pompano Beach, FL
- State GDP YoY
- ▲ 3.28%
- F500 in state
- 36
Industry mix (Fortune 500 HQ in FL)
| Industry | F500 HQs | Revenue |
|---|---|---|
| Industrial Technology | 2 | $29B |
|
||
| Insurance | 2 | $17B |
|
||
| Retail | 1 | $60B |
|
||
| Technology Distribution | 1 | $58B |
|
||
| Homebuilding | 1 | $35B |
|
||
| Technology Manufacturing | 1 | $35B |
|
||
Price history
+304.0% since first listed44 events — show timeline
- 2026-04-17 Listed $699,000 MARMLS
- 2025-12-11 Sold (Public Records) $400,000 Public Records
- 2015-08-11 Listing Removed — Beaches MLS
- 2015-05-26 Price Changed $239,900 Beaches MLS
- 2015-05-06 Price Changed $264,900 Beaches MLS
- 2015-05-01 Listed $279,000 Beaches MLS
- 2015-02-01 Listing Removed — Beaches MLS
- 2015-01-31 Contingent — Beaches MLS
- 2015-01-12 Listed $279,999 Beaches MLS
- 2014-12-02 Listing Removed — Beaches MLS
- 2014-10-22 Sold (MLS) $147,000 Beaches MLS
- 2014-09-04 Pending — Beaches MLS
- 2014-09-04 Listing Removed — Beaches MLS
- 2014-08-28 Contingent — Beaches MLS
- 2014-06-07 Listed $162,900 Beaches MLS
- 2014-01-30 Listing Removed — Beaches MLS
- 2013-12-20 Price Changed $150,000 Beaches MLS
- 2013-12-02 Listed $137,000 Beaches MLS
- 2013-11-26 Listing Removed — Beaches MLS
- 2013-10-04 Price Changed $137,000 Beaches MLS
- 2013-09-24 Relisted — Beaches MLS
- 2013-09-22 Listing Removed — Beaches MLS
- 2013-09-21 Listing Removed — Beaches MLS
- 2013-09-19 Pending — Beaches MLS
- 2013-09-19 Relisted — Beaches MLS
- 2013-09-19 Price Changed $150,000 Beaches MLS
- 2013-09-06 Pending — Beaches MLS
- 2013-07-29 Price Changed $147,500 Beaches MLS
- 2013-05-15 Relisted — Beaches MLS
- 2013-02-04 Listing Removed — Beaches MLS
- 2012-07-25 Listed $159,000 Beaches MLS
- 2006-11-01 Listed $550,000 Beaches MLS
- 2004-09-28 Sold (Public Records) $349,000 Public Records
- 2004-09-23 Sold (MLS) $349,000 Beaches MLS
- 2004-07-20 Listing Removed — Beaches MLS
- 2004-06-03 Listed $359,000 Beaches MLS
- 2004-03-31 Listing Removed — Beaches MLS
- 2004-01-30 Listed $349,000 Beaches MLS
- 2000-04-13 Sold (Public Records) $223,000 Public Records
- 2000-04-03 Sold (MLS) $223,000 Beaches MLS
- 2000-03-21 Listing Removed — Beaches MLS
- 1999-10-15 Listed $229,898 Beaches MLS
- 1999-02-21 Listed $249,000 Beaches MLS
- 1993-01-14 Sold (Public Records) $173,000 Public Records
Property tax history
+1.6%/yrLatest (2025): $5,252 · +4.1% YoY. Source: county tax records.
Cash-flow waterfall
monthlySold comps — $/sqft
last 12 mo · ≤1 miLoading sold comps…