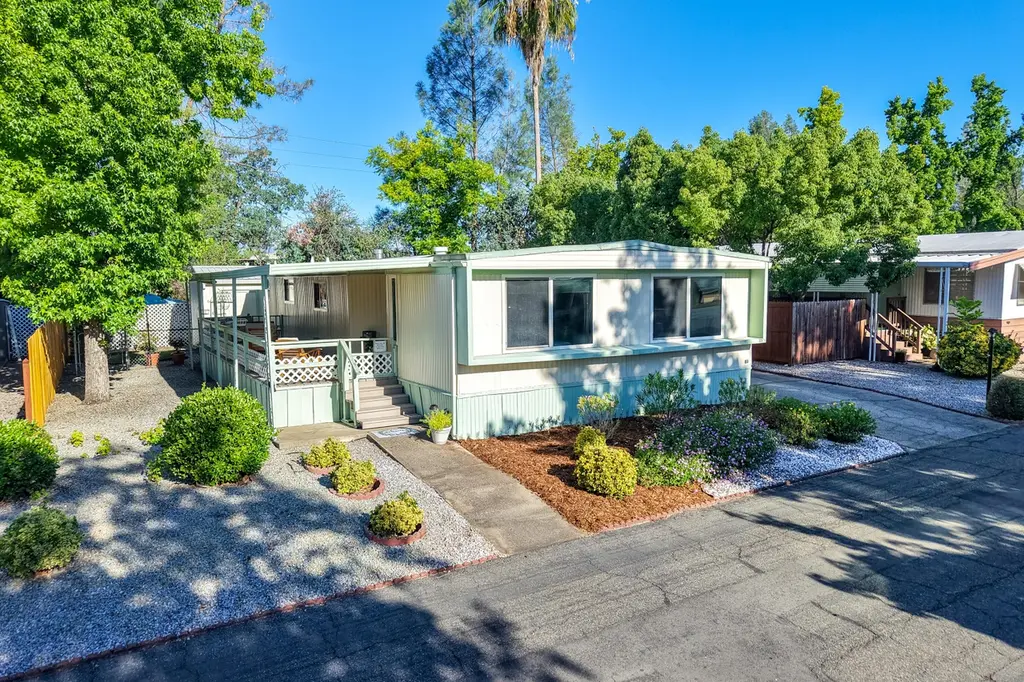
1221 E Cypress Ave Spc 309 · Redding, CA
Flood risk 1/10 · Minimal
- FEMA flood zone
- X (unshaded)
- Chance of flooding over 30 yrs
- 0.0%
- Est. flood insurance / yr
- $507 – $1,088
Fire risk 3/10 · Minor
- Est. fire insurance / yr
- $659 – $1,223
Heat risk 8/10 · Major
- Hot days now (above 106°F)
- 7 days/yr
- Hot days in 30 yrs
- 14 days/yr
Wind risk 1/10 · Minimal
- Chance of severe wind over 30 yrs
- —
Air-quality risk 10/10 · Severe
- Unhealthy air days now
- 37 days/yr
- Unhealthy air days in 30 yrs
- 40 days/yr
Risk factors via First Street. Map © Google.
Why this score? — see what drove the C+ grade
The composite is a weighted blend of 9 inputs, each scored 0–100. Each bar is that input's sub-score; the figure is the points it added to the 100-point composite (weight × sub-score).
- Cash flow +24.7/30.0
- DSCR +8.0/10.0
- ARV discount +7.5/15.0
- 1% rule +6.4/10.0
- Schools +4.6/10.0
- Livability +3.8/5.0
- Rent growth +3.0/5.0
- Condition / age +2.5/5.0
- Appreciation +0.0/10.0
$139,000
🖨 Deal sheet 📄 Offer letter ✓ Due diligence
Listing remarks
Fall in love with this beautifully updated Redding retreat located inside the gated Starlite Mobile Estates, an inviting all-ages community. This upgraded 2-bedroom, 2-bath double-wide offers comfort, style, and thoughtful improvements throughout. Step inside to an open, welcoming layout featuring central heat and air, dual-pane windows, and a remodeled kitchen complete with a stainless steel 5-burner natural gas cooktop, built-in oven with warming drawer, tile backsplash, and abundant custom cabinetry and countertop space. Both bathrooms have been tastefully updated. The guest bath features a tile stall shower, modern cabinet, and countertop. The spacious primary suite includes a walk-in c
Key facts
- Walk-in closet
- Remodeled kitchen
- Tile stall shower
Tags
Property features AI
Exterior
- Parking: Carport (1 space)
- Home design: Manufactured in park (mobile home); Located in Starlite park
- Construction: Aluminum siding; Pillar/post/pier foundation; Other roof material
- Exterior features: Deck; Chain link fencing; Level topography; Asphalt road access
Interior
- Kitchen: Convection oven; Cooktop; Oven
- Flooring: Vinyl flooring; Carpet
- Heating & cooling: Central air conditioning; Forced air heating
- Interior features: Washer and dryer included; Convection oven and cooktop; Standard oven
- Laundry & utility: Washer; Dryer
Neighborhood map
What this means for you Summary
Snapshot
- This is a 2-bed/2.0-bath manufactured listed at $139k.
Deal economics
- At list price, monthly cash flow is $291 ($3k/yr) — positive.
- The deal already cash-flows at list — no discount required.
- Meets the 1% rule at list price ($2k rent vs $139k).
- Cap rate 8.8% vs local median 3.3% in Redding — top-decile yield for the area; either an underpriced asset or a hidden risk that comps aren't pricing in. Stress-test before assuming the spread holds.
Location & tenants
- Location reads 76/100 on livability (#106 in CA, #3,726 nationally) — a middle-class / working-renter tenant base. Strengths: amenities A+, commute A+, health & safety A+; Watch: employment C-, crime F, cost of living F.
- Shasta Union High (urban): math 41% / reading 67% proficiency, ranked #122 of 517 in CA (top 24%) — acceptable for families but not a draw, mixed tenant base, ~2y average lease; only 16% free/reduced lunch — higher-income household profile.
- Market conditions: Rents rising (+1.9%/yr); 286 active listings in the ZIP; 28 comparable units currently listed for rent nearby; rentals leasing fast (median 13d on market — plan ~1-2 weeks tenant-placement turnaround); 246 units permitted in Shasta County in 2024 (0 in 5+ unit buildings).
Forward outlook
- Local home prices are declining (-3.0%/yr); year-one equity from $961 of loan paydown is wiped out by about $4k of value loss. Plan a longer hold.
- Shasta County population projected to shrink 9% by 2050 — rents likely to lag national; underwrite the cash flow, not the appreciation.
Negotiation context
- Only 7 days on market — expect competitive offers; lowballing is unlikely to land.
Risks & watch-outs
- Climate carrying-cost: extreme-heat days projected 7→14/yr by 2055 (HVAC capex compounding) — expect insurance premiums to compound above CPI over the hold.
Questions for the listing agent
- Built in 1971 — when were the roof, HVAC, electrical panel, plumbing, and water heater last replaced?
- Is there a deadline driving the sale (1031 exchange, divorce, estate, relocation)? That informs how much negotiation room exists.
- Schools are B-rated — typically a magnet for longer-tenancy family renters. What's the average tenant stay here, and is there a school-zone premium baked into asking?
- Crime grade is F in this area — have there been break-ins, vandalism, or insurance claims at this property in the last 3 years? What carrier currently insures it and at what premium?
- What's the average days-on-market for RENTAL listings here right now (not sales)? A rising rental-DOM trend means longer vacancies and softer asking-rent achievability than the comps imply.
- What's the recent tenant-quality profile in this submarket — average credit score on applications, eviction rate, late-payment / NSF rate, and stable-employment percentage? A property-management company in the area should have these aggregated.
- How much new for-sale + rental construction is in the pipeline within 1–3 miles? Heavy new supply typically softens prices + rents 12–24 months out; constrained supply supports both.
Investment metrics
- 1% rule
- 1.14% ✓
- Cap rate
- 8.80%
- Cash-on-cash
- 8.97%
- DSCR
- 1.40
- GRM
- 7.3
CMA / ARV
- ARV (on-the-fly)
- $74,664
- Comps found
- 2
Show comp detail 2 sales within ~0.75 mi
| Address | Dist | Beds/Ba | Sqft | Sold | Price | $/sf | Match |
|---|---|---|---|---|---|---|---|
| 1221 E Cypress Ave #35 | 0.00mi | 2/2.0 | 1,340 (+10%) | 16mo | $82,000 | $61 | 71 |
| 1221 E Cypress Ave #56 | 0.00mi | 2/2.0 | 1,080 (-12%) | 18mo | $56,500 | $52 | 65 |
Match score weights: distance 35% · size 25% · config 20% · recency 20%. Top-matched comps best support the ARV.
Projected returns pro-forma
-3.0% appreciation · 1.88% rent growth · sell at horizon
- IRR
- -4.0%
- Equity multiple
- 0.85×
- Total profit
- $-5,740
- Equity at exit
- $20,725
- IRR
- 4.4%
- Equity multiple
- 1.31×
- Total profit
- $11,871
- Equity at exit
- $12,018
Cash invested: $38,920 (down + closing). Projections, not guarantees.
Landlord ↔ Tenant lean methodology
- Overall (STATE)
- 18 Strongly Tenant-Friendly
- State California
- 18 Strongly Tenant-Friendly · D+13
- County
- — inherits STATE
- City
- — inherits STATE
ZIP-level market 96002
- Rents YoY
- 1.9%
- Active inventory
- 286
- Price-to-rent
- 7.3×
Monthly cashflow live
- Estimated rent
- $1,584 high interval (Pro) →
- Mortgage (P&I)
- −$729
- Tax est. 1.5%
- −$174 /mo · $2,085/yr
- Insurance
- −$58
- HOA
- −$0
- Vacancy / Maint / Mgmt
- −$333
- Net cashflow
- $291
Break-even live
UW: 25.0% down · 7.5% · 30yr · 1.5% tax · 5.0% vac · 8.0% maint · 8.0% mgmt
Financing live
Cash to close
- Down payment
- $34,750
- Closing costs
- $4,170
- Reserves months
- —
- Total cash needed
- —
Loan-product check · same deal, 3 products live
Conventional
25% down · 7.5% · 30yr
- Down + closing
- —
- Monthly P&I
- —
- Monthly cashflow
- —
- DSCR
- —
- Eligible?
- —
Personal DTI + credit; lowest rate.
DSCR
20% down · 8.5% · 30yr
- Down + closing
- —
- Monthly P&I
- —
- Monthly cashflow
- —
- DSCR
- —
- Eligible?
- —
No personal income docs; deal must DSCR.
Hard money
10% down · 12.0% · 12mo
- Down + closing
- —
- Monthly P&I
- —
- Monthly cashflow
- —
- DSCR
- —
- Eligible?
- —
Short-term bridge; refi at stabilization.
Rent comps 28 comps
| Address | Beds | Baths | Sqft | Rent | $/sqft | DOM | Units | Dist |
|---|---|---|---|---|---|---|---|---|
| 1295 Downard Ln Apt 5 Redding, CA | 2.0 | 1.0 | 800 | $1,199 | $1.50 | 13d | 1 | 0.17mi |
| 2821 Blue View St Redding, CA | 2.0 | 1.0 | 1000 | $1,595 | $1.59 | 13d | 1 | 0.28mi |
| 1063 Del Sol Pl Unit D Redding, CA | 2.0 | 1.5 | 941 | $1,350 | $1.43 | 13d | 1 | 0.66mi |
| 2351 Victor Ave Redding, CA | 2.0 | 1.5 | 900 | $1,400 | $1.56 | 13d | 1 | 0.68mi |
| 1631 Bramble Pl Unit 1 Redding, CA | 2.0 | 1.0 | 900 | $1,295 | $1.44 | 13d | 1 | 0.73mi |
| 1601 Bramble Pl Unit 4 Redding, CA | 2.0 | 1.0 | 750 | $1,250 | $1.67 | 13d | 1 | 0.74mi |
| 3220 C St Redding, CA | 2.0 | 1.5 | 886 | $1,500 | $1.69 | 13d | 1 | 0.76mi |
| 1933 Wheeler St Redding, CA | 3.0 | 2.0 | 1242 | $2,000 | $1.61 | 13d | 1 | 0.79mi |
| 3512 Adams Ln Unit 8 Redding, CA | 2.0 | 1.0 | 900 | $1,375 | $1.53 | 13d | 1 | 0.91mi |
| 1975 Bechelli Ln Redding, CA | 2.0 | 2.0 | 1347 | $1,850 | $1.37 | 21d | 1 | 0.94mi |
| 1013 Echo Rd Redding, CA | 2.0 | 1.0 | 768 | $1,375 | $1.79 | 13d | 1 | 0.95mi |
| 1006 2nd St Unit A Redding, CA | 2.0 | 1.0 | 700 | $1,175 | $1.68 | 13d | 1 | 1.02mi |
| 712 Kerryjen Ct Unit B Redding, CA | 2.0 | 1.0 | 850 | $1,300 | $1.53 | 21d | 1 | 1.07mi |
| 3629 Bechelli Ln Redding, CA | 1.0–2.0 | 1.0 | 769 | $1,650 | $2.15 | 13d | 1 | 1.12mi |
| 1701 Dana Dr Redding, CA | 2.0–3.0 | 1.5 | 1070 | $1,675 | $1.57 | 13d | 1 | 1.20mi |
| 1580 Dana Dr Unit 3 Redding, CA | 2.0 | 1.5 | 950 | $1,450 | $1.53 | 13d | 1 | 1.26mi |
| 3773 Ricardo Ave Redding, CA | 3.0 | 3.0 | 1404 | $1,995 | $1.42 | 13d | 1 | 1.30mi |
| 3980 Churn Creek Rd Redding, CA | 2.0 | 1.0 | 755 | $1,295 | $1.72 | 13d | 1 | 1.34mi |
| 2510 Hartnell Ave Unit 9 Redding, CA | 2.0 | 1.0 | 835 | $1,380 | $1.65 | 21d | 1 | 1.37mi |
| 3996 Morningsun Dr Redding, CA | 3.0 | 2.0 | 1384 | $1,975 | $1.43 | 13d | 1 | 1.40mi |
| 2155 Park Marina Dr Redding, CA | 2.0 | 1.0 | 905 | $1,400 | $1.55 | 13d | 1 | 1.41mi |
| 1238 Old Alturas Rd Redding, CA | 3.0 | 2.0 | 1175 | $2,350 | $2.00 | 13d | 1 | 1.44mi |
| 1232 Burton Ct Unit 3 Redding, CA | 2.0 | 1.5 | 900 | $1,395 | $1.55 | 13d | 1 | 1.44mi |
| 2604 Wilson Ave Apt 1 Redding, CA | 2.0 | 1.0 | 800 | $1,129 | $1.41 | 13d | 1 | 1.45mi |
| 1233 Bundy Ct Unit 6 Redding, CA | 2.0 | 2.0 | 1000 | $1,595 | $1.59 | 13d | 1 | 1.46mi |
| 1230 Old Alturas Rd Redding, CA | 3.0 | 2.0 | 1387 | $2,350 | $1.69 | 13d | 1 | 1.46mi |
| 1252 Old Alturas Rd Redding, CA | 3.0 | 2.0 | 1175 | $2,250 | $1.91 | 13d | 1 | 1.48mi |
| 1256 Old Alturas Rd Redding, CA | 3.0 | 2.0 | 1387 | $2,350 | $1.69 | 13d | 1 | 1.49mi |
Listing history 7 events
-
2026-06-19days on market $139,000 Active 7 DOM
-
2026-06-18days on market $139,000 Active 6 DOM
-
2026-06-17days on market $139,000 Active 5 DOM
-
2026-06-16days on market $139,000 Active 4 DOM
-
2026-06-15days on market $139,000 Active 3 DOM
-
2026-06-13remarks 699-char remark
-
2026-06-13$139,000 Active 1 DOM
ⓘ Source: listings_history table (triggers on properties + properties_extension) + one-shot
backfill from property_details.listing_events for pre-trigger history.
Climate risk First Street
- Flood 1/10 Low FEMA zone X (unshaded) · 0% chance over 30 yrs
- Wildfire 3/10 Moderate
- Heat 8/10 Severe 7 d/yr ≥106°F today · 14 d/yr by 30 yrs out
- Wind 1/10 Low
- Air quality 10/10 Extreme 37 unhealthy d/yr today · 40 by 30 yrs out
Nearby sold comps map
Loading sold comps map…
Walkable amenities ~0.75 mi
Loading nearby amenities…
Taxation est. · year 1
- Rental income
- $19,010
- − Mortgage interest
- −$7,786
- − Property taxes
- −$2,085
- − Insurance
- −$695
- − Repairs & maintenance
- −$1,521
- − Management
- −$1,521
- − Depreciation
- −$4,044
- Taxable income
- $1,358
- Est. tax owed @ 24.0%
- −$326
- After-tax cash flow
- $3,164/yr
For passive investors: Depreciation is non-cash, so a rental often shows a tax loss while cash-flowing — sheltering income. Rental losses are passive: they offset passive income freely, and up to $25,000/yr can offset ordinary (W-2) income if you actively participate and your MAGI is under $100k (phasing out to $0 by $150k); unused losses carry forward. On sale, claimed depreciation is recaptured at up to 25%, and gains may owe capital-gains tax (a 1031 exchange can defer both). Figures are a year-1 estimate at your 24.0% rate — not tax advice; consult a CPA.
Schools (NCES district)
- District
- Shasta Union High
- NCES district ID
- 0636600
- Math proficiency
- 41% ▲ 3.00%
- Reading proficiency
- 67% ▲ 9.00%
- Median HH income
- $50,080
- Composite
- 46.01/100
- National rank
- #2532
- State rank
- #122 of 517 in CA
Livability — Redding
- Score
- 76/100
- State rank
- #106
- US rank
- #3726
Category grades
Schools grade is shown separately in the Schools card above.
Census & demographics
- Census place
- Redding, CA
- County
- Shasta County · 147,641 people
- City population
- 112,523
- Metro
- Redding, CA
- Population (ZIP)
- 33,783
- Household income
- $73,222
- Rent vs Own
- Severe rent burden
- 1026.0
Population outlook (Shasta County) Hauer SSP2
- Today (2025)
- 179,231 people
- By 2030
- 176,953 · -1.3%
- By 2040
- 169,982 · -5.2%
- By 2050
- 162,547 · -9.3%
- By 2075
- 145,649 · -18.7%
- By 2100
- 123,025 · -31.4%
Race, ethnicity, and origin ACS 2023
- Neighborhood character
- Predominantly White (72%)
- Race & ethnicity
- White 72% Hispanic / Latino 13% Two or more races 12% Asian 6% Native American 2% Black 1%
- Hispanic origin (detail)
- Mexican 10%
- Common ancestry
- Italian 4% Lithuanian 2% Slovak 2%
- Foreign-born
- 5% · Canada
- Languages at home
- 91% English-only · Spanish 4% Other Asian/Pacific 2% Other Indo-European 1%
Political lean MEDSL · Shasta
- 2024 margin
- Solid R (+36.5) · D 30.5% · R 67.0% · Other 2.5%
- 2008→2024 swing
- -10.7pp toward R · 2008: -25.8pp · 2024: -36.5pp
- All cycles
- 2024: R+36.5 2020: R+33.1 2016: R+37.4 2012: R+30.3 2008: R+25.8
Not yet ingested
- Civics
- —
Market trends
- HPI YoY
- ▼ -248.70%
- Current HPI
- 319.713
- Rent YoY
- ▲ 1.88%
- Metro
- Redding, CA
- State GDP YoY
- ▲ 3.21%
- F500 in state
- 116
Industry mix (Fortune 500 HQ in CA)
| Industry | F500 HQs | Revenue |
|---|---|---|
| Technology | 27 | $1,492B |
|
||
| Financial Services | 3 | $174B |
|
||
| Retail | 3 | $44B |
|
||
| Insurance | 3 | $26B |
|
||
| Media / Entertainment | 2 | $115B |
|
||
| Pharmaceuticals / Biotech | 2 | $62B |
|
||
Price history
1 event — show timeline
- 2026-06-12 Listed $139,000 SAOR
Cash-flow waterfall
monthlySold comps — $/sqft
last 12 mo · ≤1 miLoading sold comps…